Industrial Iot Gateway Market Analysis, Size, and Forecast 2026-2030: North America (US, Canada, and Mexico), APAC (China, India, and Japan), Europe (Germany, UK, and France), South America (Brazil and Argentina), Middle East and Africa (Saudi Arabia, UAE, and South Africa), and Rest of World (ROW)

Industrial Iot Gateway Market Analysis, Size, and Forecast 2026-2030:
North America (US, Canada, and Mexico), APAC (China, India, and Japan), Europe (Germany, UK, and France), South America (Brazil and Argentina), Middle East and Africa (Saudi Arabia, UAE, and South Africa), and Rest of World (ROW)

Published: Mar 2026 301 Pages SKU: IRTNTR44685

Market Overview at a Glance

$5.83 B
Market Opportunity
26.7%
CAGR 2025 - 2030
37.4%
North America Growth
$772 Mn
Bluetooth segment 2024

Industrial Iot Gateway Market Size 2026-2030

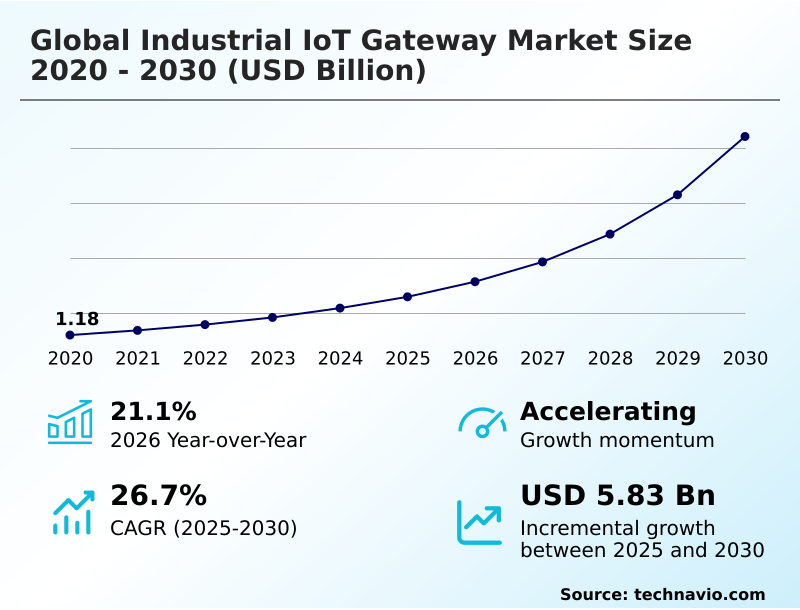
The industrial iot gateway market size is valued to increase by USD 5.83 billion, at a CAGR of 26.7% from 2025 to 2030. Leveraging manufacturing data for predictive maintenance will drive the industrial iot gateway market.

Major Market Trends & Insights

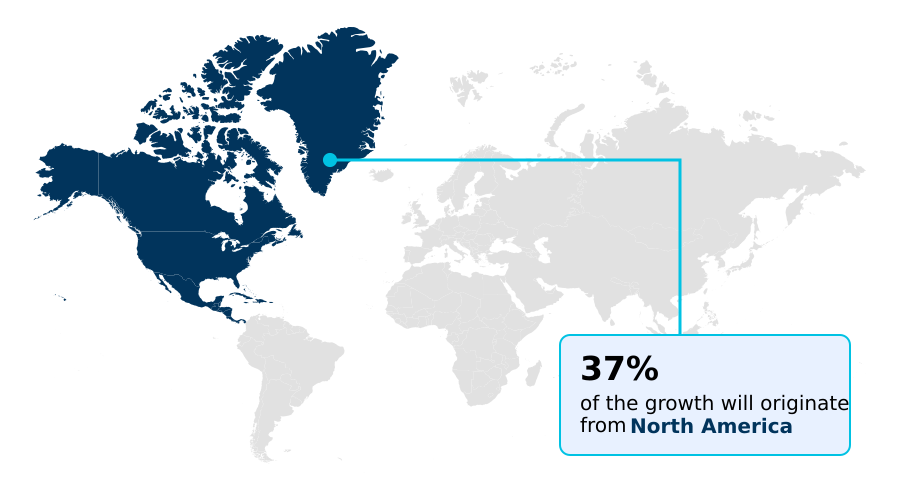
  • North America dominated the market and accounted for a 37.4% growth during the forecast period.
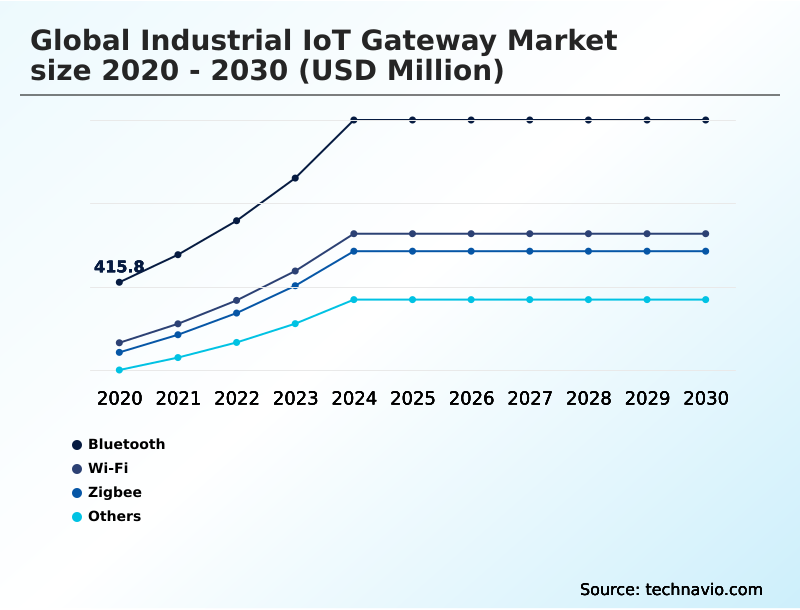
  • By Connectivity - Bluetooth segment was valued at USD 772 million in 2024
  • By End-user - Process industries segment accounted for the largest market revenue share in 2024

Market Size & Forecast

  • Market Opportunities: USD 7.22 billion
  • Market Future Opportunities: USD 5.83 billion
  • CAGR from 2025 to 2030 : 26.7%

Market Summary

  • The industrial iot gateway market is at the core of the industry 4.0 revolution, acting as the critical bridge between operational technology (OT) on the factory floor and enterprise IT systems. The primary driver is the push for data-driven decision-making, where gateways enable predictive maintenance analytics by collecting and processing data from legacy and modern machinery.
  • A key trend is the shift towards edge computing, where gateways with edge computing capabilities perform local analysis, reducing latency and bandwidth costs. For instance, in a smart manufacturing facility, a gateway can analyze vibration data from a machine in real-time, triggering an alert for potential failure before it disrupts the production line, thereby preventing costly downtime.
  • This IT-OT convergence is essential for creating cyber-physical systems that are both intelligent and resilient. However, the market faces challenges related to cybersecurity threats, as these connected devices become potential entry points for attackers. Integrating embedded security modules and ensuring robust protocol conversion from standards like Modbus integration to MQTT communication are paramount for secure and efficient operations.
  • Gateways are instrumental in achieving this integration.

What will be the Size of the Industrial Iot Gateway Market during the forecast period?

Get Key Insights on Market Forecast (PDF) Request Free Sample

How is the Industrial Iot Gateway Market Segmented?

The industrial iot gateway industry research report provides comprehensive data (region-wise segment analysis), with forecasts and estimates in "USD million" for the period 2026-2030, as well as historical data from 2020-2024 for the following segments.

  • Connectivity
    • Bluetooth
    • Wi-Fi
    • Zigbee
    • Others
  • End-user
    • Process industries
    • Discrete industries
  • Component
    • Hardware
    • Software
  • Geography
    • North America
      • US
      • Canada
      • Mexico
    • APAC
      • China
      • India
      • Japan
    • Europe
      • Germany
      • UK
      • France
    • South America
      • Brazil
      • Argentina
    • Middle East and Africa
      • Saudi Arabia
      • UAE
      • South Africa
    • Rest of World (ROW)

By Connectivity Insights

The bluetooth segment is estimated to witness significant growth during the forecast period.

The bluetooth segment is transforming within the global industrial iot gateway market 2026-2030, moving beyond simple connections to support dense sensor networks. The adoption of mesh networking has been pivotal, enabling low-power communication for battery-operated assets.

This technology, now accounting for nearly 24% of the wireless industrial landscape, is driven by condition-monitoring applications. Gateways with low-latency processing leverage Bluetooth for high-accuracy distance measurement, facilitating real-time locating systems.

Its integration with mobile devices for on-site diagnostics supports localized machine-to-machine communication and remote asset monitoring.

Software-defined edge solutions with multi-protocol support are crucial, while LoRaWAN deployment complements Bluetooth for wide-area coverage, enabling a flexible edge-to-cloud architecture for diverse industrial data acquisition.

Request Free Sample

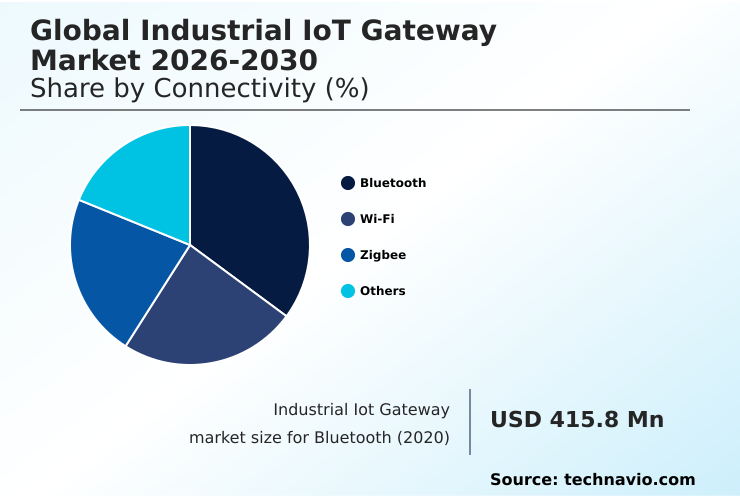
The Bluetooth segment was valued at USD 772 million in 2024 and showed a gradual increase during the forecast period.

Request Free Sample

Regional Analysis

North America is estimated to contribute 37.4% to the growth of the global market during the forecast period.Technavio’s analysts have elaborately explained the regional trends and drivers that shape the market during the forecast period.

See How Industrial Iot Gateway Market Demand is Rising in North America Request Free Sample

North America is a major contributor to the global industrial iot gateway market 2026-2030, accounting for 37.4% of the incremental growth, driven by advanced manufacturing and a focus on data sovereignty compliance.

The region's emphasis on IT-OT convergence and deploying AI-enabled edge nodes facilitates real-time operational adjustments. In APAC, rapid industrialization is fueling demand for gateways that enable smart grid communication and wireless sensor grids.

European firms prioritize gateways with Profinet connectivity and robust hardware-based zero-trust security to meet stringent regulatory standards, with some achieving a 15% improvement in energy efficiency through optimized monitoring.

South America leverages gateways for low-power wide-area networking in remote mining and agricultural applications. This geographic diversity underscores the gateway's role as a versatile tool for decentralized data processing and enabling industrial edge intelligence globally.

Market Dynamics

Our researchers analyzed the data with 2025 as the base year, along with the key drivers, trends, and challenges. A holistic analysis of drivers will help companies refine their marketing strategies to gain a competitive advantage.

  • Understanding the global industrial iot gateway market 2026-2030 requires clarity on specific use cases and technical differentiators. A primary application is the industrial iot gateway for predictive maintenance, which allows manufacturers to monitor asset health in real time, reducing unplanned downtime by more than 30% compared to traditional reactive methods.
  • For those new to the field asking what is an industrial iot gateway, it is essentially a smart device that translates data between industrial equipment and IT networks. In the context of the industrial iot gateway for smart manufacturing, these devices orchestrate data flow from sensors and PLCs to analytics platforms, enabling agile production.
  • Security is paramount; implementing secure remote access for industrial equipment through gateways protects critical assets from cyber threats. A key technical consideration involves comparing modbus vs opc ua gateways, as the choice of protocol impacts interoperability and data context.
  • Modbus remains prevalent in legacy systems, while OPC UA offers a more secure, information-rich framework suitable for modern IT-centric architectures, providing a more robust foundation for digital transformation.

What are the key market drivers leading to the rise in the adoption of Industrial Iot Gateway Industry?

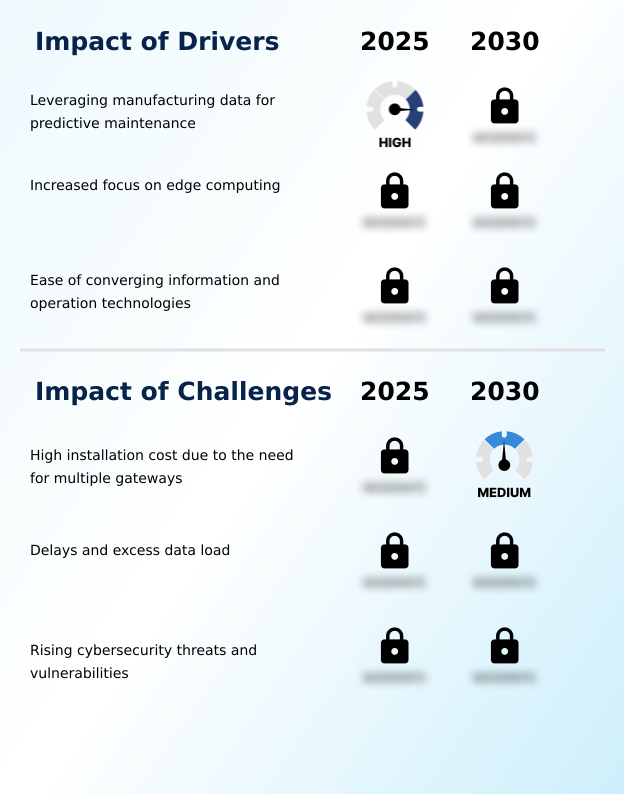
  • The increasing ability of industries to leverage manufacturing data for predictive maintenance is a primary driver for market growth.

  • The convergence of information technology (IT) and operational technology (OT) is a primary driver for the global industrial iot gateway market 2026-2030. Gateways act as the essential bridge, enabling legacy machinery integration and facilitating unified monitoring.
  • This seamless protocol conversion can reduce digital transformation costs significantly. Another key driver is the focus on edge computing, which minimizes latency and bandwidth costs by processing data locally.
  • This approach has been shown to improve equipment lifespan and reduce unplanned downtime by processing AI-driven analytics at the edge.
  • Deploying gateways with 5G backhaul and digital twin data source capabilities has improved production efficiency by over 20% in certain automotive plants. The ability of gateways with serial-to-cellular gateways and cyber-physical systems to enable real-time asset monitoring is also critical.

What are the market trends shaping the Industrial Iot Gateway Industry?

  • The market is witnessing a significant shift toward the provision of comprehensive end-to-end services. This trend reflects a growing demand for integrated solutions that span from device connectivity to data analytics.

  • A defining trend in the global industrial iot gateway market 2026-2030 is the move towards customization and end-to-end service delivery. Industrial users now demand tailored solutions with flexible processing power and modular interfaces for ruggedized embedded systems.
  • The accelerated adoption of industrial network resilience architectures has intensified this need, with organizations requiring gateways that can run specialized algorithms and handle unique machine learning tasks. This has improved forecast accuracy by over 18% in some logistics operations.
  • Furthermore, the growing use of gateways in smart grids, which require unified device management, has become a strong driver, with some utilities reporting up to a 35% improvement in energy distribution efficiency. The integration of OPC UA interoperability, predictive maintenance analytics, and data aggregation functionalities within a single platform is becoming standard.

What challenges does the Industrial Iot Gateway Industry face during its growth?

  • The high installation cost associated with deploying multiple gateways across complex industrial environments remains a significant market challenge.

  • Rising cybersecurity threats present a significant challenge for the global industrial iot gateway market 2026-2030, as gateways are prime targets for attacks. A compromised device can disrupt industrial continuity, with downtime costs escalating rapidly. The need for constant vigilance, embedded security modules, and strong authentication is paramount for operational technology security.
  • Another challenge is the high installation cost, particularly the need for multiple gateways in complex environments, which can slow adoption for small and medium enterprises. Furthermore, delays from excess data load can affect real-time operations, with some systems experiencing latency increases of up to 15% during peak loads.
  • Effectively managing MQTT communication and data aggregation through smart factory communication hub and secure industrial networking architectures is crucial to mitigate these issues and ensure the reliability of autonomous operations connectivity.

Exclusive Technavio Analysis on Customer Landscape

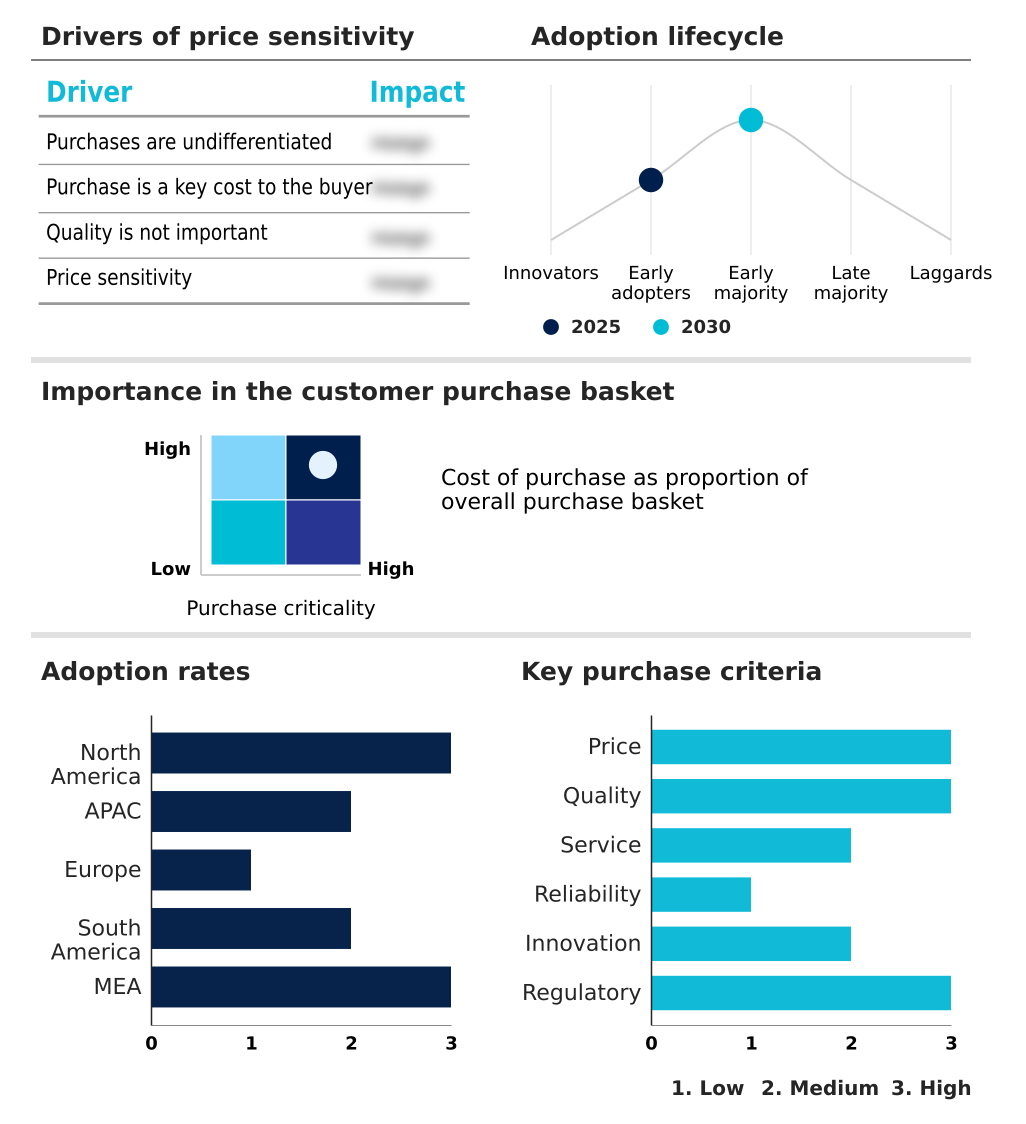
The industrial iot gateway market forecasting report includes the adoption lifecycle of the market, covering from the innovator’s stage to the laggard’s stage. It focuses on adoption rates in different regions based on penetration. Furthermore, the industrial iot gateway market report also includes key purchase criteria and drivers of price sensitivity to help companies evaluate and develop their market growth analysis strategies.

Customer Landscape of Industrial Iot Gateway Industry

Competitive Landscape

Companies are implementing various strategies, such as strategic alliances, industrial iot gateway market forecast, partnerships, mergers and acquisitions, geographical expansion, and product/service launches, to enhance their presence in the industry.

ADLINK Technology Inc. - Delivers integrated industrial gateway solutions that converge automation and IT, enabling real-time edge data processing and secure connectivity for enhanced operational intelligence.

The industry research and growth report includes detailed analyses of the competitive landscape of the market and information about key companies, including:

  • ADLINK Technology Inc.
  • Advantech Co. Ltd.
  • Alten SA
  • ASUSTeK Computer Inc.
  • Cisco Systems Inc.
  • Dell Technologies Inc.
  • EUROTECH Spa
  • Hewlett Packard Entp Co.
  • Huawei Technologies Co. Ltd.
  • Intel Corp.
  • Intuz Inc.
  • iWave Systems Technologies
  • NEXCOM International Co. Ltd.
  • NXP Semiconductors NV
  • PHYTEC Messtechnik GmbH
  • Semtech Corp.
  • Siemens AG
  • Super Micro Computer Inc.
  • TE Connectivity plc
  • Texas Instruments Inc.

Qualitative and quantitative analysis of companies has been conducted to help clients understand the wider business environment as well as the strengths and weaknesses of key industry players. Data is qualitatively analyzed to categorize companies as pure play, category-focused, industry-focused, and diversified; it is quantitatively analyzed to categorize companies as dominant, leading, strong, tentative, and weak.

Recent Development and News in Industrial iot gateway market

  • In February 2025, Honeywell and Cisco Systems announced a strategic collaboration to integrate the Honeywell Forge industrial platform with Cisco IoT gateways, enhancing data processing and advanced analytics for industrial clients.
  • In March 2025, Aramco Digital unveiled the Dane AiR DC, an autonomous scanning solution designed for complex industrial environments including manufacturers and distribution centers.
  • In August 2025, Vale S.A. expanded its private LTE and 5G networks to support autonomous operations at its Northern System mining operations in Para, Brazil.
  • In September 2025, the Dubai Electricity and Water Authority (DEWA) completed the integration of its smart meter network, comprising over 2.1 million electricity and water meters across Dubai.

Dive into Technavio’s robust research methodology, blending expert interviews, extensive data synthesis, and validated models for unparalleled Industrial Iot Gateway Market insights. See full methodology.

Market Scope
Page number 301
Base year 2025
Historic period 2020-2024
Forecast period 2026-2030
Growth momentum & CAGR Accelerate at a CAGR of 26.7%
Market growth 2026-2030 USD 5831.5 million
Market structure Fragmented
YoY growth 2025-2026(%) 21.1%
Key countries US, Canada, Mexico, China, India, Japan, South Korea, Australia, Indonesia, Germany, UK, France, Italy, Spain, The Netherlands, Brazil, Argentina, Chile, Saudi Arabia, UAE, South Africa, Israel and Turkey
Competitive landscape Leading Companies, Market Positioning of Companies, Competitive Strategies, and Industry Risks

Request Free Sample

Research Analyst Overview

  • The industrial iot gateway market is advancing through the fusion of powerful edge computing capabilities and sophisticated connectivity. These gateways are no longer simple data forwarders but have become AI-enabled edge nodes essential for IT-OT convergence. They provide crucial protocol conversion and industrial protocol translation, supporting MQTT communication, OPC UA interoperability, Modbus integration, and Profinet connectivity.
  • The adoption of ruggedized hardware with embedded security modules and hardware-based zero-trust security is critical as they become central to cyber-physical systems. A key boardroom consideration is the investment in software-defined edge solutions that allow for containerized application deployment, offering agility and future-proofing infrastructure.
  • These gateways facilitate real-time data transmission for predictive maintenance analytics, with some firms reporting a 20% reduction in maintenance costs. As the backbone for data aggregation, gateways are also enabling data sovereignty compliance and supporting advanced connectivity like 5G backhaul, LoRaWAN deployment, and serial-to-cellular gateways, ensuring multi-protocol support across the enterprise.

What are the Key Data Covered in this Industrial Iot Gateway Market Research and Growth Report?

  • What is the expected growth of the Industrial Iot Gateway Market between 2026 and 2030?

    • USD 5.83 billion, at a CAGR of 26.7%

  • What segmentation does the market report cover?

    • The report is segmented by Connectivity (Bluetooth, Wi-Fi, Zigbee, and Others), End-user (Process industries, and Discrete industries), Component (Hardware, and Software) and Geography (North America, APAC, Europe, South America, Middle East and Africa)

  • Which regions are analyzed in the report?

    • North America, APAC, Europe, South America and Middle East and Africa

  • What are the key growth drivers and market challenges?

    • Leveraging manufacturing data for predictive maintenance, High installation cost due to the need for multiple gateways

  • Who are the major players in the Industrial Iot Gateway Market?

    • ADLINK Technology Inc., Advantech Co. Ltd., Alten SA, ASUSTeK Computer Inc., Cisco Systems Inc., Dell Technologies Inc., EUROTECH Spa, Hewlett Packard Entp Co., Huawei Technologies Co. Ltd., Intel Corp., Intuz Inc., iWave Systems Technologies, NEXCOM International Co. Ltd., NXP Semiconductors NV, PHYTEC Messtechnik GmbH, Semtech Corp., Siemens AG, Super Micro Computer Inc., TE Connectivity plc and Texas Instruments Inc.

Market Research Insights

  • The industrial IoT gateway market is defined by a strategic move toward decentralized intelligence, enhancing operational autonomy. Gateways featuring edge analytics capabilities now enable automated fault detection, improving uptime by over 25% in some discrete manufacturing settings. The integration of private 5G network integration with high-bandwidth gateways is reducing data transmission latency, a critical factor for autonomous operations connectivity.
  • Furthermore, a focus on operational technology security has led to a 40% rise in the adoption of gateways with hardened security. The market supports legacy machinery integration into a cohesive smart factory communication hub, ensuring that older assets contribute to modern data ecosystems and deliver a higher return on investment.

We can help! Our analysts can customize this industrial iot gateway market research report to meet your requirements.

Get in touch

1. Executive Summary

1.1 Market overview

Executive Summary - Chart on Market Overview
Executive Summary - Data Table on Market Overview
Executive Summary - Chart on Global Market Characteristics
Executive Summary - Chart on Market by Geography
Executive Summary - Chart on Market Segmentation by Connectivity
Executive Summary - Chart on Market Segmentation by End-user
Executive Summary - Chart on Market Segmentation by Component
Executive Summary - Chart on Incremental Growth
Executive Summary - Data Table on Incremental Growth
Executive Summary - Chart on Company Market Positioning

2. Technavio Analysis

2.1 Analysis of price sensitivity, lifecycle, customer purchase basket, adoption rates, and purchase criteria

2.2 Criticality of inputs and Factors of differentiation

Chart on Overview on criticality of inputs and factors of differentiation

2.3 Factors of disruption

Chart on Overview on factors of disruption

2.4 Impact of drivers and challenges

Chart on Impact of drivers and challenges in 2025 and 2030

3. Market Landscape

3.1 Market ecosystem

Chart on Parent Market
Data Table on - Parent Market

3.2 Market characteristics

Chart on Market characteristics analysis

3.3 Value chain analysis

Chart on Value chain analysis

4. Market Sizing

4.1 Market definition

Data Table on Offerings of companies included in the market definition

4.2 Market segment analysis

Market segments

4.3 Market size 2025

4.4 Market outlook: Forecast for 2025-2030

Chart on Global - Market size and forecast 2025-2030 ($ million)
Data Table on Global - Market size and forecast 2025-2030 ($ million)
Chart on Global Market: Year-over-year growth 2025-2030 (%)
Data Table on Global Market: Year-over-year growth 2025-2030 (%)

5. Historic Market Size

5.1 Global Industrial IoT Gateway Market 2020 - 2024

Historic Market Size - Data Table on Global Industrial IoT Gateway Market 2020 - 2024 ($ million)

5.2 Connectivity segment analysis 2020 - 2024

Historic Market Size - Connectivity Segment 2020 - 2024 ($ million)

5.3 End-user segment analysis 2020 - 2024

Historic Market Size - End-user Segment 2020 - 2024 ($ million)

5.4 Component segment analysis 2020 - 2024

Historic Market Size - Component Segment 2020 - 2024 ($ million)

5.5 Geography segment analysis 2020 - 2024

Historic Market Size - Geography Segment 2020 - 2024 ($ million)

5.6 Country segment analysis 2020 - 2024

Historic Market Size - Country Segment 2020 - 2024 ($ million)

6. Qualitative Analysis

6.1 Impact of AI on the Global Industrial IoT Gateway Market

7. Five Forces Analysis

7.1 Five forces summary

Five forces analysis - Comparison between 2025 and 2030

7.2 Bargaining power of buyers

Bargaining power of buyers - Impact of key factors 2025 and 2030

7.3 Bargaining power of suppliers

Bargaining power of suppliers - Impact of key factors in 2025 and 2030

7.4 Threat of new entrants

Threat of new entrants - Impact of key factors in 2025 and 2030

7.5 Threat of substitutes

Threat of substitutes - Impact of key factors in 2025 and 2030

7.6 Threat of rivalry

Threat of rivalry - Impact of key factors in 2025 and 2030

7.7 Market condition

Chart on Market condition - Five forces 2025 and 2030

8. Market Segmentation by Connectivity

8.1 Market segments

Chart on Connectivity - Market share 2025-2030 (%)
Data Table on Connectivity - Market share 2025-2030 (%)

8.2 Comparison by Connectivity

Chart on Comparison by Connectivity
Data Table on Comparison by Connectivity

8.3 Bluetooth - Market size and forecast 2025-2030

Chart on Bluetooth - Market size and forecast 2025-2030 ($ million)
Data Table on Bluetooth - Market size and forecast 2025-2030 ($ million)
Chart on Bluetooth - Year-over-year growth 2025-2030 (%)
Data Table on Bluetooth - Year-over-year growth 2025-2030 (%)

8.4 Wi-Fi - Market size and forecast 2025-2030

Chart on Wi-Fi - Market size and forecast 2025-2030 ($ million)
Data Table on Wi-Fi - Market size and forecast 2025-2030 ($ million)
Chart on Wi-Fi - Year-over-year growth 2025-2030 (%)
Data Table on Wi-Fi - Year-over-year growth 2025-2030 (%)

8.5 Zigbee - Market size and forecast 2025-2030

Chart on Zigbee - Market size and forecast 2025-2030 ($ million)
Data Table on Zigbee - Market size and forecast 2025-2030 ($ million)
Chart on Zigbee - Year-over-year growth 2025-2030 (%)
Data Table on Zigbee - Year-over-year growth 2025-2030 (%)

8.6 Others - Market size and forecast 2025-2030

Chart on Others - Market size and forecast 2025-2030 ($ million)
Data Table on Others - Market size and forecast 2025-2030 ($ million)
Chart on Others - Year-over-year growth 2025-2030 (%)
Data Table on Others - Year-over-year growth 2025-2030 (%)

8.7 Market opportunity by Connectivity

Market opportunity by Connectivity ($ million)
Data Table on Market opportunity by Connectivity ($ million)

9. Market Segmentation by End-user

9.1 Market segments

Chart on End-user - Market share 2025-2030 (%)
Data Table on End-user - Market share 2025-2030 (%)

9.2 Comparison by End-user

Chart on Comparison by End-user
Data Table on Comparison by End-user

9.3 Process industries - Market size and forecast 2025-2030

Chart on Process industries - Market size and forecast 2025-2030 ($ million)
Data Table on Process industries - Market size and forecast 2025-2030 ($ million)
Chart on Process industries - Year-over-year growth 2025-2030 (%)
Data Table on Process industries - Year-over-year growth 2025-2030 (%)

9.4 Discrete industries - Market size and forecast 2025-2030

Chart on Discrete industries - Market size and forecast 2025-2030 ($ million)
Data Table on Discrete industries - Market size and forecast 2025-2030 ($ million)
Chart on Discrete industries - Year-over-year growth 2025-2030 (%)
Data Table on Discrete industries - Year-over-year growth 2025-2030 (%)

9.5 Market opportunity by End-user

Market opportunity by End-user ($ million)
Data Table on Market opportunity by End-user ($ million)

10. Market Segmentation by Component

10.1 Market segments

Chart on Component - Market share 2025-2030 (%)
Data Table on Component - Market share 2025-2030 (%)

10.2 Comparison by Component

Chart on Comparison by Component
Data Table on Comparison by Component

10.3 Hardware - Market size and forecast 2025-2030

Chart on Hardware - Market size and forecast 2025-2030 ($ million)
Data Table on Hardware - Market size and forecast 2025-2030 ($ million)
Chart on Hardware - Year-over-year growth 2025-2030 (%)
Data Table on Hardware - Year-over-year growth 2025-2030 (%)

10.4 Software - Market size and forecast 2025-2030

Chart on Software - Market size and forecast 2025-2030 ($ million)
Data Table on Software - Market size and forecast 2025-2030 ($ million)
Chart on Software - Year-over-year growth 2025-2030 (%)
Data Table on Software - Year-over-year growth 2025-2030 (%)

10.5 Market opportunity by Component

Market opportunity by Component ($ million)
Data Table on Market opportunity by Component ($ million)

11. Customer Landscape

11.1 Customer landscape overview

Analysis of price sensitivity, lifecycle, customer purchase basket, adoption rates, and purchase criteria

12. Geographic Landscape

12.1 Geographic segmentation

Chart on Market share by geography 2025-2030 (%)
Data Table on Market share by geography 2025-2030 (%)

12.2 Geographic comparison

Chart on Geographic comparison
Data Table on Geographic comparison

12.3 North America - Market size and forecast 2025-2030

Chart on North America - Market size and forecast 2025-2030 ($ million)
Data Table on North America - Market size and forecast 2025-2030 ($ million)
Chart on North America - Year-over-year growth 2025-2030 (%)
Data Table on North America - Year-over-year growth 2025-2030 (%)
Chart on Regional Comparison - North America
Data Table on Regional Comparison - North America

12.3.1 US - Market size and forecast 2025-2030

Chart on US - Market size and forecast 2025-2030 ($ million)
Data Table on US - Market size and forecast 2025-2030 ($ million)
Chart on US - Year-over-year growth 2025-2030 (%)
Data Table on US - Year-over-year growth 2025-2030 (%)

12.3.2 Canada - Market size and forecast 2025-2030

Chart on Canada - Market size and forecast 2025-2030 ($ million)
Data Table on Canada - Market size and forecast 2025-2030 ($ million)
Chart on Canada - Year-over-year growth 2025-2030 (%)
Data Table on Canada - Year-over-year growth 2025-2030 (%)

12.3.3 Mexico - Market size and forecast 2025-2030

Chart on Mexico - Market size and forecast 2025-2030 ($ million)
Data Table on Mexico - Market size and forecast 2025-2030 ($ million)
Chart on Mexico - Year-over-year growth 2025-2030 (%)
Data Table on Mexico - Year-over-year growth 2025-2030 (%)

12.4 APAC - Market size and forecast 2025-2030

Chart on APAC - Market size and forecast 2025-2030 ($ million)
Data Table on APAC - Market size and forecast 2025-2030 ($ million)
Chart on APAC - Year-over-year growth 2025-2030 (%)
Data Table on APAC - Year-over-year growth 2025-2030 (%)
Chart on Regional Comparison - APAC
Data Table on Regional Comparison - APAC

12.4.1 China - Market size and forecast 2025-2030

Chart on China - Market size and forecast 2025-2030 ($ million)
Data Table on China - Market size and forecast 2025-2030 ($ million)
Chart on China - Year-over-year growth 2025-2030 (%)
Data Table on China - Year-over-year growth 2025-2030 (%)

12.4.2 India - Market size and forecast 2025-2030

Chart on India - Market size and forecast 2025-2030 ($ million)
Data Table on India - Market size and forecast 2025-2030 ($ million)
Chart on India - Year-over-year growth 2025-2030 (%)
Data Table on India - Year-over-year growth 2025-2030 (%)

12.4.3 Japan - Market size and forecast 2025-2030

Chart on Japan - Market size and forecast 2025-2030 ($ million)
Data Table on Japan - Market size and forecast 2025-2030 ($ million)
Chart on Japan - Year-over-year growth 2025-2030 (%)
Data Table on Japan - Year-over-year growth 2025-2030 (%)

12.4.4 South Korea - Market size and forecast 2025-2030

Chart on South Korea - Market size and forecast 2025-2030 ($ million)
Data Table on South Korea - Market size and forecast 2025-2030 ($ million)
Chart on South Korea - Year-over-year growth 2025-2030 (%)
Data Table on South Korea - Year-over-year growth 2025-2030 (%)

12.4.5 Australia - Market size and forecast 2025-2030

Chart on Australia - Market size and forecast 2025-2030 ($ million)
Data Table on Australia - Market size and forecast 2025-2030 ($ million)
Chart on Australia - Year-over-year growth 2025-2030 (%)
Data Table on Australia - Year-over-year growth 2025-2030 (%)

12.4.6 Indonesia - Market size and forecast 2025-2030

Chart on Indonesia - Market size and forecast 2025-2030 ($ million)
Data Table on Indonesia - Market size and forecast 2025-2030 ($ million)
Chart on Indonesia - Year-over-year growth 2025-2030 (%)
Data Table on Indonesia - Year-over-year growth 2025-2030 (%)

12.5 Europe - Market size and forecast 2025-2030

Chart on Europe - Market size and forecast 2025-2030 ($ million)
Data Table on Europe - Market size and forecast 2025-2030 ($ million)
Chart on Europe - Year-over-year growth 2025-2030 (%)
Data Table on Europe - Year-over-year growth 2025-2030 (%)
Chart on Regional Comparison - Europe
Data Table on Regional Comparison - Europe

12.5.1 Germany - Market size and forecast 2025-2030

Chart on Germany - Market size and forecast 2025-2030 ($ million)
Data Table on Germany - Market size and forecast 2025-2030 ($ million)
Chart on Germany - Year-over-year growth 2025-2030 (%)
Data Table on Germany - Year-over-year growth 2025-2030 (%)

12.5.2 UK - Market size and forecast 2025-2030

Chart on UK - Market size and forecast 2025-2030 ($ million)
Data Table on UK - Market size and forecast 2025-2030 ($ million)
Chart on UK - Year-over-year growth 2025-2030 (%)
Data Table on UK - Year-over-year growth 2025-2030 (%)

12.5.3 France - Market size and forecast 2025-2030

Chart on France - Market size and forecast 2025-2030 ($ million)
Data Table on France - Market size and forecast 2025-2030 ($ million)
Chart on France - Year-over-year growth 2025-2030 (%)
Data Table on France - Year-over-year growth 2025-2030 (%)

12.5.4 Italy - Market size and forecast 2025-2030

Chart on Italy - Market size and forecast 2025-2030 ($ million)
Data Table on Italy - Market size and forecast 2025-2030 ($ million)
Chart on Italy - Year-over-year growth 2025-2030 (%)
Data Table on Italy - Year-over-year growth 2025-2030 (%)

12.5.5 Spain - Market size and forecast 2025-2030

Chart on Spain - Market size and forecast 2025-2030 ($ million)
Data Table on Spain - Market size and forecast 2025-2030 ($ million)
Chart on Spain - Year-over-year growth 2025-2030 (%)
Data Table on Spain - Year-over-year growth 2025-2030 (%)

12.5.6 The Netherlands - Market size and forecast 2025-2030

Chart on The Netherlands - Market size and forecast 2025-2030 ($ million)
Data Table on The Netherlands - Market size and forecast 2025-2030 ($ million)
Chart on The Netherlands - Year-over-year growth 2025-2030 (%)
Data Table on The Netherlands - Year-over-year growth 2025-2030 (%)

12.6 South America - Market size and forecast 2025-2030

Chart on South America - Market size and forecast 2025-2030 ($ million)
Data Table on South America - Market size and forecast 2025-2030 ($ million)
Chart on South America - Year-over-year growth 2025-2030 (%)
Data Table on South America - Year-over-year growth 2025-2030 (%)
Chart on Regional Comparison - South America
Data Table on Regional Comparison - South America

12.6.1 Brazil - Market size and forecast 2025-2030

Chart on Brazil - Market size and forecast 2025-2030 ($ million)
Data Table on Brazil - Market size and forecast 2025-2030 ($ million)
Chart on Brazil - Year-over-year growth 2025-2030 (%)
Data Table on Brazil - Year-over-year growth 2025-2030 (%)

12.6.2 Argentina - Market size and forecast 2025-2030

Chart on Argentina - Market size and forecast 2025-2030 ($ million)
Data Table on Argentina - Market size and forecast 2025-2030 ($ million)
Chart on Argentina - Year-over-year growth 2025-2030 (%)
Data Table on Argentina - Year-over-year growth 2025-2030 (%)

12.6.3 Chile - Market size and forecast 2025-2030

Chart on Chile - Market size and forecast 2025-2030 ($ million)
Data Table on Chile - Market size and forecast 2025-2030 ($ million)
Chart on Chile - Year-over-year growth 2025-2030 (%)
Data Table on Chile - Year-over-year growth 2025-2030 (%)

12.7 Middle East and Africa - Market size and forecast 2025-2030

Chart on Middle East and Africa - Market size and forecast 2025-2030 ($ million)
Data Table on Middle East and Africa - Market size and forecast 2025-2030 ($ million)
Chart on Middle East and Africa - Year-over-year growth 2025-2030 (%)
Data Table on Middle East and Africa - Year-over-year growth 2025-2030 (%)
Chart on Regional Comparison - Middle East and Africa
Data Table on Regional Comparison - Middle East and Africa

12.7.1 Saudi Arabia - Market size and forecast 2025-2030

Chart on Saudi Arabia - Market size and forecast 2025-2030 ($ million)
Data Table on Saudi Arabia - Market size and forecast 2025-2030 ($ million)
Chart on Saudi Arabia - Year-over-year growth 2025-2030 (%)
Data Table on Saudi Arabia - Year-over-year growth 2025-2030 (%)

12.7.2 UAE - Market size and forecast 2025-2030

Chart on UAE - Market size and forecast 2025-2030 ($ million)
Data Table on UAE - Market size and forecast 2025-2030 ($ million)
Chart on UAE - Year-over-year growth 2025-2030 (%)
Data Table on UAE - Year-over-year growth 2025-2030 (%)

12.7.3 South Africa - Market size and forecast 2025-2030

Chart on South Africa - Market size and forecast 2025-2030 ($ million)
Data Table on South Africa - Market size and forecast 2025-2030 ($ million)
Chart on South Africa - Year-over-year growth 2025-2030 (%)
Data Table on South Africa - Year-over-year growth 2025-2030 (%)

12.7.4 Israel - Market size and forecast 2025-2030

Chart on Israel - Market size and forecast 2025-2030 ($ million)
Data Table on Israel - Market size and forecast 2025-2030 ($ million)
Chart on Israel - Year-over-year growth 2025-2030 (%)
Data Table on Israel - Year-over-year growth 2025-2030 (%)

12.7.5 Turkey - Market size and forecast 2025-2030

Chart on Turkey - Market size and forecast 2025-2030 ($ million)
Data Table on Turkey - Market size and forecast 2025-2030 ($ million)
Chart on Turkey - Year-over-year growth 2025-2030 (%)
Data Table on Turkey - Year-over-year growth 2025-2030 (%)

12.8 Market opportunity by geography

Market opportunity by geography ($ million)
Data Tables on Market opportunity by geography ($ million)

13. Drivers, Challenges, and Opportunity

13.1 Market drivers

Leveraging manufacturing data for predictive maintenance
Increased focus on edge computing
Ease of converging information and operation technologies

13.2 Market challenges

High installation cost due to the need for multiple gateways
Delays and excess data load
Rising cybersecurity threats and vulnerabilities

13.3 Impact of drivers and challenges

Impact of drivers and challenges in 2025 and 2030

13.4 Market opportunities

Increasing focus on providing end-to-end service
Increasing need for customized IoT gateways
Growing use of gateways in smart grids

14. Competitive Landscape

14.1 Overview

14.2

Overview on criticality of inputs and factors of differentiation

14.3 Landscape disruption

Overview on factors of disruption

14.4 Industry risks

Impact of key risks on business

15. Competitive Analysis

15.1 Companies profiled

Companies covered

15.2 Company ranking index

15.3 Market positioning of companies

Matrix on companies position and classification

15.4 ADLINK Technology Inc.

ADLINK Technology Inc. - Overview
ADLINK Technology Inc. - Business segments
ADLINK Technology Inc. - Key offerings
ADLINK Technology Inc. - Segment focus
SWOT

15.5 Advantech Co. Ltd.

Advantech Co. Ltd. - Overview
Advantech Co. Ltd. - Business segments
Advantech Co. Ltd. - Key news
Advantech Co. Ltd. - Key offerings
Advantech Co. Ltd. - Segment focus
SWOT

15.6 ASUSTeK Computer Inc.

ASUSTeK Computer Inc. - Overview
ASUSTeK Computer Inc. - Business segments
ASUSTeK Computer Inc. - Key news
ASUSTeK Computer Inc. - Key offerings
ASUSTeK Computer Inc. - Segment focus
SWOT

15.7 Cisco Systems Inc.

Cisco Systems Inc. - Overview
Cisco Systems Inc. - Business segments
Cisco Systems Inc. - Key news
Cisco Systems Inc. - Key offerings
Cisco Systems Inc. - Segment focus
SWOT

15.8 Dell Technologies Inc.

Dell Technologies Inc. - Overview
Dell Technologies Inc. - Business segments
Dell Technologies Inc. - Key news
Dell Technologies Inc. - Key offerings
Dell Technologies Inc. - Segment focus
SWOT

15.9 Hewlett Packard Entp Co.

Hewlett Packard Entp Co. - Overview
Hewlett Packard Entp Co. - Business segments
Hewlett Packard Entp Co. - Key news
Hewlett Packard Entp Co. - Key offerings
Hewlett Packard Entp Co. - Segment focus
SWOT

15.10 Huawei Technologies Co. Ltd.

Huawei Technologies Co. Ltd. - Overview
Huawei Technologies Co. Ltd. - Business segments
Huawei Technologies Co. Ltd. - Key news
Huawei Technologies Co. Ltd. - Key offerings
Huawei Technologies Co. Ltd. - Segment focus
SWOT

15.11 Intel Corp.

Intel Corp. - Overview
Intel Corp. - Business segments
Intel Corp. - Key news
Intel Corp. - Key offerings
Intel Corp. - Segment focus
SWOT

15.12 iWave Systems Technologies

iWave Systems Technologies - Overview
iWave Systems Technologies - Product / Service
iWave Systems Technologies - Key offerings
SWOT

15.13 NXP Semiconductors NV

NXP Semiconductors NV - Overview
NXP Semiconductors NV - Business segments
NXP Semiconductors NV - Key offerings
NXP Semiconductors NV - Segment focus
SWOT

15.14 PHYTEC Messtechnik GmbH

PHYTEC Messtechnik GmbH - Overview
PHYTEC Messtechnik GmbH - Product / Service
PHYTEC Messtechnik GmbH - Key offerings
SWOT

15.15 Semtech Corp.

Semtech Corp. - Overview
Semtech Corp. - Business segments
Semtech Corp. - Key news
Semtech Corp. - Key offerings
Semtech Corp. - Segment focus
SWOT

15.16 Siemens AG

Siemens AG - Overview
Siemens AG - Business segments
Siemens AG - Key news
Siemens AG - Key offerings
Siemens AG - Segment focus
SWOT

15.17 TE Connectivity plc

TE Connectivity plc - Overview
TE Connectivity plc - Business segments
TE Connectivity plc - Key news
TE Connectivity plc - Key offerings
TE Connectivity plc - Segment focus
SWOT

15.18 Texas Instruments Inc.

Texas Instruments Inc. - Overview
Texas Instruments Inc. - Business segments
Texas Instruments Inc. - Key offerings
Texas Instruments Inc. - Segment focus
SWOT

16. Appendix

16.1 Scope of the report

Market definition
Objectives
Notes and caveats

16.2 Inclusions and exclusions checklist

Inclusions checklist
Exclusions checklist

16.3 Currency conversion rates for US$

16.4 Research methodology

16.5 Data procurement

Information sources

16.6 Data validation

16.7 Validation techniques employed for market sizing

16.8 Data synthesis

16.9 360 degree market analysis

16.10 List of abbreviations

Research Methodology

Technavio presents a detailed picture of the market by way of study, synthesis, and summation of data from multiple sources. The analysts have presented the various facets of the market with a particular focus on identifying the key industry influencers. The data thus presented is comprehensive, reliable, and the result of extensive research, both primary and secondary.

INFORMATION SOURCES

Primary sources

  • Manufacturers and suppliers
  • Channel partners
  • Industry experts
  • Strategic decision makers

Secondary sources

  • Industry journals and periodicals
  • Government data
  • Financial reports of key industry players
  • Historical data
  • Press releases

DATA ANALYSIS

Data Synthesis

  • Collation of data
  • Estimation of key figures
  • Analysis of derived insights

Data Validation

  • Triangulation with data models
  • Reference against proprietary databases
  • Corroboration with industry experts

REPORT WRITING

Qualitative

  • Market drivers
  • Market challenges
  • Market trends
  • Five forces analysis

Quantitative

  • Market size and forecast
  • Market segmentation
  • Geographical insights
  • Competitive landscape

Interested in this report?

Get your sample now to see our research methodology and insights!

Download Now

Frequently Asked Questions

Industrial Iot Gateway market growth will increase by USD 5831.5 million during 2026-2030.

The Industrial Iot Gateway market is expected to grow at a CAGR of 26.7% during 2026-2030.

Industrial Iot Gateway market is segmented by Connectivity (Bluetooth, Wi-Fi, Zigbee, Others) End-user (Process industries, Discrete industries) Component (Hardware, Software)

ADLINK Technology Inc., Advantech Co. Ltd., Alten SA, ASUSTeK Computer Inc., Cisco Systems Inc., Dell Technologies Inc., EUROTECH Spa, Hewlett Packard Entp Co., Huawei Technologies Co. Ltd., Intel Corp., Intuz Inc., iWave Systems Technologies, NEXCOM International Co. Ltd., NXP Semiconductors NV, PHYTEC Messtechnik GmbH, Semtech Corp., Siemens AG, Super Micro Computer Inc., TE Connectivity plc, Texas Instruments Inc. are a few of the key vendors in the Industrial Iot Gateway market.

North America will register the highest growth rate of 37.4% among the other regions. Therefore, the Industrial Iot Gateway market in North America is expected to garner significant business opportunities for the vendors during the forecast period.

US, Canada, Mexico, China, India, Japan, South Korea, Australia, Indonesia, Germany, UK, France, Italy, Spain, The Netherlands, Brazil, Argentina, Chile, Saudi Arabia, UAE, South Africa, Israel, Turkey

  • Leveraging manufacturing data for predictive maintenance is the driving factor this market.

The Industrial Iot Gateway market vendors should focus on grabbing business opportunities from the Connectivity segment as it accounted for the largest market share in the base year.