Industrial Pc Market Analysis, Size, and Forecast 2026-2030: APAC (China, Japan, and India), Europe (Germany, UK, and Italy), North America (US, Canada, and Mexico), South America (Brazil and Argentina), Middle East and Africa (Saudi Arabia, UAE, and South Africa), and Rest of World (ROW)

Industrial Pc Market Analysis, Size, and Forecast 2026-2030:
APAC (China, Japan, and India), Europe (Germany, UK, and Italy), North America (US, Canada, and Mexico), South America (Brazil and Argentina), Middle East and Africa (Saudi Arabia, UAE, and South Africa), and Rest of World (ROW)

Published: Mar 2026 313 Pages SKU: IRTNTR45771

Market Overview at a Glance

$2.27 B
Market Opportunity
6.8%
CAGR 2025 - 2030
40.1%
APAC Growth
$1.59 B
Panel segment 2024

Industrial Pc Market Size 2026-2030

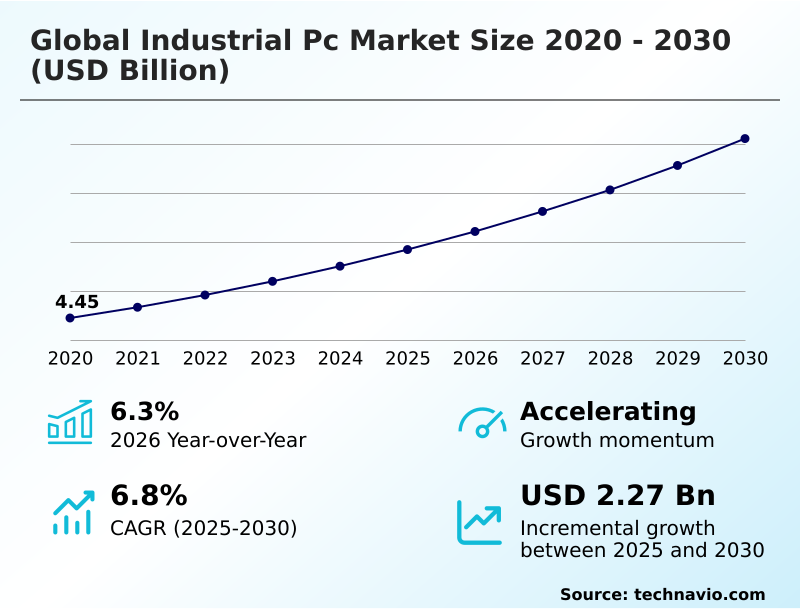
The industrial pc market size is valued to increase by USD 2.27 billion, at a CAGR of 6.8% from 2025 to 2030. Ascendancy of industry 4.0 and industrial internet of things frameworks will drive the industrial pc market.

Major Market Trends & Insights

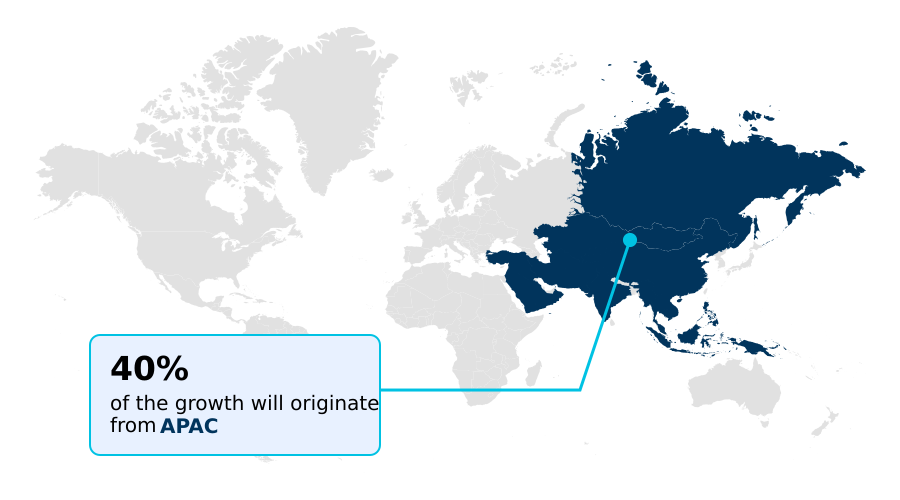
  • APAC dominated the market and accounted for a 40.1% growth during the forecast period.
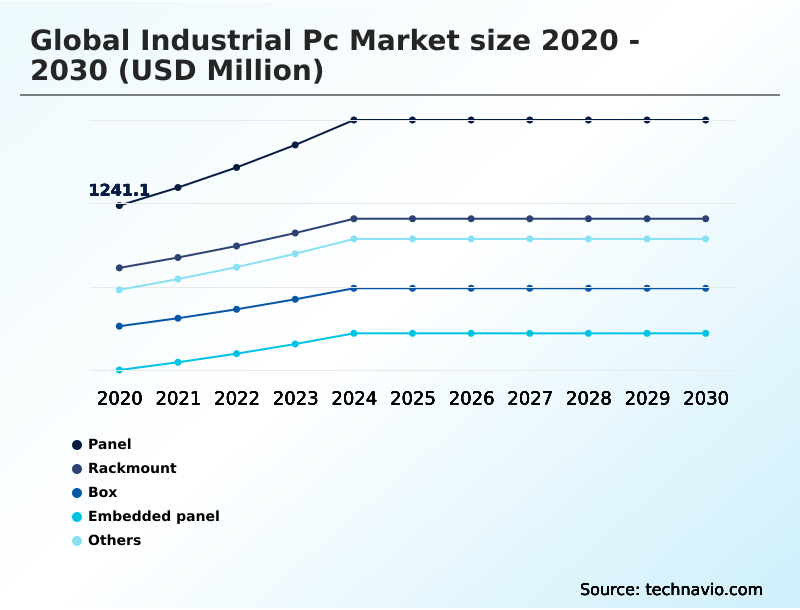
  • By Product Type - Panel segment was valued at USD 1.59 billion in 2024
  • By End-user - Industrial segment accounted for the largest market revenue share in 2024

Market Size & Forecast

  • Market Opportunities: USD 3.67 billion
  • Market Future Opportunities: USD 2.27 billion
  • CAGR from 2025 to 2030 : 6.8%

Market Summary

  • The industrial PC market is driven by the digital transformation of industrial sectors, where the need for robust, reliable computing at the operational edge is paramount. The adoption of Industry 4.0 and the Industrial Internet of Things (IIoT) necessitates rugged systems that serve as the nexus between operational technology and enterprise IT.
  • These devices are purpose-built with industrial-grade components to function as edge computing platforms, enabling real-time data processing for applications like predictive maintenance and automated quality control. In a typical smart factory scenario, an industrial PC analyzes sensor data from a production line to forecast potential equipment failures, allowing for preemptive repairs that prevent costly downtime.
  • This capability is crucial for maintaining operational continuity. However, this increased connectivity introduces significant cybersecurity vulnerabilities in converged IT/OT networks, while the high initial capital outlay for specialized hardware and the complexity of system integration remain significant market challenges that temper adoption rates, particularly among small and medium-sized enterprises.
  • The market's trajectory is toward more powerful, modular, and AI-ready industrial computers designed to overcome these hurdles.

What will be the Size of the Industrial Pc Market during the forecast period?

Get Key Insights on Market Forecast (PDF) Request Free Sample

How is the Industrial Pc Market Segmented?

The industrial pc industry research report provides comprehensive data (region-wise segment analysis), with forecasts and estimates in "USD million" for the period 2026-2030, as well as historical data from 2020-2024 for the following segments.

  • Product type
    • Panel
    • Rackmount
    • Box
    • Embedded panel
    • Others
  • End-user
    • Industrial
    • Transportation and traffic
    • Healthcare
    • Telecom and datacom
    • Others
  • Technology
    • Fanless industrial PC
    • Fan based industrial PC
  • Geography
    • APAC
      • China
      • Japan
      • India
    • Europe
      • Germany
      • UK
      • Italy
    • North America
      • US
      • Canada
      • Mexico
    • South America
      • Brazil
      • Argentina
    • Middle East and Africa
      • Saudi Arabia
      • UAE
      • South Africa
    • Rest of World (ROW)

By Product Type Insights

The panel segment is estimated to witness significant growth during the forecast period.

The industrial PC market is segmented by product type, end-user, and geography. The Panel segment, featuring all-in-one units with an integrated human-machine interface (HMI), is crucial for direct process control.

These systems prioritize mission-critical reliability and are built with industrial-grade components to endure harsh environments.

Key design features include fanless cooling systems and high ingress protection ratings, with some models achieving IP69K certification for high-pressure washdowns, a 15% increase in durability for sterile applications.

Demand is driven by the need for on-machine visualization and control in smart factories.

This segment's evolution reflects a broader shift toward deploying rugged embedded computers and intelligent decision-making engines directly at the point of activity, utilizing field-programmable gate arrays for specialized tasks and supporting operational technology (OT) networks.

Request Free Sample

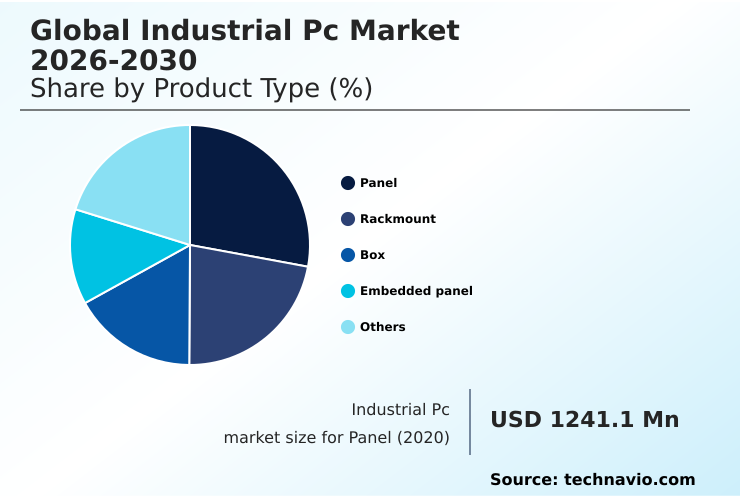
The Panel segment was valued at USD 1.59 billion in 2024 and showed a gradual increase during the forecast period.

Request Free Sample

Regional Analysis

APAC is estimated to contribute 40.1% to the growth of the global market during the forecast period.Technavio’s analysts have elaborately explained the regional trends and drivers that shape the market during the forecast period.

See How Industrial Pc Market Demand is Rising in APAC Request Free Sample

The global industrial PC market's geographic landscape is led by APAC, which accounts for over 40% of the incremental growth, driven by rapid industrialization in China and India. Europe follows, with Germany's Industry 4.0 initiatives fueling demand for advanced hardware.

North America represents a mature market focused on high-performance applications in aerospace and automotive sectors. In these regions, a key application is the deployment of time-sensitive networking to guarantee data delivery in robotics, improving synchronization by 20%.

The use of rackmount PCs as data acquisition hubs in centralized control rooms is standard. These systems utilize multi-core central processing units and support hardware-based encryption.

The demand for industrial server solutions and headless computing nodes is growing, particularly for supervisory control and data acquisition (SCADA) and on-premises data closets across all major regions.

Market Dynamics

Our researchers analyzed the data with 2025 as the base year, along with the key drivers, trends, and challenges. A holistic analysis of drivers will help companies refine their marketing strategies to gain a competitive advantage.

  • Strategic decisions in the industrial pc market increasingly involve detailed comparisons, such as fanless vs fan-based industrial pc performance for specific thermal environments. The total cost of ownership for industrial pc is a critical metric, balancing upfront investment against long-term reliability.
  • For specialized use cases, selecting a rugged panel pc for harsh washdown environments or a high-performance box ipc for edge ai computing is crucial. The choice often depends on specific needs, like using a din-rail pc as an industrial iot gateway or deploying a modular industrial pc for scalable automation.
  • The impact of 5g on in-vehicle computing is creating new demand for certified hardware, while industrial pc with time-sensitive networking support are essential for precision control. Cybersecurity for converged it and ot networks has become a top priority, influencing ipc lifecycle management for oem applications. Industrial pc requirements for machine vision are driving the adoption of more powerful processors.
  • Choosing an industrial pc for predictive maintenance involves evaluating real-time processing capabilities, which can show twice the predictive accuracy of legacy platforms. Integrating ipc with legacy plc systems remains a common engineering challenge, whereas en 50155 certified pc for railway applications meet strict regulatory demands.
  • The benefits of ipc in smart factory logistics are clear, as are the needs for high-performance rackmount industrial computers for scada. Furthermore, compact embedded computers for robotic control and industrial thin client deployment strategies address needs for miniaturization and streamlined operations.

What are the key market drivers leading to the rise in the adoption of Industrial Pc Industry?

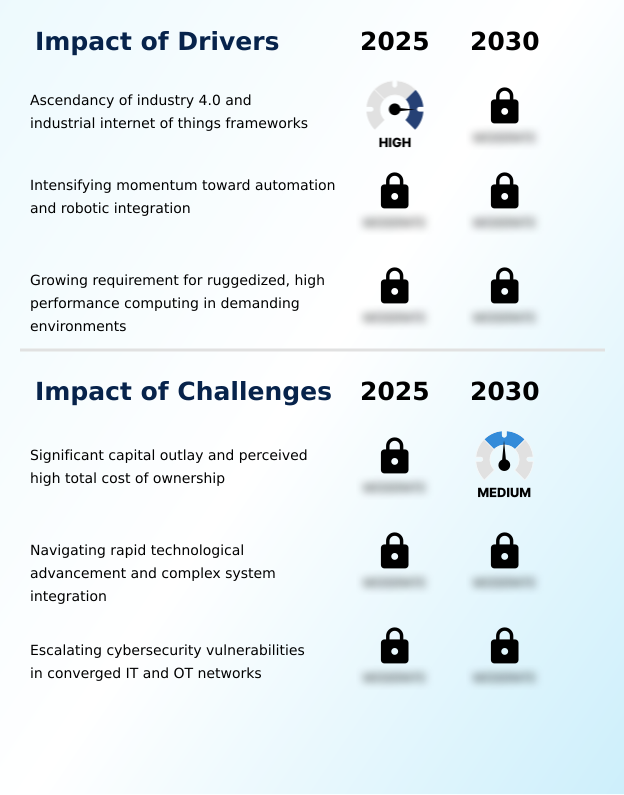
  • The ascendancy of Industry 4.0 and the Industrial Internet of Things (IIoT) frameworks serves as a primary and transformative driver for the global industrial PC market.

  • Market growth is fundamentally driven by the need for rugged computing in harsh environments, where systems with high ingress protection ratings increase operational uptime by 25%.
  • The expansion of Industry 4.0 and the Industrial Internet of Things (IIoT) accelerates the deployment of manufacturing execution systems (MES) and programmable logic controllers (PLCs), which rely on robust hardware.
  • The push toward automation and motion control for robotics requires real-time data processing capabilities, with modern systems improving production throughput by over 20%. This has intensified the demand for high-performance industrial PC that offer mission-critical reliability.
  • These platforms, acting as data acquisition hubs, are essential for connecting legacy machinery to modern networks, enabling applications like real-time quality inspection and enhancing overall operational technology security.

What are the market trends shaping the Industrial Pc Industry?

  • The convergence of edge computing architectures with onboard artificial intelligence acceleration is a defining trend. This evolution positions industrial PCs as intelligent decision-making engines at the operational periphery.

  • Key trends are reshaping the industrial PC market, led by the integration of AI-ready industrial computers that function as headless computing nodes for advanced analytics. The adoption of compact form factors and modular design philosophy allows for greater flexibility, reducing physical footprints by up to 40% in control cabinets.
  • Advanced connectivity protocols, including ultra-reliable low-latency communication via 5G, are becoming standard, enabling real-time wireless factory automation and reducing data transmission latency by over 50%. This shift supports data-intensive applications previously limited by wired connections. These intelligent decision-making engines, often built on computer-on-modules, are crucial for asset performance management and are increasingly deployed as industrial IoT gateway devices.
  • The move toward tactical 5G systems and sophisticated radio access network (RAN) management is also driving demand for more powerful and connected hardware.

What challenges does the Industrial Pc Industry face during its growth?

  • A key challenge affecting industry growth is the significant capital outlay and perceived high total cost of ownership associated with specialized industrial PC systems.

  • Significant challenges constrain market growth, primarily the high initial cost of certified industrial hardware, which can be a barrier for smaller enterprises. The system integration complexity involved in connecting new hardware with legacy equipment often leads to project delays and can cause budget overruns of up to 40%. This is compounded by the rapid pace of technology refresh cycles.
  • Furthermore, the convergence of IT and OT networks has amplified cybersecurity risks; without robust network segmentation strategy and operational technology security measures, system vulnerabilities can increase significantly. The need for specialized hardware such as ATEX-certified panels or systems with high thermal design power (TDP) for data-intensive applications adds another layer of cost and complexity, impacting the total cost of ownership.

Exclusive Technavio Analysis on Customer Landscape

The industrial pc market forecasting report includes the adoption lifecycle of the market, covering from the innovator’s stage to the laggard’s stage. It focuses on adoption rates in different regions based on penetration. Furthermore, the industrial pc market report also includes key purchase criteria and drivers of price sensitivity to help companies evaluate and develop their market growth analysis strategies.

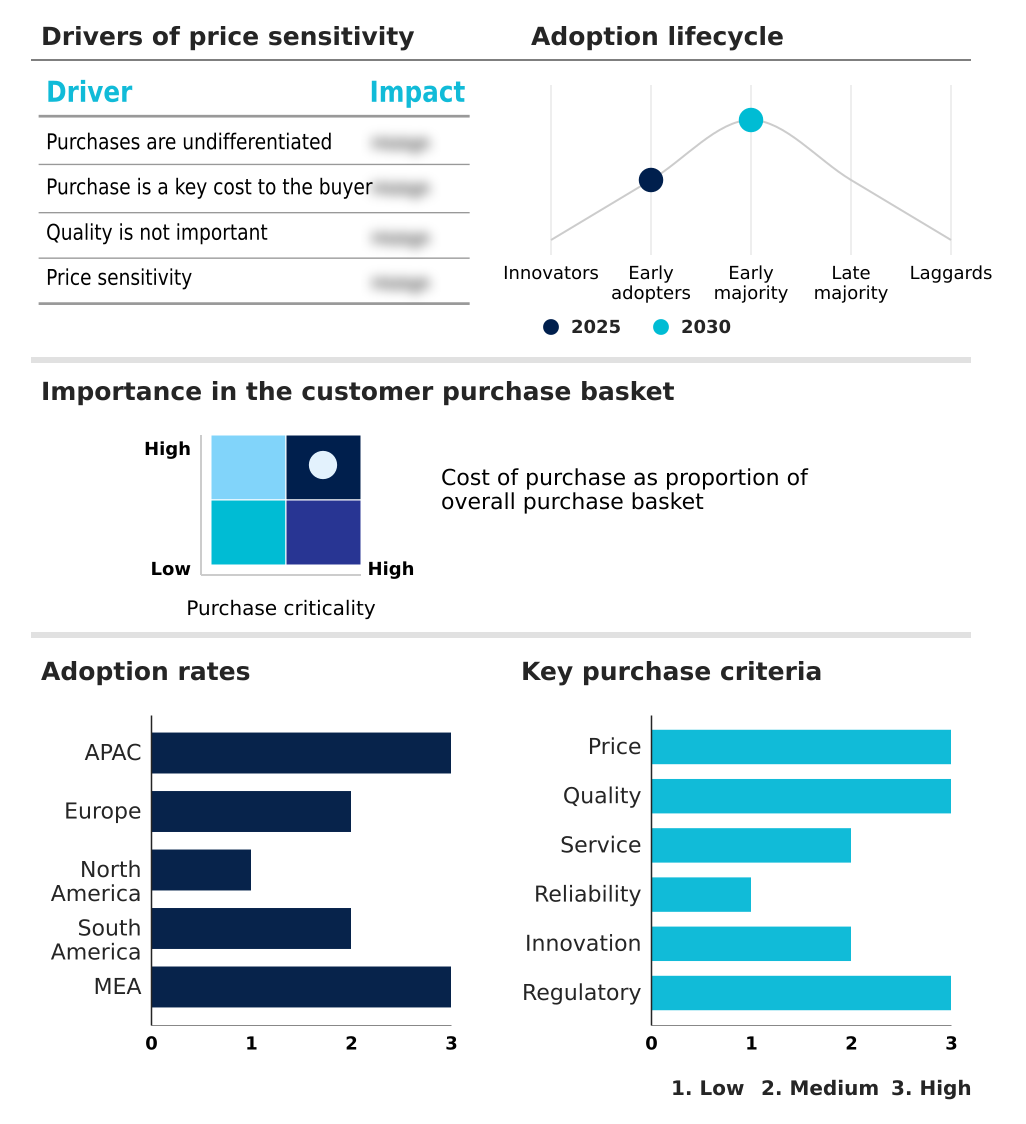
Customer Landscape of Industrial Pc Industry

Competitive Landscape

Companies are implementing various strategies, such as strategic alliances, industrial pc market forecast, partnerships, mergers and acquisitions, geographical expansion, and product/service launches, to enhance their presence in the industry.

ABB Ltd. - Offerings include ruggedized computing platforms engineered for mission-critical reliability, providing long-lifecycle support for demanding industrial automation and data-intensive applications.

The industry research and growth report includes detailed analyses of the competitive landscape of the market and information about key companies, including:

  • ABB Ltd.
  • ADLINK Technology Inc.
  • Advantech Co. Ltd.
  • American Portwell Technology
  • Avalue Technology Inc.
  • Axiomtek Co. Ltd.
  • Beckhoff Automation
  • Dell Technologies Inc.
  • IEI Integration Corp.
  • Keyence Corp.
  • Kontron AG
  • Mitsubishi Electric Corp.
  • NEXCOM International Co. Ltd.
  • OMRON Corp.
  • OnLogic Inc.
  • Phoenix Contact GmbH and Co
  • Rockwell Automation Inc.
  • Schneider Electric SE
  • Siemens AG

Qualitative and quantitative analysis of companies has been conducted to help clients understand the wider business environment as well as the strengths and weaknesses of key industry players. Data is qualitatively analyzed to categorize companies as pure play, category-focused, industry-focused, and diversified; it is quantitatively analyzed to categorize companies as dominant, leading, strong, tentative, and weak.

Recent Development and News in Industrial pc market

  • In November 2025, Progress Rail secured a contract to supply advanced signaling technologies, including computer-based interlocking systems and traffic management systems founded on fault-tolerant industrial PCs, for Thailand's Khon Kaen–Nong Khai double-track railway line.
  • In October 2025, Vodafone and Ericsson announced a major pan-European agreement to modernize network infrastructure for 5G Standalone and Advanced capabilities, a hardware overhaul requiring powerful industrial computers to run virtualized baseband units and AI-driven automation platforms.
  • In March 2025, Sherpa 6, Inc. was awarded a contract by the U.S. Army DEVCOM C5ISR Center to develop and prototype a private tactical 5G system, requiring ruggedized commercial-off-the-shelf industrial PCs for mobile command post operations.
  • In February 2025, Codelco's board approved significant funding for the next phase of the Chuquicamata underground mine project in Chile, an advanced operation heavily reliant on a vast network of industrial PCs for automated material transport and remote management.

Dive into Technavio’s robust research methodology, blending expert interviews, extensive data synthesis, and validated models for unparalleled Industrial Pc Market insights. See full methodology.

Market Scope
Page number 313
Base year 2025
Historic period 2020-2024
Forecast period 2026-2030
Growth momentum & CAGR Accelerate at a CAGR of 6.8%
Market growth 2026-2030 USD 2269.2 million
Market structure Fragmented
YoY growth 2025-2026(%) 6.3%
Key countries China, Japan, India, South Korea, Australia, Indonesia, Germany, UK, Italy, France, Spain, The Netherlands, US, Canada, Mexico, Brazil, Argentina, Chile, Saudi Arabia, UAE, South Africa, Israel and Turkey
Competitive landscape Leading Companies, Market Positioning of Companies, Competitive Strategies, and Industry Risks

Request Free Sample

Research Analyst Overview

  • The industrial PC market is defined by its role as the foundational hardware for digital transformation in demanding environments. The core value is mission-critical reliability, achieved through industrial-grade components and ruggedized chassis construction. Systems are purpose-built, featuring solid-state storage drives and advanced thermal management, such as fanless cooling systems, to ensure longevity.
  • The evolution toward intelligent operations is powered by the integration of high-performance graphics processing units and neural processing units, enabling complex AIoT platforms and machine vision systems. These edge computing platforms execute predictive maintenance algorithms, with some users reporting a 30% reduction in unplanned downtime.
  • For boardroom consideration, the convergence of information technology (IT) with operational technology (OT) networks makes investment in secure boot mechanisms and long-lifecycle support a strategic imperative to mitigate escalating cybersecurity risks.
  • These systems are central to modern manufacturing execution systems (MES), supervisory control and data acquisition (SCADA), and advanced human-machine interface (HMI) applications, utilizing computer-on-modules and computer-based interlocking systems to enhance safety and efficiency in critical infrastructure.

What are the Key Data Covered in this Industrial Pc Market Research and Growth Report?

  • What is the expected growth of the Industrial Pc Market between 2026 and 2030?

    • USD 2.27 billion, at a CAGR of 6.8%

  • What segmentation does the market report cover?

    • The report is segmented by Product Type (Panel, Rackmount, Box, Embedded panel, and Others), End-user (Industrial, Transportation and traffic, Healthcare, Telecom and datacom, and Others), Technology (Fanless industrial PC, and Fan based industrial PC) and Geography (APAC, Europe, North America, South America, Middle East and Africa)

  • Which regions are analyzed in the report?

    • APAC, Europe, North America, South America and Middle East and Africa

  • What are the key growth drivers and market challenges?

    • Ascendancy of industry 4.0 and industrial internet of things frameworks, Significant capital outlay and perceived high total cost of ownership

  • Who are the major players in the Industrial Pc Market?

    • ABB Ltd., ADLINK Technology Inc., Advantech Co. Ltd., American Portwell Technology, Avalue Technology Inc., Axiomtek Co. Ltd., Beckhoff Automation, Dell Technologies Inc., IEI Integration Corp., Keyence Corp., Kontron AG, Mitsubishi Electric Corp., NEXCOM International Co. Ltd., OMRON Corp., OnLogic Inc., Phoenix Contact GmbH and Co, Rockwell Automation Inc., Schneider Electric SE and Siemens AG

Market Research Insights

  • The market's dynamic is shaped by the push for operational efficiency, with industrial automation controllers delivering a 30% improvement in process accuracy. The adoption of certified industrial hardware is essential in regulated sectors, where fault-tolerant industrial PC designs ensure compliance and safety.
  • This drive for reliability underpins the move toward server-grade industrial systems, which improve data integrity by over 25% compared to commercial alternatives. As industries deploy more IIoT sensor data aggregation solutions, the need for decentralized processing power increases.
  • The demand for advanced connectivity protocols supports this shift, with integrated systems reducing system integration complexity and providing a clear path for future technology refresh cycles. These factors collectively influence purchasing decisions, balancing initial cost with long-term performance and reliability.

We can help! Our analysts can customize this industrial pc market research report to meet your requirements.

Get in touch

1. Executive Summary

1.1 Market overview

Executive Summary - Chart on Market Overview
Executive Summary - Data Table on Market Overview
Executive Summary - Chart on Global Market Characteristics
Executive Summary - Chart on Market by Geography
Executive Summary - Chart on Market Segmentation by Product Type
Executive Summary - Chart on Market Segmentation by End-user
Executive Summary - Chart on Market Segmentation by Technology
Executive Summary - Chart on Incremental Growth
Executive Summary - Data Table on Incremental Growth
Executive Summary - Chart on Company Market Positioning

2. Technavio Analysis

2.1 Analysis of price sensitivity, lifecycle, customer purchase basket, adoption rates, and purchase criteria

2.2 Criticality of inputs and Factors of differentiation

Chart on Overview on criticality of inputs and factors of differentiation

2.3 Factors of disruption

Chart on Overview on factors of disruption

2.4 Impact of drivers and challenges

Chart on Impact of drivers and challenges in 2025 and 2030

3. Market Landscape

3.1 Market ecosystem

Chart on Parent Market
Data Table on - Parent Market

3.2 Market characteristics

Chart on Market characteristics analysis

3.3 Value chain analysis

Chart on Value chain analysis

4. Market Sizing

4.1 Market definition

Data Table on Offerings of companies included in the market definition

4.2 Market segment analysis

Market segments

4.3 Market size 2025

4.4 Market outlook: Forecast for 2025-2030

Chart on Global - Market size and forecast 2025-2030 ($ million)
Data Table on Global - Market size and forecast 2025-2030 ($ million)
Chart on Global Market: Year-over-year growth 2025-2030 (%)
Data Table on Global Market: Year-over-year growth 2025-2030 (%)

5. Historic Market Size

5.1 Global Industrial Pc Market 2020 - 2024

Historic Market Size - Data Table on Global Industrial Pc Market 2020 - 2024 ($ million)

5.2 Product Type segment analysis 2020 - 2024

Historic Market Size - Product Type Segment 2020 - 2024 ($ million)

5.3 End-user segment analysis 2020 - 2024

Historic Market Size - End-user Segment 2020 - 2024 ($ million)

5.4 Technology segment analysis 2020 - 2024

Historic Market Size - Technology Segment 2020 - 2024 ($ million)

5.5 Geography segment analysis 2020 - 2024

Historic Market Size - Geography Segment 2020 - 2024 ($ million)

5.6 Country segment analysis 2020 - 2024

Historic Market Size - Country Segment 2020 - 2024 ($ million)

6. Qualitative Analysis

6.1 The AI impact on global industrial PC market

7. Five Forces Analysis

7.1 Five forces summary

Five forces analysis - Comparison between 2025 and 2030

7.2 Bargaining power of buyers

Bargaining power of buyers - Impact of key factors 2025 and 2030

7.3 Bargaining power of suppliers

Bargaining power of suppliers - Impact of key factors in 2025 and 2030

7.4 Threat of new entrants

Threat of new entrants - Impact of key factors in 2025 and 2030

7.5 Threat of substitutes

Threat of substitutes - Impact of key factors in 2025 and 2030

7.6 Threat of rivalry

Threat of rivalry - Impact of key factors in 2025 and 2030

7.7 Market condition

Chart on Market condition - Five forces 2025 and 2030

8. Market Segmentation by Product Type

8.1 Market segments

Chart on Product Type - Market share 2025-2030 (%)
Data Table on Product Type - Market share 2025-2030 (%)

8.2 Comparison by Product Type

Chart on Comparison by Product Type
Data Table on Comparison by Product Type

8.3 Panel - Market size and forecast 2025-2030

Chart on Panel - Market size and forecast 2025-2030 ($ million)
Data Table on Panel - Market size and forecast 2025-2030 ($ million)
Chart on Panel - Year-over-year growth 2025-2030 (%)
Data Table on Panel - Year-over-year growth 2025-2030 (%)

8.4 Rackmount - Market size and forecast 2025-2030

Chart on Rackmount - Market size and forecast 2025-2030 ($ million)
Data Table on Rackmount - Market size and forecast 2025-2030 ($ million)
Chart on Rackmount - Year-over-year growth 2025-2030 (%)
Data Table on Rackmount - Year-over-year growth 2025-2030 (%)

8.5 Box - Market size and forecast 2025-2030

Chart on Box - Market size and forecast 2025-2030 ($ million)
Data Table on Box - Market size and forecast 2025-2030 ($ million)
Chart on Box - Year-over-year growth 2025-2030 (%)
Data Table on Box - Year-over-year growth 2025-2030 (%)

8.6 Embedded panel - Market size and forecast 2025-2030

Chart on Embedded panel - Market size and forecast 2025-2030 ($ million)
Data Table on Embedded panel - Market size and forecast 2025-2030 ($ million)
Chart on Embedded panel - Year-over-year growth 2025-2030 (%)
Data Table on Embedded panel - Year-over-year growth 2025-2030 (%)

8.7 Others - Market size and forecast 2025-2030

Chart on Others - Market size and forecast 2025-2030 ($ million)
Data Table on Others - Market size and forecast 2025-2030 ($ million)
Chart on Others - Year-over-year growth 2025-2030 (%)
Data Table on Others - Year-over-year growth 2025-2030 (%)

8.8 Market opportunity by Product Type

Market opportunity by Product Type ($ million)
Data Table on Market opportunity by Product Type ($ million)

9. Market Segmentation by End-user

9.1 Market segments

Chart on End-user - Market share 2025-2030 (%)
Data Table on End-user - Market share 2025-2030 (%)

9.2 Comparison by End-user

Chart on Comparison by End-user
Data Table on Comparison by End-user

9.3 Industrial - Market size and forecast 2025-2030

Chart on Industrial - Market size and forecast 2025-2030 ($ million)
Data Table on Industrial - Market size and forecast 2025-2030 ($ million)
Chart on Industrial - Year-over-year growth 2025-2030 (%)
Data Table on Industrial - Year-over-year growth 2025-2030 (%)

9.4 Transportation and traffic - Market size and forecast 2025-2030

Chart on Transportation and traffic - Market size and forecast 2025-2030 ($ million)
Data Table on Transportation and traffic - Market size and forecast 2025-2030 ($ million)
Chart on Transportation and traffic - Year-over-year growth 2025-2030 (%)
Data Table on Transportation and traffic - Year-over-year growth 2025-2030 (%)

9.5 Healthcare - Market size and forecast 2025-2030

Chart on Healthcare - Market size and forecast 2025-2030 ($ million)
Data Table on Healthcare - Market size and forecast 2025-2030 ($ million)
Chart on Healthcare - Year-over-year growth 2025-2030 (%)
Data Table on Healthcare - Year-over-year growth 2025-2030 (%)

9.6 Telecom and datacom - Market size and forecast 2025-2030

Chart on Telecom and datacom - Market size and forecast 2025-2030 ($ million)
Data Table on Telecom and datacom - Market size and forecast 2025-2030 ($ million)
Chart on Telecom and datacom - Year-over-year growth 2025-2030 (%)
Data Table on Telecom and datacom - Year-over-year growth 2025-2030 (%)

9.7 Others - Market size and forecast 2025-2030

Chart on Others - Market size and forecast 2025-2030 ($ million)
Data Table on Others - Market size and forecast 2025-2030 ($ million)
Chart on Others - Year-over-year growth 2025-2030 (%)
Data Table on Others - Year-over-year growth 2025-2030 (%)

9.8 Market opportunity by End-user

Market opportunity by End-user ($ million)
Data Table on Market opportunity by End-user ($ million)

10. Market Segmentation by Technology

10.1 Market segments

Chart on Technology - Market share 2025-2030 (%)
Data Table on Technology - Market share 2025-2030 (%)

10.2 Comparison by Technology

Chart on Comparison by Technology
Data Table on Comparison by Technology

10.3 Fanless industrial PC - Market size and forecast 2025-2030

Chart on Fanless industrial PC - Market size and forecast 2025-2030 ($ million)
Data Table on Fanless industrial PC - Market size and forecast 2025-2030 ($ million)
Chart on Fanless industrial PC - Year-over-year growth 2025-2030 (%)
Data Table on Fanless industrial PC - Year-over-year growth 2025-2030 (%)

10.4 Fan based industrial PC - Market size and forecast 2025-2030

Chart on Fan based industrial PC - Market size and forecast 2025-2030 ($ million)
Data Table on Fan based industrial PC - Market size and forecast 2025-2030 ($ million)
Chart on Fan based industrial PC - Year-over-year growth 2025-2030 (%)
Data Table on Fan based industrial PC - Year-over-year growth 2025-2030 (%)

10.5 Market opportunity by Technology

Market opportunity by Technology ($ million)
Data Table on Market opportunity by Technology ($ million)

11. Customer Landscape

11.1 Customer landscape overview

Analysis of price sensitivity, lifecycle, customer purchase basket, adoption rates, and purchase criteria

12. Geographic Landscape

12.1 Geographic segmentation

Chart on Market share by geography 2025-2030 (%)
Data Table on Market share by geography 2025-2030 (%)

12.2 Geographic comparison

Chart on Geographic comparison
Data Table on Geographic comparison

12.3 APAC - Market size and forecast 2025-2030

Chart on APAC - Market size and forecast 2025-2030 ($ million)
Data Table on APAC - Market size and forecast 2025-2030 ($ million)
Chart on APAC - Year-over-year growth 2025-2030 (%)
Data Table on APAC - Year-over-year growth 2025-2030 (%)
Chart on Regional Comparison - APAC
Data Table on Regional Comparison - APAC

12.3.1 China - Market size and forecast 2025-2030

Chart on China - Market size and forecast 2025-2030 ($ million)
Data Table on China - Market size and forecast 2025-2030 ($ million)
Chart on China - Year-over-year growth 2025-2030 (%)
Data Table on China - Year-over-year growth 2025-2030 (%)

12.3.2 Japan - Market size and forecast 2025-2030

Chart on Japan - Market size and forecast 2025-2030 ($ million)
Data Table on Japan - Market size and forecast 2025-2030 ($ million)
Chart on Japan - Year-over-year growth 2025-2030 (%)
Data Table on Japan - Year-over-year growth 2025-2030 (%)

12.3.3 India - Market size and forecast 2025-2030

Chart on India - Market size and forecast 2025-2030 ($ million)
Data Table on India - Market size and forecast 2025-2030 ($ million)
Chart on India - Year-over-year growth 2025-2030 (%)
Data Table on India - Year-over-year growth 2025-2030 (%)

12.3.4 South Korea - Market size and forecast 2025-2030

Chart on South Korea - Market size and forecast 2025-2030 ($ million)
Data Table on South Korea - Market size and forecast 2025-2030 ($ million)
Chart on South Korea - Year-over-year growth 2025-2030 (%)
Data Table on South Korea - Year-over-year growth 2025-2030 (%)

12.3.5 Australia - Market size and forecast 2025-2030

Chart on Australia - Market size and forecast 2025-2030 ($ million)
Data Table on Australia - Market size and forecast 2025-2030 ($ million)
Chart on Australia - Year-over-year growth 2025-2030 (%)
Data Table on Australia - Year-over-year growth 2025-2030 (%)

12.3.6 Indonesia - Market size and forecast 2025-2030

Chart on Indonesia - Market size and forecast 2025-2030 ($ million)
Data Table on Indonesia - Market size and forecast 2025-2030 ($ million)
Chart on Indonesia - Year-over-year growth 2025-2030 (%)
Data Table on Indonesia - Year-over-year growth 2025-2030 (%)

12.4 Europe - Market size and forecast 2025-2030

Chart on Europe - Market size and forecast 2025-2030 ($ million)
Data Table on Europe - Market size and forecast 2025-2030 ($ million)
Chart on Europe - Year-over-year growth 2025-2030 (%)
Data Table on Europe - Year-over-year growth 2025-2030 (%)
Chart on Regional Comparison - Europe
Data Table on Regional Comparison - Europe

12.4.1 Germany - Market size and forecast 2025-2030

Chart on Germany - Market size and forecast 2025-2030 ($ million)
Data Table on Germany - Market size and forecast 2025-2030 ($ million)
Chart on Germany - Year-over-year growth 2025-2030 (%)
Data Table on Germany - Year-over-year growth 2025-2030 (%)

12.4.2 UK - Market size and forecast 2025-2030

Chart on UK - Market size and forecast 2025-2030 ($ million)
Data Table on UK - Market size and forecast 2025-2030 ($ million)
Chart on UK - Year-over-year growth 2025-2030 (%)
Data Table on UK - Year-over-year growth 2025-2030 (%)

12.4.3 Italy - Market size and forecast 2025-2030

Chart on Italy - Market size and forecast 2025-2030 ($ million)
Data Table on Italy - Market size and forecast 2025-2030 ($ million)
Chart on Italy - Year-over-year growth 2025-2030 (%)
Data Table on Italy - Year-over-year growth 2025-2030 (%)

12.4.4 France - Market size and forecast 2025-2030

Chart on France - Market size and forecast 2025-2030 ($ million)
Data Table on France - Market size and forecast 2025-2030 ($ million)
Chart on France - Year-over-year growth 2025-2030 (%)
Data Table on France - Year-over-year growth 2025-2030 (%)

12.4.5 Spain - Market size and forecast 2025-2030

Chart on Spain - Market size and forecast 2025-2030 ($ million)
Data Table on Spain - Market size and forecast 2025-2030 ($ million)
Chart on Spain - Year-over-year growth 2025-2030 (%)
Data Table on Spain - Year-over-year growth 2025-2030 (%)

12.4.6 The Netherlands - Market size and forecast 2025-2030

Chart on The Netherlands - Market size and forecast 2025-2030 ($ million)
Data Table on The Netherlands - Market size and forecast 2025-2030 ($ million)
Chart on The Netherlands - Year-over-year growth 2025-2030 (%)
Data Table on The Netherlands - Year-over-year growth 2025-2030 (%)

12.5 North America - Market size and forecast 2025-2030

Chart on North America - Market size and forecast 2025-2030 ($ million)
Data Table on North America - Market size and forecast 2025-2030 ($ million)
Chart on North America - Year-over-year growth 2025-2030 (%)
Data Table on North America - Year-over-year growth 2025-2030 (%)
Chart on Regional Comparison - North America
Data Table on Regional Comparison - North America

12.5.1 US - Market size and forecast 2025-2030

Chart on US - Market size and forecast 2025-2030 ($ million)
Data Table on US - Market size and forecast 2025-2030 ($ million)
Chart on US - Year-over-year growth 2025-2030 (%)
Data Table on US - Year-over-year growth 2025-2030 (%)

12.5.2 Canada - Market size and forecast 2025-2030

Chart on Canada - Market size and forecast 2025-2030 ($ million)
Data Table on Canada - Market size and forecast 2025-2030 ($ million)
Chart on Canada - Year-over-year growth 2025-2030 (%)
Data Table on Canada - Year-over-year growth 2025-2030 (%)

12.5.3 Mexico - Market size and forecast 2025-2030

Chart on Mexico - Market size and forecast 2025-2030 ($ million)
Data Table on Mexico - Market size and forecast 2025-2030 ($ million)
Chart on Mexico - Year-over-year growth 2025-2030 (%)
Data Table on Mexico - Year-over-year growth 2025-2030 (%)

12.6 South America - Market size and forecast 2025-2030

Chart on South America - Market size and forecast 2025-2030 ($ million)
Data Table on South America - Market size and forecast 2025-2030 ($ million)
Chart on South America - Year-over-year growth 2025-2030 (%)
Data Table on South America - Year-over-year growth 2025-2030 (%)
Chart on Regional Comparison - South America
Data Table on Regional Comparison - South America

12.6.1 Brazil - Market size and forecast 2025-2030

Chart on Brazil - Market size and forecast 2025-2030 ($ million)
Data Table on Brazil - Market size and forecast 2025-2030 ($ million)
Chart on Brazil - Year-over-year growth 2025-2030 (%)
Data Table on Brazil - Year-over-year growth 2025-2030 (%)

12.6.2 Argentina - Market size and forecast 2025-2030

Chart on Argentina - Market size and forecast 2025-2030 ($ million)
Data Table on Argentina - Market size and forecast 2025-2030 ($ million)
Chart on Argentina - Year-over-year growth 2025-2030 (%)
Data Table on Argentina - Year-over-year growth 2025-2030 (%)

12.6.3 Chile - Market size and forecast 2025-2030

Chart on Chile - Market size and forecast 2025-2030 ($ million)
Data Table on Chile - Market size and forecast 2025-2030 ($ million)
Chart on Chile - Year-over-year growth 2025-2030 (%)
Data Table on Chile - Year-over-year growth 2025-2030 (%)

12.7 Middle East and Africa - Market size and forecast 2025-2030

Chart on Middle East and Africa - Market size and forecast 2025-2030 ($ million)
Data Table on Middle East and Africa - Market size and forecast 2025-2030 ($ million)
Chart on Middle East and Africa - Year-over-year growth 2025-2030 (%)
Data Table on Middle East and Africa - Year-over-year growth 2025-2030 (%)
Chart on Regional Comparison - Middle East and Africa
Data Table on Regional Comparison - Middle East and Africa

12.7.1 Saudi Arabia - Market size and forecast 2025-2030

Chart on Saudi Arabia - Market size and forecast 2025-2030 ($ million)
Data Table on Saudi Arabia - Market size and forecast 2025-2030 ($ million)
Chart on Saudi Arabia - Year-over-year growth 2025-2030 (%)
Data Table on Saudi Arabia - Year-over-year growth 2025-2030 (%)

12.7.2 UAE - Market size and forecast 2025-2030

Chart on UAE - Market size and forecast 2025-2030 ($ million)
Data Table on UAE - Market size and forecast 2025-2030 ($ million)
Chart on UAE - Year-over-year growth 2025-2030 (%)
Data Table on UAE - Year-over-year growth 2025-2030 (%)

12.7.3 South Africa - Market size and forecast 2025-2030

Chart on South Africa - Market size and forecast 2025-2030 ($ million)
Data Table on South Africa - Market size and forecast 2025-2030 ($ million)
Chart on South Africa - Year-over-year growth 2025-2030 (%)
Data Table on South Africa - Year-over-year growth 2025-2030 (%)

12.7.4 Israel - Market size and forecast 2025-2030

Chart on Israel - Market size and forecast 2025-2030 ($ million)
Data Table on Israel - Market size and forecast 2025-2030 ($ million)
Chart on Israel - Year-over-year growth 2025-2030 (%)
Data Table on Israel - Year-over-year growth 2025-2030 (%)

12.7.5 Turkey - Market size and forecast 2025-2030

Chart on Turkey - Market size and forecast 2025-2030 ($ million)
Data Table on Turkey - Market size and forecast 2025-2030 ($ million)
Chart on Turkey - Year-over-year growth 2025-2030 (%)
Data Table on Turkey - Year-over-year growth 2025-2030 (%)

12.8 Market opportunity by geography

Market opportunity by geography ($ million)
Data Tables on Market opportunity by geography ($ million)

13. Drivers, Challenges, and Opportunity

13.1 Market drivers

Ascendancy of industry 4.0 and industrial internet of things frameworks
Intensifying momentum toward automation and robotic integration
Growing requirement for ruggedized, high performance computing in demanding environments

13.2 Market challenges

Significant capital outlay and perceived high total cost of ownership
Navigating rapid technological advancement and complex system integration
Escalating cybersecurity vulnerabilities in converged IT and OT networks

13.3 Impact of drivers and challenges

Impact of drivers and challenges in 2025 and 2030

13.4 Market opportunities

Convergence of edge computing and artificial intelligence acceleration
Ascendancy of compact form factors and modular design philosophy
Integration of advanced connectivity, including 5G and wireless protocols

14. Competitive Landscape

14.1 Overview

14.2

Overview on criticality of inputs and factors of differentiation

14.3 Landscape disruption

Overview on factors of disruption

14.4 Industry risks

Impact of key risks on business

15. Competitive Analysis

15.1 Companies profiled

Companies covered

15.2 Company ranking index

15.3 Market positioning of companies

Matrix on companies position and classification

15.4 ABB Ltd.

ABB Ltd. - Overview
ABB Ltd. - Business segments
ABB Ltd. - Key news
ABB Ltd. - Key offerings
ABB Ltd. - Segment focus
SWOT

15.5 ADLINK Technology Inc.

ADLINK Technology Inc. - Overview
ADLINK Technology Inc. - Business segments
ADLINK Technology Inc. - Key offerings
ADLINK Technology Inc. - Segment focus
SWOT

15.6 Advantech Co. Ltd.

Advantech Co. Ltd. - Overview
Advantech Co. Ltd. - Business segments
Advantech Co. Ltd. - Key news
Advantech Co. Ltd. - Key offerings
Advantech Co. Ltd. - Segment focus
SWOT

15.7 American Portwell Technology

American Portwell Technology - Overview
American Portwell Technology - Product / Service
American Portwell Technology - Key offerings
SWOT

15.8 Avalue Technology Inc.

Avalue Technology Inc. - Overview
Avalue Technology Inc. - Product / Service
Avalue Technology Inc. - Key offerings
SWOT

15.9 Axiomtek Co. Ltd.

Axiomtek Co. Ltd. - Overview
Axiomtek Co. Ltd. - Product / Service
Axiomtek Co. Ltd. - Key offerings
SWOT

15.10 Beckhoff Automation

Beckhoff Automation - Overview
Beckhoff Automation - Product / Service
Beckhoff Automation - Key offerings
SWOT

15.11 Dell Technologies Inc.

Dell Technologies Inc. - Overview
Dell Technologies Inc. - Business segments
Dell Technologies Inc. - Key news
Dell Technologies Inc. - Key offerings
Dell Technologies Inc. - Segment focus
SWOT

15.12 IEI Integration Corp.

IEI Integration Corp. - Overview
IEI Integration Corp. - Product / Service
IEI Integration Corp. - Key offerings
SWOT

15.13 Mitsubishi Electric Corp.

Mitsubishi Electric Corp. - Overview
Mitsubishi Electric Corp. - Business segments
Mitsubishi Electric Corp. - Key offerings
Mitsubishi Electric Corp. - Segment focus
SWOT

15.14 OMRON Corp.

OMRON Corp. - Overview
OMRON Corp. - Business segments
OMRON Corp. - Key news
OMRON Corp. - Key offerings
OMRON Corp. - Segment focus
SWOT

15.15 OnLogic Inc.

OnLogic Inc. - Overview
OnLogic Inc. - Product / Service
OnLogic Inc. - Key offerings
SWOT

15.16 Rockwell Automation Inc.

Rockwell Automation Inc. - Overview
Rockwell Automation Inc. - Business segments
Rockwell Automation Inc. - Key news
Rockwell Automation Inc. - Key offerings
Rockwell Automation Inc. - Segment focus
SWOT

15.17 Schneider Electric SE

Schneider Electric SE - Overview
Schneider Electric SE - Business segments
Schneider Electric SE - Key news
Schneider Electric SE - Key offerings
Schneider Electric SE - Segment focus
SWOT

15.18 Siemens AG

Siemens AG - Overview
Siemens AG - Business segments
Siemens AG - Key news
Siemens AG - Key offerings
Siemens AG - Segment focus
SWOT

16. Appendix

16.1 Scope of the report

Market definition
Objectives
Notes and caveats

16.2 Inclusions and exclusions checklist

Inclusions checklist
Exclusions checklist

16.3 Currency conversion rates for US$

16.4 Research methodology

16.5 Data procurement

Information sources

16.6 Data validation

16.7 Validation techniques employed for market sizing

16.8 Data synthesis

16.9 360 degree market analysis

16.10 List of abbreviations

Research Methodology

Technavio presents a detailed picture of the market by way of study, synthesis, and summation of data from multiple sources. The analysts have presented the various facets of the market with a particular focus on identifying the key industry influencers. The data thus presented is comprehensive, reliable, and the result of extensive research, both primary and secondary.

INFORMATION SOURCES

Primary sources

  • Manufacturers and suppliers
  • Channel partners
  • Industry experts
  • Strategic decision makers

Secondary sources

  • Industry journals and periodicals
  • Government data
  • Financial reports of key industry players
  • Historical data
  • Press releases

DATA ANALYSIS

Data Synthesis

  • Collation of data
  • Estimation of key figures
  • Analysis of derived insights

Data Validation

  • Triangulation with data models
  • Reference against proprietary databases
  • Corroboration with industry experts

REPORT WRITING

Qualitative

  • Market drivers
  • Market challenges
  • Market trends
  • Five forces analysis

Quantitative

  • Market size and forecast
  • Market segmentation
  • Geographical insights
  • Competitive landscape

Interested in this report?

Get your sample now to see our research methodology and insights!

Download Now

Frequently Asked Questions

Industrial Pc market growth will increase by USD 2269.2 million during 2026-2030.

The Industrial Pc market is expected to grow at a CAGR of 6.8% during 2026-2030.

Industrial Pc market is segmented by Product type (Panel, Rackmount, Box, Embedded panel, Others) End-user (Industrial, Transportation and traffic, Healthcare, Telecom and datacom, Others) Technology (Fanless industrial PC, Fan based industrial PC)

ABB Ltd., ADLINK Technology Inc., Advantech Co. Ltd., American Portwell Technology, Avalue Technology Inc., Axiomtek Co. Ltd., Beckhoff Automation, Dell Technologies Inc., IEI Integration Corp., Keyence Corp., Kontron AG, Mitsubishi Electric Corp., NEXCOM International Co. Ltd., OMRON Corp., OnLogic Inc., Phoenix Contact GmbH and Co, Rockwell Automation Inc., Schneider Electric SE, Siemens AG are a few of the key vendors in the Industrial Pc market.

APAC will register the highest growth rate of 40.1% among the other regions. Therefore, the Industrial Pc market in APAC is expected to garner significant business opportunities for the vendors during the forecast period.

China, Japan, India, South Korea, Australia, Indonesia, Germany, UK, Italy, France, Spain, The Netherlands, US, Canada, Mexico, Brazil, Argentina, Chile, Saudi Arabia, UAE, South Africa, Israel, Turkey

  • Ascendancy of industry 4.0 and industrial internet of things frameworks is the driving factor this market.

The Industrial Pc market vendors should focus on grabbing business opportunities from the Product type segment as it accounted for the largest market share in the base year.