Industrial Pumps Market Size 2024-2028
The industrial pumps market size is forecast to increase by USD 17.4 billion, at a CAGR of 5.2% between 2023 and 2028.
- The market is witnessing significant growth, driven by the increasing emphasis on machinery efficiency and cost reduction. This trend is particularly prominent in industries such as oil and gas, water and wastewater treatment, and power generation, where optimizing operational costs is crucial. Another key driver is the increasing adoption of solar pumps, which offer energy efficiency and sustainability benefits. However, the market faces challenges, including the volatility of raw material prices. This can impact the cost structure of pump manufacturers and, in turn, the pricing strategies of pump suppliers. To navigate these challenges, companies must focus on innovation and cost optimization, exploring alternative materials and manufacturing processes to mitigate the impact of raw material price fluctuations.
- Additionally, strategic partnerships and collaborations can help companies gain a competitive edge by improving their supply chain resilience and enhancing their product offerings. Overall, the market presents both opportunities and challenges for companies seeking to capitalize on the growing demand for efficient and sustainable pumping solutions.
What will be the Size of the Industrial Pumps Market during the forecast period?
Explore in-depth regional segment analysis with market size data - historical 2018-2022 and forecasts 2024-2028 - in the full report.
Request Free Sample
The market is characterized by continuous evolution and dynamism, with various types of pumps catering to diverse applications across numerous sectors. Pump automation, an integral part of this landscape, enhances efficiency and productivity. Oil pumps, a vital component in power generation and transportation industries, are subject to stringent regulations. Rotary pumps, with their positive displacement mechanism, find extensive use in chemical processing. Pump shafts, a critical element, require robust materials for high-pressure applications. Pump certifications ensure compliance with industry standards, while submersible pumps operate efficiently in challenging environments. High-flow pumps and low-pressure pumps address specific requirements in water and wastewater treatment.
Pump impellers and bearings undergo constant innovation for improved performance. Positive displacement pumps, such as screw pumps and vane pumps, offer precise volume delivery. Centrifugal pumps, a staple in HVAC systems, ensure efficient cooling and heating. Sealless pumps, an essential safety feature, eliminate leakage risks. Pump reliability, sizing, and performance are crucial factors in pump selection. Slurry pumps, designed for handling abrasive materials, are indispensable in mining operations. Pump life cycle, maintenance, repair, and monitoring are essential aspects of pump management. Pump installation, replacement, commissioning, diagnostics, and seals require expert knowledge. Material selection, design, safety, and regulations influence pump efficiency and effectiveness.
The market encompasses a myriad of pump types, including boiler feed pumps, horizontal pumps, gear pumps, peristaltic pumps, fire pumps, process pumps, magnetic drive pumps, and irrigation pumps. The ongoing unfolding of market activities and evolving patterns underscore the importance of staying abreast of the latest trends and developments.
How is this Industrial Pumps Industry segmented?
The industrial pumps industry research report provides comprehensive data (region-wise segment analysis), with forecasts and estimates in "USD billion" for the period 2024-2028, as well as historical data from 2018-2022 for the following segments.
- Product
- Centrifugal
- Positive displacement
- Geography
- North America
- US
- Europe
- Russia
- UK
- APAC
- China
- Japan
- Rest of World (ROW)
- North America
.
By Product Insights
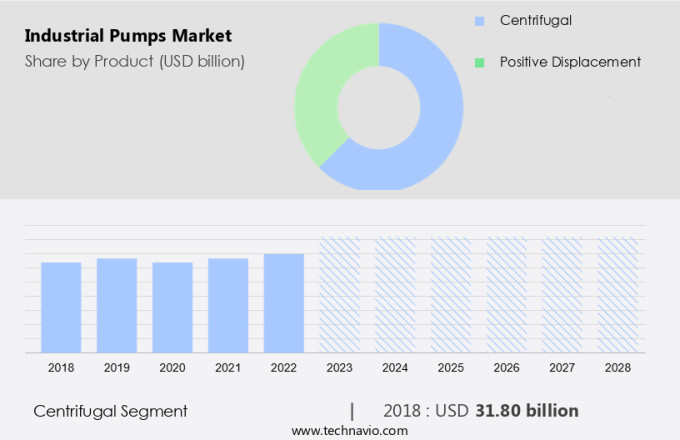
The centrifugal segment is estimated to witness significant growth during the forecast period.
Centrifugal pumps play a pivotal role in transferring fluids across various industries, including manufacturing, construction, and agriculture. These pumps, capable of handling thin liquids such as water, solvents, oils, and chemicals, demonstrate versatility and appeal due to their extensive application potential. The emphasis on energy efficiency and sustainability is driving manufacturers to innovate and produce advanced centrifugal pumps. The Asia Pacific (APAC) region is a significant market contributor, fueled by economic growth, urbanization, and a robust manufacturing sector in countries like China and India. Ongoing construction projects and industrial expansion in APAC further amplify the demand for efficient pumping solutions.
The market for these pumps is experiencing growth due to the increasing demand for efficient and reliable pumping solutions across various industries. The focus on reducing operational costs, enhancing productivity, and ensuring safety and compliance with regulations is further fueling the market's expansion. Additionally, the development of advanced technologies, such as pump automation, is transforming the market landscape by offering improved performance, reduced downtime, and enhanced energy efficiency. In conclusion, the market is a dynamic and diverse sector that caters to the ever-evolving needs of various industries. The market's growth is driven by factors such as increasing demand for efficient and reliable pumping solutions, the focus on reducing operational costs, and the development of advanced technologies.
The APAC region, with its robust manufacturing base and economic growth, is a significant contributor to the market's expansion.
The Centrifugal segment was valued at USD 31.80 billion in 2018 and showed a gradual increase during the forecast period.
Regional Analysis
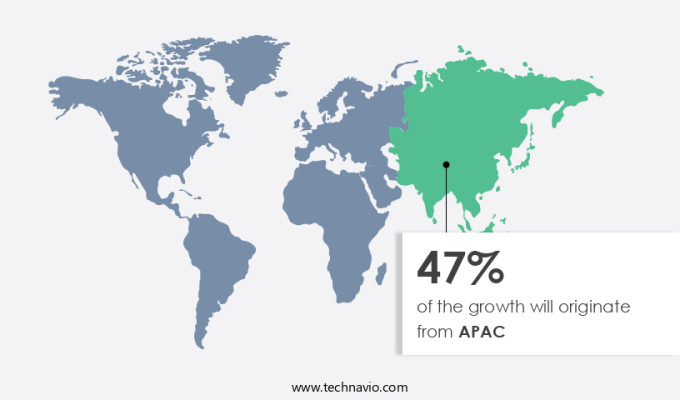
APAC is estimated to contribute 47% to the growth of the global market during the forecast period.Technavio's analysts have elaborately explained the regional trends and drivers that shape the market during the forecast period.
The industrial pump market is experiencing significant growth due to the increasing demand for various types of pumps in numerous industries. Centrifugal pumps are in high demand in the water and wastewater and oil and gas sectors. The availability of natural resources and low-cost labor in Asia Pacific (APAC) is driving industrial development in the region, leading to increased demand for industrial pumps. In addition, investments in water treatment plants and upgrades to water supply systems in countries like Singapore and India, due to growing populations and water demand, are boosting the market. Positive displacement pumps, such as screw, vane, and diaphragm pumps, are also gaining popularity for their efficiency and reliability in various applications.
The demand for high-flow and low-pressure pumps is increasing in the HVAC industry, while sealless pumps are preferred in industries where leakage is not acceptable. Boiler feed pumps, horizontal pumps, gear pumps, and magnetic drive pumps are other types of industrial pumps that are widely used. Pump reliability, sizing, and performance are crucial factors in pump selection. Industrial pumps undergo rigorous testing and certification to meet industry standards and regulations. Pump installation, replacement, commissioning, diagnostics, and maintenance are essential aspects of pump usage. Pump troubleshooting and controls are also critical to ensure optimal pump performance. The market for industrial pumps is diverse and dynamic, with various applications in industries such as irrigation, cooling water, fire fighting, process, and wastewater treatment.
Material selection, design, safety, and efficiency are key considerations in pump manufacturing. The market is expected to continue growing due to the increasing demand for water and other fluids in various industries.
Market Dynamics
Our researchers analyzed the data with 2023 as the base year, along with the key drivers, trends, and challenges. A holistic analysis of drivers will help companies refine their marketing strategies to gain a competitive advantage.
What are the key market drivers leading to the rise in the adoption of Industrial Pumps Industry?
- The significance of enhancing machinery efficiency and decreasing operational costs is a primary factor propelling market growth.
- Centrifugal pumps are essential machinery in various industries, moving fluids or water through impellers and heads. End-users are increasingly upgrading their centrifugal pumps to enhance machinery efficiency, minimize operational costs, and integrate comprehensive operational functions. The global push towards energy conservation has driven this trend, with governments worldwide imposing stringent regulations to control energy consumption. Old motors in centrifugal pumps consume significant energy, making it necessary for industries to upgrade and modernize their pump infrastructure. The efficiency of centrifugal pumps is contingent on the impeller and head design, which determines the volume of fluids or water the motor can move.
- Pump materials, such as stainless steel or cast iron, and advanced technologies like pump monitoring and repair systems, progressive cavity pumps, and pump safety features, are essential considerations in the selection and maintenance of centrifugal pumps. Pump standards and regulations ensure safety and reliability, while pump design innovations continue to address the evolving needs of diverse industries, including irrigation, cooling water, wastewater, and high-pressure applications.
What are the market trends shaping the Industrial Pumps Industry?
- The increasing adoption of solar pumps represents a significant market trend in the agricultural sector. Solar pumps offer sustainable and cost-effective irrigation solutions, making them an attractive choice for farmers.
- Solar pumps, which convert sunlight into electricity to power centrifugal pumps, are gaining traction among end-users due to the energy deficit in various countries. These pumps are predominantly utilized in agricultural applications, particularly in Asia Pacific nations like India and Bangladesh, where electricity supply is insufficient. In these regions, diesel-fueled generators are commonly used as alternatives, but their economic viability is questionable. Solar pumps offer a more cost-effective and eco-friendly solution.
- Furthermore, they find application in water treatment plants, contributing to their increasing demand. The expanding use of solar pumps across industries is anticipated to fuel the demand for industrial pumps.
What challenges does the Industrial Pumps Industry face during its growth?
- The volatility in raw material prices poses a significant challenge to the industry's growth trajectory. In order to maintain profitability and competitiveness, businesses must effectively manage price fluctuations and adapt to market conditions. This requires a deep understanding of global commodity markets, supply chain optimization, and strategic inventory management. Moreover, companies may explore alternative sourcing strategies, such as supplier diversification and long-term contracts, to mitigate the risks associated with price volatility.
- The market is influenced by various factors, including the cost of raw materials and the adoption of pump automation. Centrifugal pumps, which are widely used in industries, rely on raw materials such as stainless steel, iron, bronze, and copper for their production. Fluctuations in the prices of these materials, influenced by inflation, production, and availability, can significantly impact the cost of production and, in turn, the market's growth. To mitigate the effects of raw material price volatility, major companies often establish long-term contracts with their suppliers. However, this strategy may not be feasible for smaller companies, leaving them vulnerable to price fluctuations.
- Moreover, the market is witnessing increasing demand for advanced pump technologies, such as pump automation, in various industries. This trend is driven by the need for energy efficiency, cost savings, and improved operational performance. Different types of industrial pumps, including oil pumps, rotary pumps, high-flow pumps, low-pressure pumps, pump impellers, pump bearings, positive displacement pumps, screw pumps, vane pumps, and centrifugal pumps, cater to diverse applications and industries. The choice of pump type depends on the specific application requirements, such as flow rate, pressure, and fluid properties. In conclusion, the market is driven by the need for pump automation and the demand for various pump types in various industries.
- However, the market's growth may be hampered by the volatility in raw material prices.
Exclusive Customer Landscape
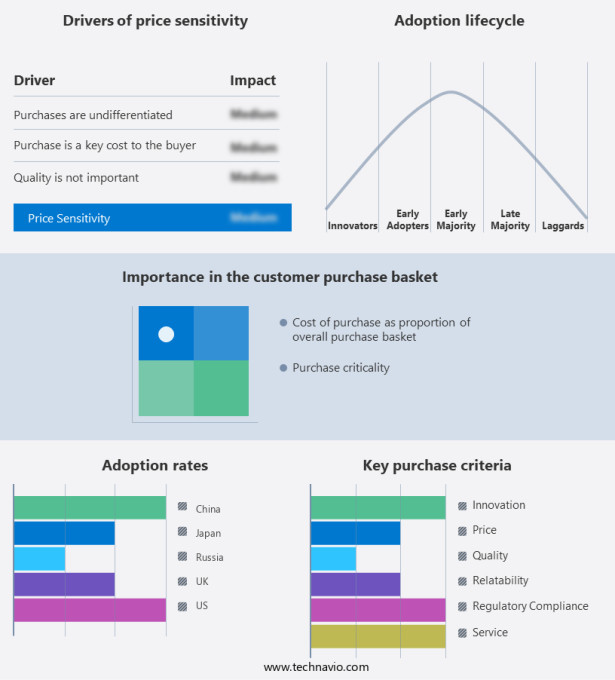
The industrial pumps market forecasting report includes the adoption lifecycle of the market, covering from the innovator's stage to the laggard's stage. It focuses on adoption rates in different regions based on penetration. Furthermore, the industrial pumps market report also includes key purchase criteria and drivers of price sensitivity to help companies evaluate and develop their market growth analysis strategies.
Customer Landscape
Key Companies & Market Insights
Companies are implementing various strategies, such as strategic alliances, industrial pumps market forecast, partnerships, mergers and acquisitions, geographical expansion, and product/service launches, to enhance their presence in the industry.
A.R. North America, Inc - Annovi Reverberi's industrial pumps are designed for demanding applications, effectively moving various material types such as water and wastewater, chemicals, oil, petroleum, sludges and slurries, and food products.
The industry research and growth report includes detailed analyses of the competitive landscape of the market and information about key companies, including:
- A.R. North America, Inc
- Ebara Corp.
- Flowserve Corp.
- Grundfos Holding AS
- HERMETIC Pumpen GmbH
- ITT Inc.
- Iwaki America Inc.
- Kishor Pumps Pvt. Ltd.
- KSB SE and Co. KGaA
- Magnatex Pumps Inc.
- MWI Pumps
- Pumptec Inc.
- Roth Pump Co.
- Schlumberger Ltd.
- SPX FLOW Inc.
- Star Pump Alliance GmbH
- Sulzer Ltd.
- The Weir Group Plc
- TriRotor Inc.
- TruFlo Pumping Systems
- Vaughan Co. Inc.
Qualitative and quantitative analysis of companies has been conducted to help clients understand the wider business environment as well as the strengths and weaknesses of key industry players. Data is qualitatively analyzed to categorize companies as pure play, category-focused, industry-focused, and diversified; it is quantitatively analyzed to categorize companies as dominant, leading, strong, tentative, and weak.
Recent Development and News in Industrial Pumps Market
- In March 2024, Flowserve Corporation, a leading industrial pump provider, announced the launch of its new MagDrive Magnetic Drive Centrifugal Pump series. This innovative product line offers improved efficiency and reduced maintenance costs due to its magnetic drive technology (Flowserve Corporation Press Release, 2024).
- In August 2024, Sulzer and Grundfos, two major players in the market, entered into a strategic partnership to expand their combined offerings in the water and wastewater sector. This collaboration aims to enhance their product portfolios and strengthen their market presence (Sulzer AG Press Release, 2024).
- In January 2025, Gardner Denver Holdings, Inc. Completed the acquisition of the industrial pumps business from ITT Inc. This deal significantly expanded Gardner Denver's product offerings and customer base, making it a more formidable competitor in The market (Gardner Denver Holdings, Inc. Press Release, 2025).
- In May 2025, the European Union passed new regulations on energy efficiency standards for industrial pumps. These regulations, set to take effect in 2027, will require pumps to meet stricter efficiency requirements, driving innovation and investment in energy-efficient technologies within the industry (European Parliament and Council of the European Union, 2025).
Research Analyst Overview
- The market encompasses various segments, including energy consumption, pump market segmentation, and application-specific pumps. Fluid density, viscosity, and temperature range are crucial factors influencing pump selection. Wear and tear, corrosion resistance, and abrasion resistance are essential considerations for ensuring pump durability. Pump service providers offer maintenance and repair services to mitigate downtime. Pump industry associations promote industry standards and best practices. Remote monitoring, efficiency testing, and performance testing are key trends driving innovation in the pump industry. Pump curves, fluid dynamics, and head pressure are critical aspects of pump design and operation. Noise level and chemical compatibility are essential factors for selecting pumps for specific applications.
- Pump manufacturing processes continue to evolve, incorporating advanced materials and technologies. Pump application innovations include the use of renewable energy sources and the integration of smart technologies. Pump distribution channels have expanded to include e-commerce platforms and digital marketplaces. Pump technology advancements, such as variable speed drives and energy recovery systems, contribute to improved efficiency and sustainability. Overall, the market is dynamic, with ongoing developments in materials, manufacturing processes, and application innovations shaping its future.
Dive into Technavio's robust research methodology, blending expert interviews, extensive data synthesis, and validated models for unparalleled Industrial Pumps Market insights. See full methodology.
|
Market Scope |
|
|
Report Coverage |
Details |
|
Page number |
137 |
|
Base year |
2023 |
|
Historic period |
2018-2022 |
|
Forecast period |
2024-2028 |
|
Growth momentum & CAGR |
Accelerate at a CAGR of 5.2% |
|
Market growth 2024-2028 |
USD 17.4 billion |
|
Market structure |
Fragmented |
|
YoY growth 2023-2024(%) |
4.9 |
|
Key countries |
China, US, Japan, Russia, and UK |
|
Competitive landscape |
Leading Companies, Market Positioning of Companies, Competitive Strategies, and Industry Risks |
What are the Key Data Covered in this Industrial Pumps Market Research and Growth Report?
- CAGR of the Industrial Pumps industry during the forecast period
- Detailed information on factors that will drive the growth and forecasting between 2024 and 2028
- Precise estimation of the size of the market and its contribution of the industry in focus to the parent market
- Accurate predictions about upcoming growth and trends and changes in consumer behaviour
- Growth of the market across APAC, Europe, North America, South America, and Middle East and Africa
- Thorough analysis of the market's competitive landscape and detailed information about companies
- Comprehensive analysis of factors that will challenge the industrial pumps market growth of industry companies
We can help! Our analysts can customize this industrial pumps market research report to meet your requirements.


