Industrial Relays Market Analysis, Size, and Forecast 2026-2030: APAC (China, Japan, and India), North America (US, Canada, and Mexico), Europe (Germany, UK, and France), Middle East and Africa (Saudi Arabia, UAE, and South Africa), South America (Brazil and Argentina), and Rest of World (ROW)

Industrial Relays Market Analysis, Size, and Forecast 2026-2030:
APAC (China, Japan, and India), North America (US, Canada, and Mexico), Europe (Germany, UK, and France), Middle East and Africa (Saudi Arabia, UAE, and South Africa), South America (Brazil and Argentina), and Rest of World (ROW)

Published: May 2026 332 Pages SKU: IRTNTR43765

Market Overview at a Glance

$1.24 B
Market Opportunity
5.1%
CAGR 2025 - 2030
41.4%
APAC Growth
$1.44 B
Electromechanical relays segment 2024

Industrial Relays Market Size 2026-2030

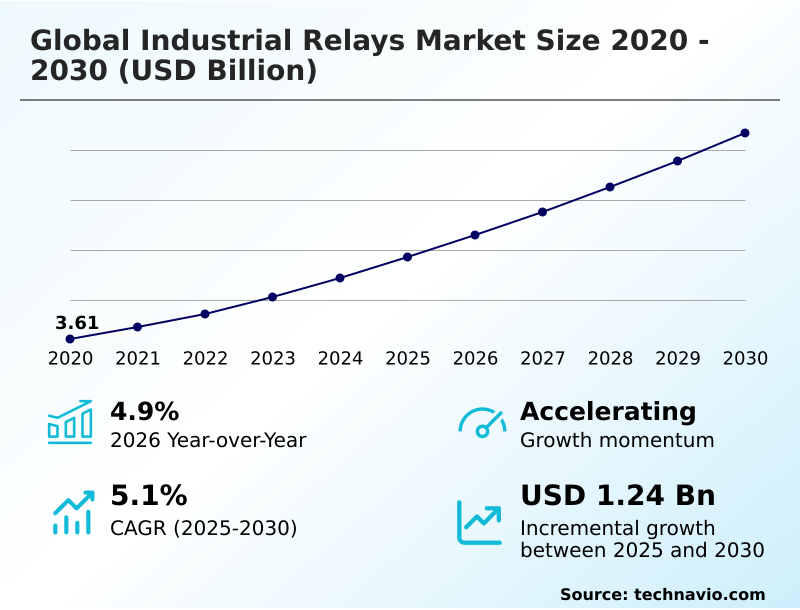
The industrial relays market size is valued to increase by USD 1.24 billion, at a CAGR of 5.1% from 2025 to 2030. Proliferation of industrial automation and smart manufacturing will drive the industrial relays market.

Major Market Trends & Insights

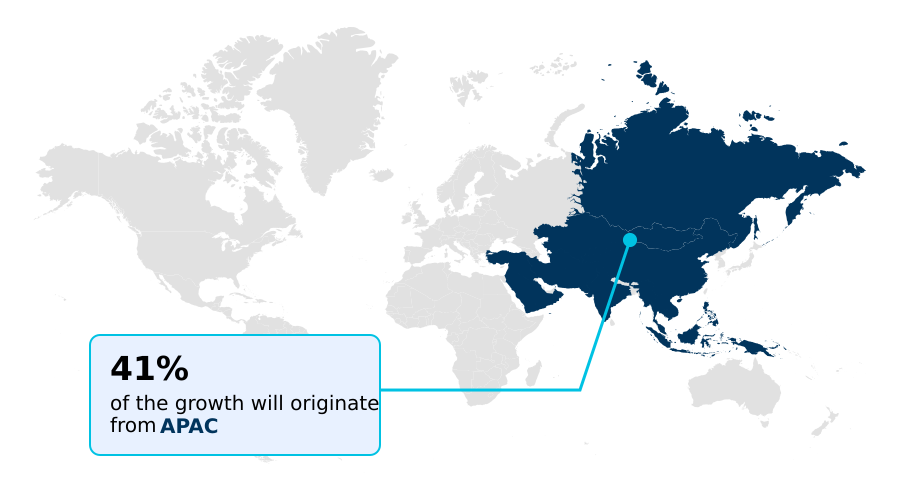
  • APAC dominated the market and accounted for a 41.4% growth during the forecast period.
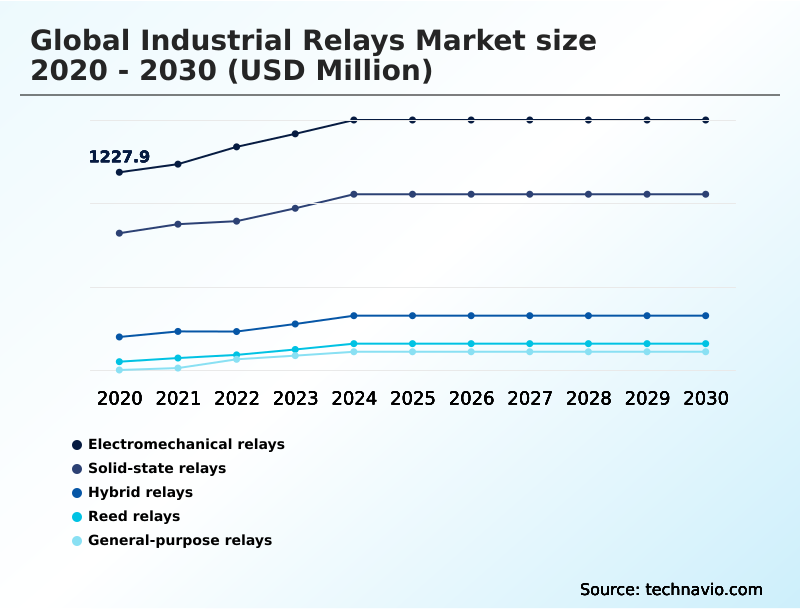
  • By Product - Electromechanical relays segment was valued at USD 1.44 billion in 2024
  • By End-user - Process industries segment accounted for the largest market revenue share in 2024

Market Size & Forecast

  • Market Opportunities: USD 2.06 billion
  • Market Future Opportunities: USD 1.24 billion
  • CAGR from 2025 to 2030 : 5.1%

Market Summary

  • The industrial relays market is integral to modern electrical control and automation systems. These devices, ranging from electromechanical relays to advanced solid-state relays, are fundamental for ensuring operational safety and efficiency in high-power environments.
  • Key drivers include the global push for industrial automation and the modernization of energy grids, which demand more sophisticated components like intelligent monitoring relays and safety relay modules for protective relaying. A primary trend is the integration of communication protocols like IO-Link, enabling predictive maintenance and reducing downtime.
  • For instance, a manufacturing facility can leverage smart relays to monitor motor health, predicting failures and scheduling maintenance to avoid disruptions that could halt production for hours. However, the market faces challenges from volatile raw material costs and the technical complexities of integrating with legacy systems.
  • The continuous innovation in materials and digital capabilities ensures relays remain critical for bridging low-power control signals with high-power industrial machinery.

What will be the Size of the Industrial Relays Market during the forecast period?

Get Key Insights on Market Forecast (PDF) Get Free Sample

How is the Industrial Relays Market Segmented?

The industrial relays industry research report provides comprehensive data (region-wise segment analysis), with forecasts and estimates in "USD million" for the period 2026-2030, as well as historical data from 2020-2024 for the following segments.

  • Product
    • Electromechanical relays
    • Solid-state relays
    • Hybrid relays
    • Reed relays
    • General-purpose relays
  • End-user
    • Process industries
    • Discrete industries
  • Power output
    • Low voltage relays
    • Medium voltage relays
    • High voltage relays
  • Application
    • Industrial automation
    • Electronics
    • Military
    • Others
  • Geography
    • APAC
      • China
      • Japan
      • India
    • North America
      • US
      • Canada
      • Mexico
    • Europe
      • Germany
      • UK
      • France
    • Middle East and Africa
      • Saudi Arabia
      • UAE
      • South Africa
    • South America
      • Brazil
      • Argentina
    • Rest of World (ROW)

By Product Insights

The electromechanical relays segment is estimated to witness significant growth during the forecast period.

The industrial relays market is defined by several key product categories, each designed for specific operational demands. Electromechanical relays provide essential physical isolation, making them invaluable for high-voltage applications and ensuring robust performance.

These devices are critical for managing bidirectional power flows and handling fault conditions, which is crucial for maintaining system integrity. In contrast, applications requiring agentic automation and advanced frequency regulation benefit from the precision of AI controllers.

The market also includes solutions designed for effective load balancing and the management of DC voltages. In advanced industrial settings, the integration of these components within lights-out factories is driven by the need for enhanced functional safety.

The use of smart sensing relays supports AI model training, creating virtual replicas to optimize processes and mitigate the risks associated with supply chain fragility.

This segmentation underscores the industry’s shift toward specialized, high-performance solutions where component selection can improve operational uptime by over 15%.

Get Free Sample

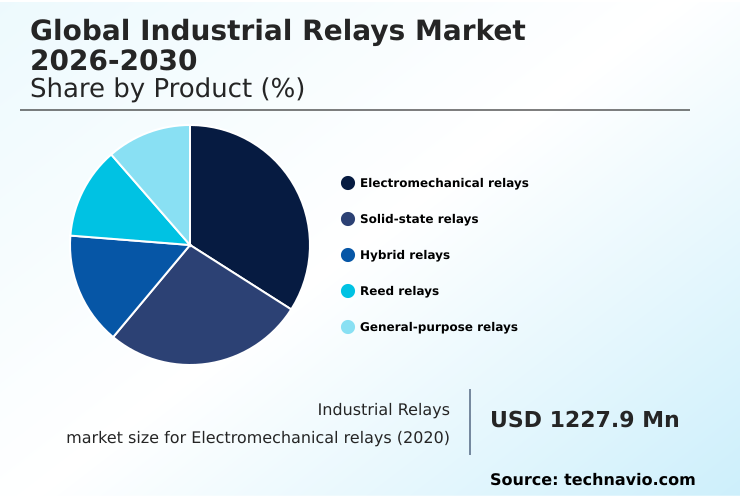
The Electromechanical relays segment was valued at USD 1.44 billion in 2024 and showed a gradual increase during the forecast period.

Get Free Sample

Regional Analysis

APAC is estimated to contribute 41.4% to the growth of the global market during the forecast period.Technavio’s analysts have elaborately explained the regional trends and drivers that shape the market during the forecast period.

See How Industrial Relays Market Demand is Rising in APAC Get Free Sample

The geographic landscape is increasingly influenced by the need for robust circuit protection and overcurrent protection in high-density digital infrastructures.

The development of next-generation systems is focused on managing high inrush currents and minimizing contact resistance to improve efficiency, with some achieving a 15% reduction in energy loss.

In advanced economies, the emphasis is on monitoring contact health and switching cycles through a communication-enabled architecture, allowing for proactive maintenance.

The rise of human-robot collaboration in manufacturing has intensified the need for reliable components that can handle voltage fluctuations without failure.

This is particularly relevant as facilities integrate supervisory control and data acquisition systems with large language models for process optimization.

Furthermore, the deployment of edge computing solutions in industrial settings has led to a 20% increase in the adoption of specialized components that ensure uninterrupted power and data integrity in distributed networks.

Market Dynamics

Our researchers analyzed the data with 2025 as the base year, along with the key drivers, trends, and challenges. A holistic analysis of drivers will help companies refine their marketing strategies to gain a competitive advantage.

  • Strategic decision-making in the industrial relays market increasingly revolves around specific, high-value applications. The selection of industrial relays for motor control is a primary consideration in factory automation, where reliability directly impacts production uptime. In parallel, the demand for solid-state relays for high-frequency switching is growing in electronics manufacturing and automated test equipment, where speed and precision are paramount.
  • As energy infrastructure modernizes, protective relays for grid stability and high voltage relays in transmission lines are critical for maintaining power quality. The integration of safety relays in human-robot collaboration is now a standard requirement for functional safety. Smart relays with IO-Link communication and other relays with integrated communication protocols are central to intelligent predictive maintenance strategies.
  • The market for hybrid relays for high-inrush current is expanding in heavy-duty applications. In building automation, low voltage relays in building automation are standard, while medium voltage relays for power distribution are key in industrial parks. Specialized components such as reed relays in automated test equipment and relays for hazardous environment applications fill important niches.
  • The growth of the digital economy fuels the need for industrial relays for data center power, while sustainability targets drive demand for relays in renewable energy storage and relays with low power consumption. This shift toward specialized applications has resulted in a market where niche segments grow at rates 5% higher than the general-purpose sector.
  • Finally, the rise of electric mobility creates a strong market for industrial relays for EV charging infrastructure, and the expansion of connected devices boosts the need for relays for industrial internet of things.

What are the key market drivers leading to the rise in the adoption of Industrial Relays Industry?

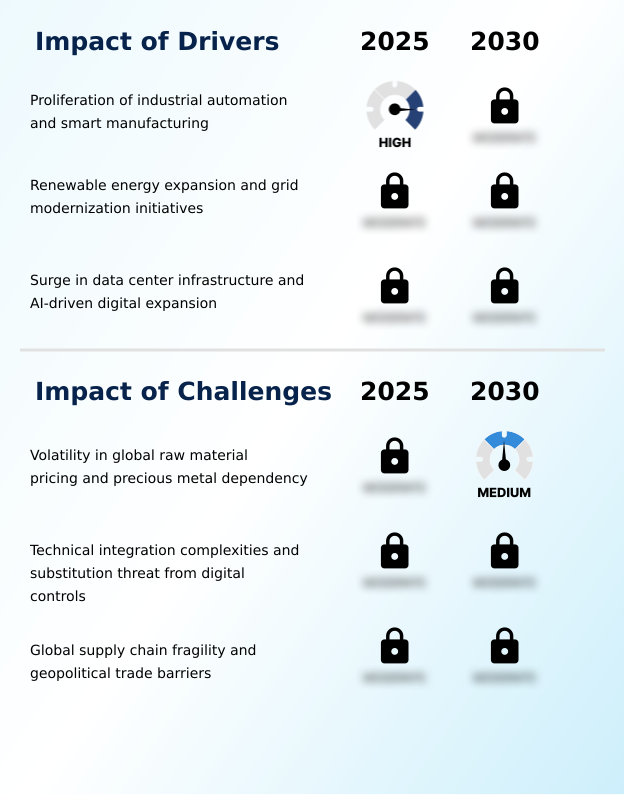
  • The proliferation of industrial automation and smart manufacturing frameworks is the key driver for the market.

  • The market is primarily driven by the expansion of industrial automation and critical infrastructure upgrades. The push for resilient operations has accelerated the adoption of smart relays and components supporting IO-Link communication, which are essential for modern manufacturing.
  • In the energy sector, grid modernization and renewable energy expansion are fueling demand for high voltage relays and advanced protective relaying for substation automation.
  • The integration of battery energy storage systems to support utility-scale solar projects and wind turbine control systems is a significant factor, with these projects improving grid stability by up to 30%.
  • Furthermore, these initiatives align with global decarbonization targets, creating a sustained need for reliable components. The adoption of these technologies has shown to decrease grid-related outages by 20% in certain modernized regions.

What are the market trends shaping the Industrial Relays Industry?

  • The evolution toward intelligent and communication-enabled relay architectures represents a key market trend. This shift is redefining the role of relays from simple switches to data-providing components in modern industrial systems.

  • Key trends are reshaping the market, with a clear shift toward intelligent components within the Industry 4.0 framework. The adoption of the industrial internet of things is driving demand for relays that offer more than basic switching.
  • Technologies such as electromechanical relays and solid-state relays are being enhanced with communication capabilities to support predictive maintenance, with some systems demonstrating a 25% reduction in unexpected failures. The use of hybrid relays, reed relays, and general-purpose relays is also evolving, particularly in low voltage and medium voltage applications.
  • This evolution supports smart manufacturing environments, where components in automated conveyor systems and collaborative robotics must provide real-time data. This integration has been shown to improve production line efficiency by over 15%, highlighting the tangible benefits of connected architectures.

What challenges does the Industrial Relays Industry face during its growth?

  • Volatility in global raw material pricing and dependency on precious metals present a key challenge affecting the industry's growth.

  • The market faces significant challenges related to component design and system integration in increasingly complex environments. The demand for advanced signal processing and reliable circuit interruption is pushing the limits of current technology. Ensuring robust motor protection and complete electrical isolation in compact formats is a primary concern, addressed by innovations like the solid-state latching relay and intelligent monitoring relays.
  • The integration into smart grids and the management of power conversion units require sophisticated solutions. For example, digital twin technology is being used to model and mitigate risks, improving system reliability by 18%.
  • The growth of hyperscale data centers and the electrification of transport are also creating new demands, while the development of AI-driven load management systems necessitates a new generation of safety relay modules.

Exclusive Technavio Analysis on Customer Landscape

The industrial relays market forecasting report includes the adoption lifecycle of the market, covering from the innovator’s stage to the laggard’s stage. It focuses on adoption rates in different regions based on penetration. Furthermore, the industrial relays market report also includes key purchase criteria and drivers of price sensitivity to help companies evaluate and develop their market growth analysis strategies.

Customer Landscape of Industrial Relays Industry

Competitive Landscape

Companies are implementing various strategies, such as strategic alliances, industrial relays market forecast, partnerships, mergers and acquisitions, geographical expansion, and product/service launches, to enhance their presence in the industry.

ABB Ltd. - Analysis indicates a portfolio of industrial relays, including interface, control, and specialized solid-state variants, designed for diverse automation and power management applications.

The industry research and growth report includes detailed analyses of the competitive landscape of the market and information about key companies, including:

  • ABB Ltd.
  • Carlo Gavazzi Holding AG
  • Crouzet
  • Eaton Corp. Plc
  • FINDER SpA
  • Fuji Electric Co. Ltd.
  • Honeywell International Inc.
  • IDEC Corp.
  • Littelfuse Inc.
  • Murrelektronik GmbH
  • OMRON Corp.
  • Panasonic Holdings Corp.
  • Phoenix Contact GmbH and Co
  • Rockwell Automation Inc.
  • Schneider Electric SE
  • Sensata Technologies Inc.
  • Siemens AG
  • TE Connectivity plc
  • WAGO GmbH and Co. KG
  • Weidmuller GmbH and Co. KG

Qualitative and quantitative analysis of companies has been conducted to help clients understand the wider business environment as well as the strengths and weaknesses of key industry players. Data is qualitatively analyzed to categorize companies as pure play, category-focused, industry-focused, and diversified; it is quantitatively analyzed to categorize companies as dominant, leading, strong, tentative, and weak.

Recent Development and News in Industrial relays market

  • In February 2025, Phoenix Contact announced the launch of a new safety relay module, the PSR-MM25, engineered for reliable monitoring and shutdown functions in hazardous areas, meeting strict international safety and explosion-protection standards for industries such as oil and gas, chemicals, and mining.
  • In February 2025, Phoenix Contact introduced a new network-capable PLC-INTERFACE Ethernet gateway, designed for the remote monitoring and control of relay systems. This gateway enables centralized diagnostics and predictive maintenance by allowing users to manage relay modules over Ethernet networks.
  • In May 2025, Littelfuse expanded its industrial solid-state relay portfolio with new single-pole AC and DC models. The SRP1-CC, SRP1-CE, and SRP1-ME series were developed to offer cost-effective switching for resistive and inductive loads, targeting applications in industrial, HVAC, and food equipment.
  • In November 2025, Littelfuse Inc. introduced a new solid-state latching relay designed for zero-power operation in compact packages, emphasizing the industry-wide move toward energy-efficient and durable switching solutions for applications where space and reliability are critical.

Dive into Technavio’s robust research methodology, blending expert interviews, extensive data synthesis, and validated models for unparalleled Industrial Relays Market insights. See full methodology.

Market Scope
Page number 332
Base year 2025
Historic period 2020-2024
Forecast period 2026-2030
Growth momentum & CAGR Accelerate at a CAGR of 5.1%
Market growth 2026-2030 USD 1242.1 million
Market structure Fragmented
YoY growth 2025-2026(%) 4.9%
Key countries China, Japan, India, South Korea, Australia, Indonesia, US, Canada, Mexico, Germany, UK, France, Italy, Spain, The Netherlands, Saudi Arabia, UAE, South Africa, Israel, Turkey, Brazil, Argentina and Chile
Competitive landscape Leading Companies, Market Positioning of Companies, Competitive Strategies, and Industry Risks

Request Free Sample

Research Analyst Overview

  • The industrial relays market is undergoing a significant transformation driven by the dual imperatives of industrial automation and energy infrastructure modernization. The core of this market is segmented into key technologies such as electromechanical relays, solid-state relays, hybrid relays, reed relays, and general-purpose relays, each serving distinct application needs from low voltage to high voltage systems.
  • In boardroom decisions, the focus is shifting toward lifecycle cost over initial price, with an emphasis on components that support predictive maintenance strategies. The integration of smart relays with IO-Link communication allows for real-time monitoring of contact health and switching cycles, which can reduce unplanned downtime by up to 30%.
  • Key applications such as motor protection and circuit interruption are enhanced by intelligent monitoring relays and specialized safety relay modules. The expansion into substation automation and battery energy storage systems requires advanced protective relaying to manage bidirectional power flows and fault conditions.
  • These systems must handle high inrush currents, DC voltages, and ensure electrical isolation, all while contributing to load balancing and frequency regulation in smart grids. This evolution is driven by the need for reliable signal processing and overcurrent protection in an increasingly connected and automated industrial landscape.

What are the Key Data Covered in this Industrial Relays Market Research and Growth Report?

  • What is the expected growth of the Industrial Relays Market between 2026 and 2030?

    • USD 1.24 billion, at a CAGR of 5.1%

  • What segmentation does the market report cover?

    • The report is segmented by Product (Electromechanical relays, Solid-state relays, Hybrid relays, Reed relays, and General-purpose relays), End-user (Process industries, and Discrete industries), Power Output (Low voltage relays, Medium voltage relays, and High voltage relays), Application (Industrial automation, Electronics, Military, and Others) and Geography (APAC, North America, Europe, Middle East and Africa, South America)

  • Which regions are analyzed in the report?

    • APAC, North America, Europe, Middle East and Africa and South America

  • What are the key growth drivers and market challenges?

    • Proliferation of industrial automation and smart manufacturing, Volatility in global raw material pricing and precious metal dependency

  • Who are the major players in the Industrial Relays Market?

    • ABB Ltd., Carlo Gavazzi Holding AG, Crouzet, Eaton Corp. Plc, FINDER SpA, Fuji Electric Co. Ltd., Honeywell International Inc., IDEC Corp., Littelfuse Inc., Murrelektronik GmbH, OMRON Corp., Panasonic Holdings Corp., Phoenix Contact GmbH and Co, Rockwell Automation Inc., Schneider Electric SE, Sensata Technologies Inc., Siemens AG, TE Connectivity plc, WAGO GmbH and Co. KG and Weidmuller GmbH and Co. KG

Market Research Insights

  • Market dynamics are shaped by a strategic focus on resilient operations and the expansion of smart grids, which collectively improve system stability by over 25%. The adoption of a communication-enabled architecture is central to the Industry 4.0 framework, where predictive maintenance strategies reduce equipment failure rates by up to 40%.
  • The ongoing grid modernization, driven by decarbonization targets, and the electrification of transport are creating new demand verticals. Concurrently, the growth of hyperscale data centers to support large language models and edge computing is accelerating. These facilities demand highly reliable power management solutions, favoring green data centers that align with sustainability goals.
  • The use of digital twin technology allows for the creation of virtual replicas, enhancing system design and performance before deployment.

We can help! Our analysts can customize this industrial relays market research report to meet your requirements.

Get in touch

1. Executive Summary

1.1 Market overview

Executive Summary - Chart on Market Overview
Executive Summary - Data Table on Market Overview
Executive Summary - Chart on Global Market Characteristics
Executive Summary - Chart on Market by Geography
Executive Summary - Chart on Market Segmentation by Product
Executive Summary - Chart on Market Segmentation by End-user
Executive Summary - Chart on Market Segmentation by Power Output
Executive Summary - Chart on Market Segmentation by Application
Executive Summary - Chart on Incremental Growth
Executive Summary - Data Table on Incremental Growth
Executive Summary - Chart on Company Market Positioning

2. Technavio Analysis

2.1 Analysis of price sensitivity, lifecycle, customer purchase basket, adoption rates, and purchase criteria

2.2 Criticality of inputs and Factors of differentiation

Chart on Overview on criticality of inputs and factors of differentiation

2.3 Factors of disruption

Chart on Overview on factors of disruption

2.4 Impact of drivers and challenges

Chart on Impact of drivers and challenges in 2025 and 2030

3. Market Landscape

3.1 Market ecosystem

Chart on Parent Market
Data Table on - Parent Market

3.2 Market characteristics

Chart on Market characteristics analysis

3.3 Value chain analysis

Chart on Value chain analysis

4. Market Sizing

4.1 Market definition

Data Table on Offerings of companies included in the market definition

4.2 Market segment analysis

Market segments

4.3 Market size 2025

4.4 Market outlook: Forecast for 2025-2030

Chart on Global - Market size and forecast 2025-2030 ($ million)
Data Table on Global - Market size and forecast 2025-2030 ($ million)
Chart on Global Market: Year-over-year growth 2025-2030 (%)
Data Table on Global Market: Year-over-year growth 2025-2030 (%)

5. Historic Market Size

5.1 Global Industrial Relays Market 2020 - 2024

Historic Market Size - Data Table on Global Industrial Relays Market 2020 - 2024 ($ million)

5.2 Product segment analysis 2020 - 2024

Historic Market Size - Product Segment 2020 - 2024 ($ million)

5.3 End-user segment analysis 2020 - 2024

Historic Market Size - End-user Segment 2020 - 2024 ($ million)

5.4 Power Output segment analysis 2020 - 2024

Historic Market Size - Power Output Segment 2020 - 2024 ($ million)

5.5 Application segment analysis 2020 - 2024

Historic Market Size - Application Segment 2020 - 2024 ($ million)

5.6 Geography segment analysis 2020 - 2024

Historic Market Size - Geography Segment 2020 - 2024 ($ million)

5.7 Country segment analysis 2020 - 2024

Historic Market Size - Country Segment 2020 - 2024 ($ million)

6. Qualitative Analysis

6.1 Impact of AI on global industrial relays market

6.2 Impact of geopolitical conflicts on global industrial relays market

7. Five Forces Analysis

7.1 Five forces summary

Five forces analysis - Comparison between 2025 and 2030

7.2 Bargaining power of buyers

Bargaining power of buyers - Impact of key factors 2025 and 2030

7.3 Bargaining power of suppliers

Bargaining power of suppliers - Impact of key factors in 2025 and 2030

7.4 Threat of new entrants

Threat of new entrants - Impact of key factors in 2025 and 2030

7.5 Threat of substitutes

Threat of substitutes - Impact of key factors in 2025 and 2030

7.6 Threat of rivalry

Threat of rivalry - Impact of key factors in 2025 and 2030

7.7 Market condition

Chart on Market condition - Five forces 2025 and 2030

8. Market Segmentation by Product

8.1 Market segments

Chart on Product - Market share 2025-2030 (%)
Data Table on Product - Market share 2025-2030 (%)

8.2 Comparison by Product

Chart on Comparison by Product
Data Table on Comparison by Product

8.3 Electromechanical relays - Market size and forecast 2025-2030

Chart on Electromechanical relays - Market size and forecast 2025-2030 ($ million)
Data Table on Electromechanical relays - Market size and forecast 2025-2030 ($ million)
Chart on Electromechanical relays - Year-over-year growth 2025-2030 (%)
Data Table on Electromechanical relays - Year-over-year growth 2025-2030 (%)

8.4 Solid-state relays - Market size and forecast 2025-2030

Chart on Solid-state relays - Market size and forecast 2025-2030 ($ million)
Data Table on Solid-state relays - Market size and forecast 2025-2030 ($ million)
Chart on Solid-state relays - Year-over-year growth 2025-2030 (%)
Data Table on Solid-state relays - Year-over-year growth 2025-2030 (%)

8.5 Hybrid relays - Market size and forecast 2025-2030

Chart on Hybrid relays - Market size and forecast 2025-2030 ($ million)
Data Table on Hybrid relays - Market size and forecast 2025-2030 ($ million)
Chart on Hybrid relays - Year-over-year growth 2025-2030 (%)
Data Table on Hybrid relays - Year-over-year growth 2025-2030 (%)

8.6 Reed relays - Market size and forecast 2025-2030

Chart on Reed relays - Market size and forecast 2025-2030 ($ million)
Data Table on Reed relays - Market size and forecast 2025-2030 ($ million)
Chart on Reed relays - Year-over-year growth 2025-2030 (%)
Data Table on Reed relays - Year-over-year growth 2025-2030 (%)

8.7 General-purpose relays - Market size and forecast 2025-2030

Chart on General-purpose relays - Market size and forecast 2025-2030 ($ million)
Data Table on General-purpose relays - Market size and forecast 2025-2030 ($ million)
Chart on General-purpose relays - Year-over-year growth 2025-2030 (%)
Data Table on General-purpose relays - Year-over-year growth 2025-2030 (%)

8.8 Market opportunity by Product

Market opportunity by Product ($ million)
Data Table on Market opportunity by Product ($ million)

9. Market Segmentation by End-user

9.1 Market segments

Chart on End-user - Market share 2025-2030 (%)
Data Table on End-user - Market share 2025-2030 (%)

9.2 Comparison by End-user

Chart on Comparison by End-user
Data Table on Comparison by End-user

9.3 Process industries - Market size and forecast 2025-2030

Chart on Process industries - Market size and forecast 2025-2030 ($ million)
Data Table on Process industries - Market size and forecast 2025-2030 ($ million)
Chart on Process industries - Year-over-year growth 2025-2030 (%)
Data Table on Process industries - Year-over-year growth 2025-2030 (%)

9.4 Discrete industries - Market size and forecast 2025-2030

Chart on Discrete industries - Market size and forecast 2025-2030 ($ million)
Data Table on Discrete industries - Market size and forecast 2025-2030 ($ million)
Chart on Discrete industries - Year-over-year growth 2025-2030 (%)
Data Table on Discrete industries - Year-over-year growth 2025-2030 (%)

9.5 Market opportunity by End-user

Market opportunity by End-user ($ million)
Data Table on Market opportunity by End-user ($ million)

10. Market Segmentation by Power Output

10.1 Market segments

Chart on Power Output - Market share 2025-2030 (%)
Data Table on Power Output - Market share 2025-2030 (%)

10.2 Comparison by Power Output

Chart on Comparison by Power Output
Data Table on Comparison by Power Output

10.3 Low voltage relays - Market size and forecast 2025-2030

Chart on Low voltage relays - Market size and forecast 2025-2030 ($ million)
Data Table on Low voltage relays - Market size and forecast 2025-2030 ($ million)
Chart on Low voltage relays - Year-over-year growth 2025-2030 (%)
Data Table on Low voltage relays - Year-over-year growth 2025-2030 (%)

10.4 Medium voltage relays - Market size and forecast 2025-2030

Chart on Medium voltage relays - Market size and forecast 2025-2030 ($ million)
Data Table on Medium voltage relays - Market size and forecast 2025-2030 ($ million)
Chart on Medium voltage relays - Year-over-year growth 2025-2030 (%)
Data Table on Medium voltage relays - Year-over-year growth 2025-2030 (%)

10.5 High voltage relays - Market size and forecast 2025-2030

Chart on High voltage relays - Market size and forecast 2025-2030 ($ million)
Data Table on High voltage relays - Market size and forecast 2025-2030 ($ million)
Chart on High voltage relays - Year-over-year growth 2025-2030 (%)
Data Table on High voltage relays - Year-over-year growth 2025-2030 (%)

10.6 Market opportunity by Power Output

Market opportunity by Power Output ($ million)
Data Table on Market opportunity by Power Output ($ million)

11. Market Segmentation by Application

11.1 Market segments

Chart on Application - Market share 2025-2030 (%)
Data Table on Application - Market share 2025-2030 (%)

11.2 Comparison by Application

Chart on Comparison by Application
Data Table on Comparison by Application

11.3 Industrial automation - Market size and forecast 2025-2030

Chart on Industrial automation - Market size and forecast 2025-2030 ($ million)
Data Table on Industrial automation - Market size and forecast 2025-2030 ($ million)
Chart on Industrial automation - Year-over-year growth 2025-2030 (%)
Data Table on Industrial automation - Year-over-year growth 2025-2030 (%)

11.4 Electronics - Market size and forecast 2025-2030

Chart on Electronics - Market size and forecast 2025-2030 ($ million)
Data Table on Electronics - Market size and forecast 2025-2030 ($ million)
Chart on Electronics - Year-over-year growth 2025-2030 (%)
Data Table on Electronics - Year-over-year growth 2025-2030 (%)

11.5 Military - Market size and forecast 2025-2030

Chart on Military - Market size and forecast 2025-2030 ($ million)
Data Table on Military - Market size and forecast 2025-2030 ($ million)
Chart on Military - Year-over-year growth 2025-2030 (%)
Data Table on Military - Year-over-year growth 2025-2030 (%)

11.6 Others - Market size and forecast 2025-2030

Chart on Others - Market size and forecast 2025-2030 ($ million)
Data Table on Others - Market size and forecast 2025-2030 ($ million)
Chart on Others - Year-over-year growth 2025-2030 (%)
Data Table on Others - Year-over-year growth 2025-2030 (%)

11.7 Market opportunity by Application

Market opportunity by Application ($ million)
Data Table on Market opportunity by Application ($ million)

12. Customer Landscape

12.1 Customer landscape overview

Analysis of price sensitivity, lifecycle, customer purchase basket, adoption rates, and purchase criteria

13. Geographic Landscape

13.1 Geographic segmentation

Chart on Market share by geography 2025-2030 (%)
Data Table on Market share by geography 2025-2030 (%)

13.2 Geographic comparison

Chart on Geographic comparison
Data Table on Geographic comparison

13.3 APAC - Market size and forecast 2025-2030

Chart on APAC - Market size and forecast 2025-2030 ($ million)
Data Table on APAC - Market size and forecast 2025-2030 ($ million)
Chart on APAC - Year-over-year growth 2025-2030 (%)
Data Table on APAC - Year-over-year growth 2025-2030 (%)
Chart on Regional Comparison - APAC
Data Table on Regional Comparison - APAC

13.3.1 China - Market size and forecast 2025-2030

Chart on China - Market size and forecast 2025-2030 ($ million)
Data Table on China - Market size and forecast 2025-2030 ($ million)
Chart on China - Year-over-year growth 2025-2030 (%)
Data Table on China - Year-over-year growth 2025-2030 (%)

13.3.2 Japan - Market size and forecast 2025-2030

Chart on Japan - Market size and forecast 2025-2030 ($ million)
Data Table on Japan - Market size and forecast 2025-2030 ($ million)
Chart on Japan - Year-over-year growth 2025-2030 (%)
Data Table on Japan - Year-over-year growth 2025-2030 (%)

13.3.3 India - Market size and forecast 2025-2030

Chart on India - Market size and forecast 2025-2030 ($ million)
Data Table on India - Market size and forecast 2025-2030 ($ million)
Chart on India - Year-over-year growth 2025-2030 (%)
Data Table on India - Year-over-year growth 2025-2030 (%)

13.3.4 South Korea - Market size and forecast 2025-2030

Chart on South Korea - Market size and forecast 2025-2030 ($ million)
Data Table on South Korea - Market size and forecast 2025-2030 ($ million)
Chart on South Korea - Year-over-year growth 2025-2030 (%)
Data Table on South Korea - Year-over-year growth 2025-2030 (%)

13.3.5 Australia - Market size and forecast 2025-2030

Chart on Australia - Market size and forecast 2025-2030 ($ million)
Data Table on Australia - Market size and forecast 2025-2030 ($ million)
Chart on Australia - Year-over-year growth 2025-2030 (%)
Data Table on Australia - Year-over-year growth 2025-2030 (%)

13.3.6 Indonesia - Market size and forecast 2025-2030

Chart on Indonesia - Market size and forecast 2025-2030 ($ million)
Data Table on Indonesia - Market size and forecast 2025-2030 ($ million)
Chart on Indonesia - Year-over-year growth 2025-2030 (%)
Data Table on Indonesia - Year-over-year growth 2025-2030 (%)

13.4 North America - Market size and forecast 2025-2030

Chart on North America - Market size and forecast 2025-2030 ($ million)
Data Table on North America - Market size and forecast 2025-2030 ($ million)
Chart on North America - Year-over-year growth 2025-2030 (%)
Data Table on North America - Year-over-year growth 2025-2030 (%)
Chart on Regional Comparison - North America
Data Table on Regional Comparison - North America

13.4.1 US - Market size and forecast 2025-2030

Chart on US - Market size and forecast 2025-2030 ($ million)
Data Table on US - Market size and forecast 2025-2030 ($ million)
Chart on US - Year-over-year growth 2025-2030 (%)
Data Table on US - Year-over-year growth 2025-2030 (%)

13.4.2 Canada - Market size and forecast 2025-2030

Chart on Canada - Market size and forecast 2025-2030 ($ million)
Data Table on Canada - Market size and forecast 2025-2030 ($ million)
Chart on Canada - Year-over-year growth 2025-2030 (%)
Data Table on Canada - Year-over-year growth 2025-2030 (%)

13.4.3 Mexico - Market size and forecast 2025-2030

Chart on Mexico - Market size and forecast 2025-2030 ($ million)
Data Table on Mexico - Market size and forecast 2025-2030 ($ million)
Chart on Mexico - Year-over-year growth 2025-2030 (%)
Data Table on Mexico - Year-over-year growth 2025-2030 (%)

13.5 Europe - Market size and forecast 2025-2030

Chart on Europe - Market size and forecast 2025-2030 ($ million)
Data Table on Europe - Market size and forecast 2025-2030 ($ million)
Chart on Europe - Year-over-year growth 2025-2030 (%)
Data Table on Europe - Year-over-year growth 2025-2030 (%)
Chart on Regional Comparison - Europe
Data Table on Regional Comparison - Europe

13.5.1 Germany - Market size and forecast 2025-2030

Chart on Germany - Market size and forecast 2025-2030 ($ million)
Data Table on Germany - Market size and forecast 2025-2030 ($ million)
Chart on Germany - Year-over-year growth 2025-2030 (%)
Data Table on Germany - Year-over-year growth 2025-2030 (%)

13.5.2 UK - Market size and forecast 2025-2030

Chart on UK - Market size and forecast 2025-2030 ($ million)
Data Table on UK - Market size and forecast 2025-2030 ($ million)
Chart on UK - Year-over-year growth 2025-2030 (%)
Data Table on UK - Year-over-year growth 2025-2030 (%)

13.5.3 France - Market size and forecast 2025-2030

Chart on France - Market size and forecast 2025-2030 ($ million)
Data Table on France - Market size and forecast 2025-2030 ($ million)
Chart on France - Year-over-year growth 2025-2030 (%)
Data Table on France - Year-over-year growth 2025-2030 (%)

13.5.4 Italy - Market size and forecast 2025-2030

Chart on Italy - Market size and forecast 2025-2030 ($ million)
Data Table on Italy - Market size and forecast 2025-2030 ($ million)
Chart on Italy - Year-over-year growth 2025-2030 (%)
Data Table on Italy - Year-over-year growth 2025-2030 (%)

13.5.5 Spain - Market size and forecast 2025-2030

Chart on Spain - Market size and forecast 2025-2030 ($ million)
Data Table on Spain - Market size and forecast 2025-2030 ($ million)
Chart on Spain - Year-over-year growth 2025-2030 (%)
Data Table on Spain - Year-over-year growth 2025-2030 (%)

13.5.6 The Netherlands - Market size and forecast 2025-2030

Chart on The Netherlands - Market size and forecast 2025-2030 ($ million)
Data Table on The Netherlands - Market size and forecast 2025-2030 ($ million)
Chart on The Netherlands - Year-over-year growth 2025-2030 (%)
Data Table on The Netherlands - Year-over-year growth 2025-2030 (%)

13.6 Middle East and Africa - Market size and forecast 2025-2030

Chart on Middle East and Africa - Market size and forecast 2025-2030 ($ million)
Data Table on Middle East and Africa - Market size and forecast 2025-2030 ($ million)
Chart on Middle East and Africa - Year-over-year growth 2025-2030 (%)
Data Table on Middle East and Africa - Year-over-year growth 2025-2030 (%)
Chart on Regional Comparison - Middle East and Africa
Data Table on Regional Comparison - Middle East and Africa

13.6.1 Saudi Arabia - Market size and forecast 2025-2030

Chart on Saudi Arabia - Market size and forecast 2025-2030 ($ million)
Data Table on Saudi Arabia - Market size and forecast 2025-2030 ($ million)
Chart on Saudi Arabia - Year-over-year growth 2025-2030 (%)
Data Table on Saudi Arabia - Year-over-year growth 2025-2030 (%)

13.6.2 UAE - Market size and forecast 2025-2030

Chart on UAE - Market size and forecast 2025-2030 ($ million)
Data Table on UAE - Market size and forecast 2025-2030 ($ million)
Chart on UAE - Year-over-year growth 2025-2030 (%)
Data Table on UAE - Year-over-year growth 2025-2030 (%)

13.6.3 South Africa - Market size and forecast 2025-2030

Chart on South Africa - Market size and forecast 2025-2030 ($ million)
Data Table on South Africa - Market size and forecast 2025-2030 ($ million)
Chart on South Africa - Year-over-year growth 2025-2030 (%)
Data Table on South Africa - Year-over-year growth 2025-2030 (%)

13.6.4 Israel - Market size and forecast 2025-2030

Chart on Israel - Market size and forecast 2025-2030 ($ million)
Data Table on Israel - Market size and forecast 2025-2030 ($ million)
Chart on Israel - Year-over-year growth 2025-2030 (%)
Data Table on Israel - Year-over-year growth 2025-2030 (%)

13.6.5 Turkey - Market size and forecast 2025-2030

Chart on Turkey - Market size and forecast 2025-2030 ($ million)
Data Table on Turkey - Market size and forecast 2025-2030 ($ million)
Chart on Turkey - Year-over-year growth 2025-2030 (%)
Data Table on Turkey - Year-over-year growth 2025-2030 (%)

13.7 South America - Market size and forecast 2025-2030

Chart on South America - Market size and forecast 2025-2030 ($ million)
Data Table on South America - Market size and forecast 2025-2030 ($ million)
Chart on South America - Year-over-year growth 2025-2030 (%)
Data Table on South America - Year-over-year growth 2025-2030 (%)
Chart on Regional Comparison - South America
Data Table on Regional Comparison - South America

13.7.1 Brazil - Market size and forecast 2025-2030

Chart on Brazil - Market size and forecast 2025-2030 ($ million)
Data Table on Brazil - Market size and forecast 2025-2030 ($ million)
Chart on Brazil - Year-over-year growth 2025-2030 (%)
Data Table on Brazil - Year-over-year growth 2025-2030 (%)

13.7.2 Argentina - Market size and forecast 2025-2030

Chart on Argentina - Market size and forecast 2025-2030 ($ million)
Data Table on Argentina - Market size and forecast 2025-2030 ($ million)
Chart on Argentina - Year-over-year growth 2025-2030 (%)
Data Table on Argentina - Year-over-year growth 2025-2030 (%)

13.7.3 Chile - Market size and forecast 2025-2030

Chart on Chile - Market size and forecast 2025-2030 ($ million)
Data Table on Chile - Market size and forecast 2025-2030 ($ million)
Chart on Chile - Year-over-year growth 2025-2030 (%)
Data Table on Chile - Year-over-year growth 2025-2030 (%)

13.8 Market opportunity by geography

Market opportunity by geography ($ million)
Data Tables on Market opportunity by geography ($ million)

14. Drivers, Challenges, and Opportunity

14.1 Market drivers

Proliferation of industrial automation and smart manufacturing
Renewable energy expansion and grid modernization initiatives
Surge in data center infrastructure and AI-driven digital expansion

14.2 Market challenges

Volatility in global raw material pricing and precious metal dependency
Technical integration complexities and substitution threat from digital controls
Global supply chain fragility and geopolitical trade barriers

14.3 Impact of drivers and challenges

Impact of drivers and challenges in 2025 and 2030

14.4 Market opportunities

Evolution of intelligent and communication-enabled relay architectures
Grid modernization and integration of renewable energy storage systems
Proliferation of AI and agentic automation

15. Competitive Landscape

15.1 Overview

15.2

Overview on criticality of inputs and factors of differentiation

15.3 Landscape disruption

Overview on factors of disruption

15.4 Industry risks

Impact of key risks on business

16. Competitive Analysis

16.1 Companies profiled

Companies covered

16.2 Company ranking index

16.3 Market positioning of companies

Matrix on companies position and classification

16.4 ABB Ltd.

ABB Ltd. - Overview
ABB Ltd. - Business segments
ABB Ltd. - Key news
ABB Ltd. - Key offerings
ABB Ltd. - Segment focus
SWOT

16.5 Eaton Corp. Plc

Eaton Corp. Plc - Overview
Eaton Corp. Plc - Business segments
Eaton Corp. Plc - Key news
Eaton Corp. Plc - Key offerings
Eaton Corp. Plc - Segment focus
SWOT

16.6 Fuji Electric Co. Ltd.

Fuji Electric Co. Ltd. - Overview
Fuji Electric Co. Ltd. - Business segments
Fuji Electric Co. Ltd. - Key offerings
Fuji Electric Co. Ltd. - Segment focus
SWOT

16.7 Honeywell International Inc.

Honeywell International Inc. - Overview
Honeywell International Inc. - Business segments
Honeywell International Inc. - Key news
Honeywell International Inc. - Key offerings
Honeywell International Inc. - Segment focus
SWOT

16.8 IDEC Corp.

IDEC Corp. - Overview
IDEC Corp. - Business segments
IDEC Corp. - Key offerings
IDEC Corp. - Segment focus
SWOT

16.9 Murrelektronik GmbH

Murrelektronik GmbH - Overview
Murrelektronik GmbH - Product / Service
Murrelektronik GmbH - Key offerings
SWOT

16.10 OMRON Corp.

OMRON Corp. - Overview
OMRON Corp. - Business segments
OMRON Corp. - Key offerings
OMRON Corp. - Segment focus
SWOT

16.11 Panasonic Holdings Corp.

Panasonic Holdings Corp. - Overview
Panasonic Holdings Corp. - Business segments
Panasonic Holdings Corp. - Key news
Panasonic Holdings Corp. - Key offerings
Panasonic Holdings Corp. - Segment focus
SWOT

16.12 Phoenix Contact GmbH and Co

Phoenix Contact GmbH and Co - Overview
Phoenix Contact GmbH and Co - Product / Service
Phoenix Contact GmbH and Co - Key offerings
SWOT

16.13 Rockwell Automation Inc.

Rockwell Automation Inc. - Overview
Rockwell Automation Inc. - Business segments
Rockwell Automation Inc. - Key news
Rockwell Automation Inc. - Key offerings
Rockwell Automation Inc. - Segment focus
SWOT

16.14 Schneider Electric SE

Schneider Electric SE - Overview
Schneider Electric SE - Business segments
Schneider Electric SE - Key news
Schneider Electric SE - Key offerings
Schneider Electric SE - Segment focus
SWOT

16.15 Sensata Technologies Inc.

Sensata Technologies Inc. - Overview
Sensata Technologies Inc. - Business segments
Sensata Technologies Inc. - Key offerings
Sensata Technologies Inc. - Segment focus
SWOT

16.16 Siemens AG

Siemens AG - Overview
Siemens AG - Business segments
Siemens AG - Key news
Siemens AG - Key offerings
Siemens AG - Segment focus
SWOT

16.17 TE Connectivity plc

TE Connectivity plc - Overview
TE Connectivity plc - Business segments
TE Connectivity plc - Key offerings
TE Connectivity plc - Segment focus
SWOT

16.18 Weidmuller GmbH and Co. KG

Weidmuller GmbH and Co. KG - Overview
Weidmuller GmbH and Co. KG - Product / Service
Weidmuller GmbH and Co. KG - Key offerings
SWOT

17. Appendix

17.1 Scope of the report

Market definition
Objectives
Notes and caveats

17.2 Inclusions and exclusions checklist

Inclusions checklist
Exclusions checklist

17.3 Currency conversion rates for US$

17.4 Research methodology

17.5 Data procurement

Information sources

17.6 Data validation

17.7 Validation techniques employed for market sizing

17.8 Data synthesis

17.9 360 degree market analysis

17.10 List of abbreviations

Research Methodology

Technavio presents a detailed picture of the market by way of study, synthesis, and summation of data from multiple sources. The analysts have presented the various facets of the market with a particular focus on identifying the key industry influencers. The data thus presented is comprehensive, reliable, and the result of extensive research, both primary and secondary.

INFORMATION SOURCES

Primary sources

  • Manufacturers and suppliers
  • Channel partners
  • Industry experts
  • Strategic decision makers

Secondary sources

  • Industry journals and periodicals
  • Government data
  • Financial reports of key industry players
  • Historical data
  • Press releases

DATA ANALYSIS

Data Synthesis

  • Collation of data
  • Estimation of key figures
  • Analysis of derived insights

Data Validation

  • Triangulation with data models
  • Reference against proprietary databases
  • Corroboration with industry experts

REPORT WRITING

Qualitative

  • Market drivers
  • Market challenges
  • Market trends
  • Five forces analysis

Quantitative

  • Market size and forecast
  • Market segmentation
  • Geographical insights
  • Competitive landscape

Interested in this report?

Get your sample now to see our research methodology and insights!

Download Now

Frequently Asked Questions

Industrial Relays market growth will increase by USD 1242.1 million during 2026-2030.

The Industrial Relays market is expected to grow at a CAGR of 5.1% during 2026-2030.

Industrial Relays market is segmented by Product (Electromechanical relays, Solid-state relays, Hybrid relays, Reed relays, General-purpose relays) End-user (Process industries, Discrete industries) Power output (Low voltage relays, Medium voltage relays, High voltage relays) Application (Industrial automation, Electronics, Military, Others)

ABB Ltd., Carlo Gavazzi Holding AG, Crouzet, Eaton Corp. Plc, FINDER SpA, Fuji Electric Co. Ltd., Honeywell International Inc., IDEC Corp., Littelfuse Inc., Murrelektronik GmbH, OMRON Corp., Panasonic Holdings Corp., Phoenix Contact GmbH and Co, Rockwell Automation Inc., Schneider Electric SE, Sensata Technologies Inc., Siemens AG, TE Connectivity plc, WAGO GmbH and Co. KG, Weidmuller GmbH and Co. KG are a few of the key vendors in the Industrial Relays market.

APAC will register the highest growth rate of 41.4% among the other regions. Therefore, the Industrial Relays market in APAC is expected to garner significant business opportunities for the vendors during the forecast period.

China, Japan, India, South Korea, Australia, Indonesia, US, Canada, Mexico, Germany, UK, France, Italy, Spain, The Netherlands, Saudi Arabia, UAE, South Africa, Israel, Turkey, Brazil, Argentina, Chile

  • Proliferation of industrial automation and smart manufacturing is the driving factor this market.

The Industrial Relays market vendors should focus on grabbing business opportunities from the Product segment as it accounted for the largest market share in the base year.
RIA - Research AI Assistant
Ask RIA