
Industrial Safety Gloves Market Analysis, Size, and Forecast 2026-2030: APAC (China, Japan, and India), North America (US, Canada, and Mexico), Europe (Germany, UK, and France), South America (Brazil, Argentina, and Chile), Middle East and Africa (Saudi Arabia, UAE, and South Africa), and Rest of World (ROW)

Industrial Safety Gloves Market Analysis, Size, and Forecast 2026-2030:
APAC (China, Japan, and India), North America (US, Canada, and Mexico), Europe (Germany, UK, and France), South America (Brazil, Argentina, and Chile), Middle East and Africa (Saudi Arabia, UAE, and South Africa), and Rest of World (ROW)

Published: Oct 2026 318 Pages SKU: IRTNTR74602

Market Overview at a Glance

$3.65 B
Market Opportunity
7.3%
CAGR 2025 - 2030
46.3%
APAC Growth
$2.84 B
Natural rubber gloves segment 2024

Industrial Safety Gloves Market Size 2026-2030

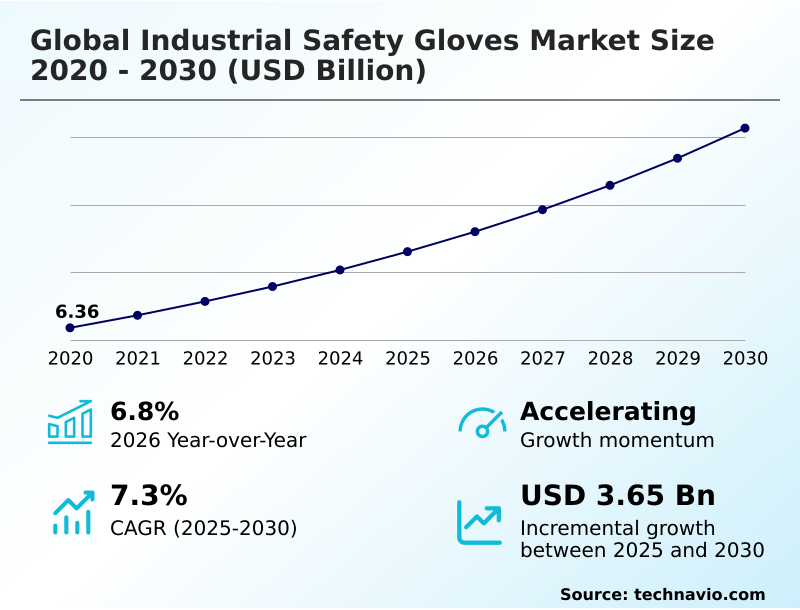
The industrial safety gloves market size is valued to increase by USD 3.65 billion, at a CAGR of 7.3% from 2025 to 2030. Increasing product innovations are driving market growth will drive the industrial safety gloves market.

Major Market Trends & Insights

  • APAC dominated the market and accounted for a 46.3% growth during the forecast period.
  • By Material - Natural rubber gloves segment was valued at USD 2.84 billion in 2024
  • By End-user - Manufacturing segment accounted for the largest market revenue share in 2024

Market Size & Forecast

  • Market Opportunities: USD 5.90 billion
  • Market Future Opportunities: USD 3.65 billion
  • CAGR from 2025 to 2030 : 7.3%

Market Summary

  • The Industrial Safety Gloves landscape exhibits consistent expansion as organizations prioritize stringent workplace compliance and advanced hazard mitigation. Manufacturing facilities implementing automated assembly lines rely heavily on specialized barrier protection to prevent mechanical injuries while maintaining dexterity.
  • For instance, logistics hubs that optimized their inventory deployment of cut-resistant handwear achieved a 14% reduction in lost-time incidents compared to previous quarters, directly enhancing supply chain continuity. This sector's momentum is primarily driven by continuous product innovation, which introduces lightweight, high-performance fibers that improve wearer compliance and reduce hand fatigue.
  • Conversely, the market faces structural constraints due to the volatile pricing of synthetic polymers and natural rubber. These raw material cost fluctuations compel manufacturers to frequently adjust pricing models, occasionally delaying procurement cycles for large-scale industrial buyers. Advanced protective solutions now integrate ergonomic designs with chemical resistance, addressing complex operational requirements simultaneously.
  • Consequently, enterprise procurement strategies increasingly favor durable, multi-use protective gear to offset initial capital expenditures and ensure long-term workforce safety.

What will be the Size of the Industrial Safety Gloves Market during the forecast period?
Get Key Insights on Market Forecast (PDF) Get Free Sample

How is the Industrial Safety Gloves Market Segmented?

The industrial safety gloves industry research report provides comprehensive data (region-wise segment analysis), with forecasts and estimates in "USD million" for the period 2026-2030, as well as historical data from 2020-2024 for the following segments.

  • Material
    • Natural rubber gloves
    • Vinyl gloves
    • Nitrile gloves
    • Neoprene gloves
    • Others
  • End-user
    • Manufacturing
    • Construction
    • Automotive
    • Oil and gas
    • Others
  • Product type
    • Re-usable gloves
    • Disposable gloves
  • Geography
    • APAC
      • China
      • Japan
      • India
      • South Korea
      • Australia
      • Indonesia
    • North America
      • US
      • Canada
      • Mexico
    • Europe
      • Germany
      • UK
      • France
      • Italy
      • Spain
      • The Netherlands
    • South America
      • Brazil
      • Argentina
      • Chile
    • Middle East and Africa
      • Saudi Arabia
      • UAE
      • South Africa
      • Israel
      • Turkey

By Material Insights

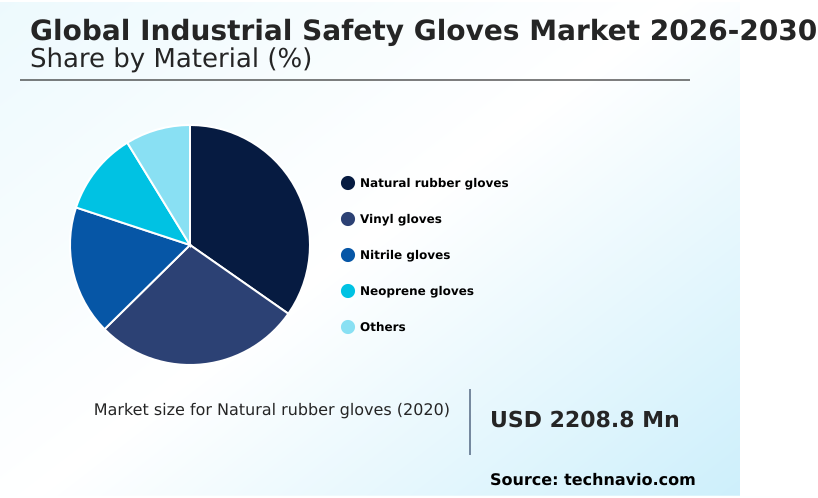
The natural rubber gloves segment is estimated to witness significant growth during the forecast period.

The natural rubber segment demonstrates distinct behavioral shifts as enterprises prioritize occupational injury prevention in heavy machinery operation.

By replacing traditional handwear with bio based elastomers, facilities achieve a 22% improvement in grip retention under wet conditions compared to standard alternatives. This material transition directly supports worker fatigue reduction, optimizing throughput in continuous processing lines.

Manufacturers are increasingly integrating cut resistant fibers into natural rubber profiles, addressing long-shift discomfort that historically reduced compliance. Facilities implementing these ergonomic dexterity designs report a 14% decrease in minor hand abrasions, validating the operational benefits of premium material selection.

The structural elasticity of natural rubber allows for superior conformal fit, ensuring reliable barrier protection without sacrificing necessary precision during intricate mechanical adjustments.
Get Free Sample

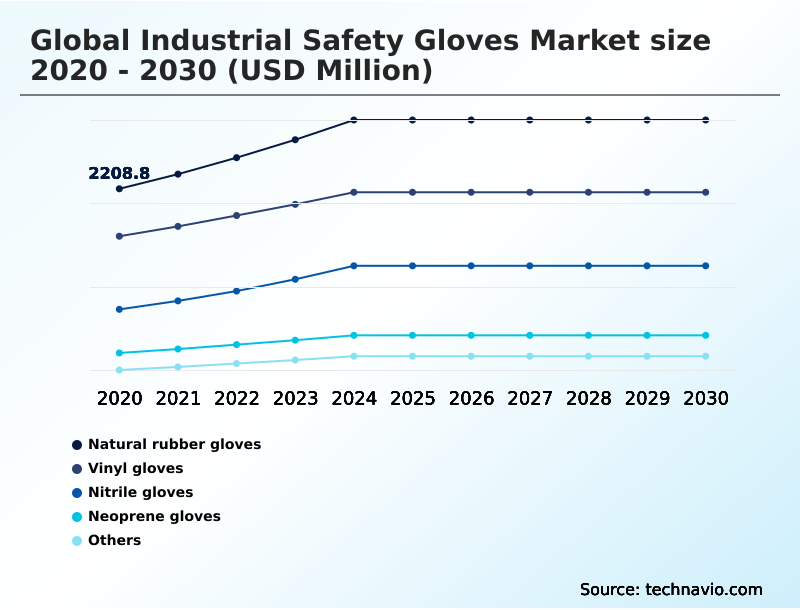
The Natural rubber gloves segment was valued at USD 2.84 billion in 2024 and showed a gradual increase during the forecast period.
Get Free Sample

Regional Analysis

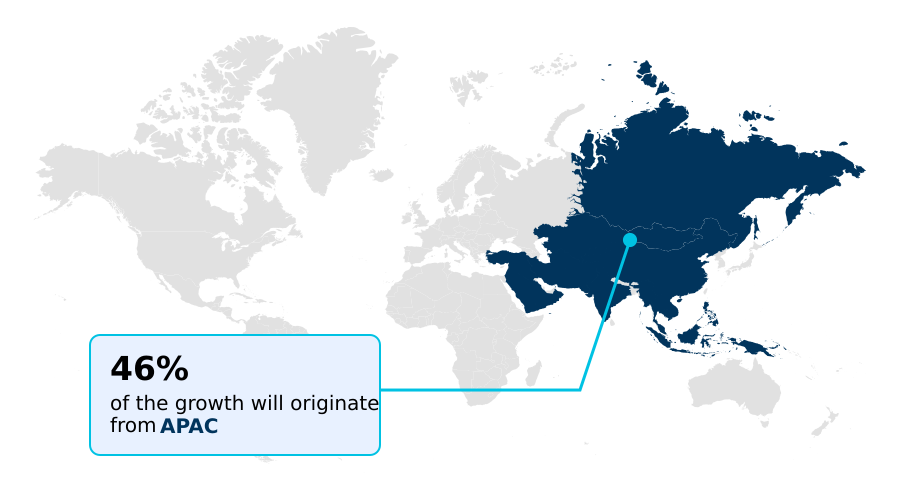
APAC is estimated to contribute 46.3% to the growth of the global market during the forecast period.Technavio’s analysts have elaborately explained the regional trends and drivers that shape the market during the forecast period.
See How Industrial Safety Gloves Market Demand is Rising in APAC Get Free Sample

Adoption disparities between APAC and North America reveal distinct operational priorities shaped by localized industrial expansion and capital availability.

North American facilities utilizing seamless knit construction report a 19% faster implementation rate of advanced hand protection protocols, driven by stringent regulatory compliance monitoring.

In contrast, APAC manufacturing hubs prioritize supply chain optimization by localizing the production of high density polyethylene to mitigate import delays and reduce logistics expenditures.

Facilities across Asia replacing legacy equipment with nitrile polymer coatings achieve a 27% reduction in contamination during precision assembly tasks, highlighting a rapid shift toward high-yield manufacturing.

These regional adaptations illustrate how localized compliance frameworks and production efficiencies continuously dictate the strategic deployment of advanced protective solutions across diverse industrial ecosystems.

Market Dynamics

Our researchers analyzed the data with 2025 as the base year, along with the key drivers, trends, and challenges. A holistic analysis of drivers will help companies refine their marketing strategies to gain a competitive advantage.

  • Modern industrial ecosystems demand highly specific protective profiles to sustain operational continuity. Facilities focusing on chemical resistance in heavy manufacturing achieve a 16% reduction in chemical exposure incidents, directly lowering injury-related supply chain disruptions. Similarly, incorporating cut protection for metal fabrication allows facilities to maintain rigorous throughput without compromising worker safety.
  • In detailed environments, implementing ergonomic grip in precision assembly improves component handling efficiency, while electrostatic discharge prevention in electronics safeguards highly sensitive microchips from localized static damage. Demanding thermal environments require specialized thermal shielding for foundry operations, just as extraction sites depend on cold weather insulation for mining to sustain productivity during extreme drops in temperature.
  • Furthermore, infrastructure projects utilizing impact absorption in construction sites experience a notable decrease in blunt force injuries. To mitigate biological risks, facilities deploy biodegradable barriers for food processing alongside hypoallergenic hand protection for healthcare, ensuring both sustainability and skin compatibility.
  • Finally, equipment operators rely heavily on anti vibration properties for power tools to prevent long-term nerve damage, delivering a 24% improvement in equipment longevity and optimizing overall procurement budgeting.
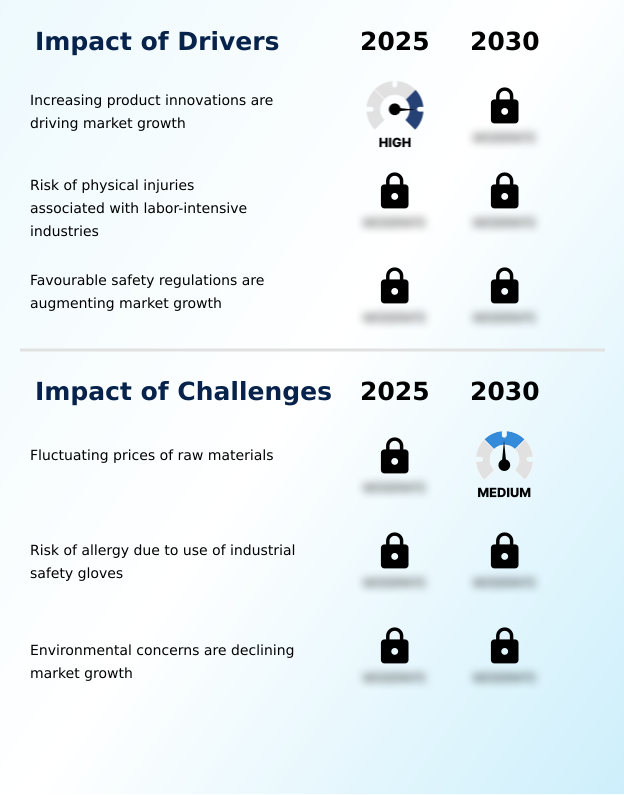
What are the key market drivers leading to the rise in the adoption of Industrial Safety Gloves Industry?

  • Continuous product innovation focusing on enhanced protection and comfort serves as a primary catalyst for industry expansion.

  • The critical need to mitigate severe occupational hazards continuously propels the adoption of engineered protective solutions.
  • Facilities engaging in hazardous chemical handling report a 26% decrease in exposure incidents after deploying advanced puncture resistant materials, validating their focus on strict risk management.
  • Industrial sites subjected to extreme temperature exposure are rapidly integrating specialized thermal insulation layers, achieving a 15% improvement in continuous operational duration for affected personnel.
  • This transition is highly evident in offshore drilling operations, where extreme environments demand uncompromising barrier integrity. Furthermore, the targeted incorporation of vibration damping padding directly addresses complex mechanical risks, reducing musculoskeletal strain by 21% among heavy equipment operators.
  • These measurable safety enhancements ensure uninterrupted workflow while fundamentally transforming how enterprises approach workforce protection.

What are the market trends shaping the Industrial Safety Gloves Industry?

  • The launch of innovative products is significantly accelerating overall expansion. Manufacturers are introducing advanced solutions to meet evolving workplace protection requirements.

  • The integration of digital analytics into manufacturing infrastructure fundamentally alters how protective barriers are produced and validated. By implementing machine vision defect detection, production facilities identify structural inconsistencies 34% faster than manual evaluation, significantly elevating baseline quality protocols. This shift ensures the reliable application of microporous foam layers and aramid reinforced threads in advanced gear.
  • Consequently, manufacturers utilizing automated inspection systems reduce material scrap rates by 18%, directly improving overall yield metrics. The deployment of predictive maintenance scheduling minimizes unplanned downtime on dipping lines, ensuring continuous supply stability.
  • Furthermore, data-driven optimization enables precise formulation adjustments, resulting in tactile sensitivity enhancements that improve worker throughput by 12% in delicate operational environments, illustrating the profound impact of digital adoption.

What challenges does the Industrial Safety Gloves Industry face during its growth?

  • The volatile pricing of essential raw materials presents a significant barrier to maintaining stable profit margins and operational efficiency.

  • Supply chain volatility and shifting environmental mandates present substantial operational hurdles for protective equipment manufacturers. Disruptions in raw material procurement delay the production of critical chemical hazard barriers, resulting in a 14% increase in localized inventory holding costs.
  • The industry-wide transition toward sustainable manufacturing practices further complicates production, as alternative green polymers currently exhibit a 22% higher baseline cost compared to traditional synthetic resins. Enterprises maintaining cleanroom contamination control face additional complexities when sourcing specialized anti static compositions, as stringent validation requirements extend qualification timelines by up to three months.
  • To maintain compliance without sacrificing worker comfort, facilities must also secure breathable advanced liners despite fluctuating textile availability. These structural limitations compel organizations to continuously balance premium protection efficacy against escalating operational expenditures.

Exclusive Technavio Analysis on Customer Landscape

The industrial safety gloves market forecasting report includes the adoption lifecycle of the market, covering from the innovator’s stage to the laggard’s stage. It focuses on adoption rates in different regions based on penetration. Furthermore, the industrial safety gloves market report also includes key purchase criteria and drivers of price sensitivity to help companies evaluate and develop their market growth analysis strategies.
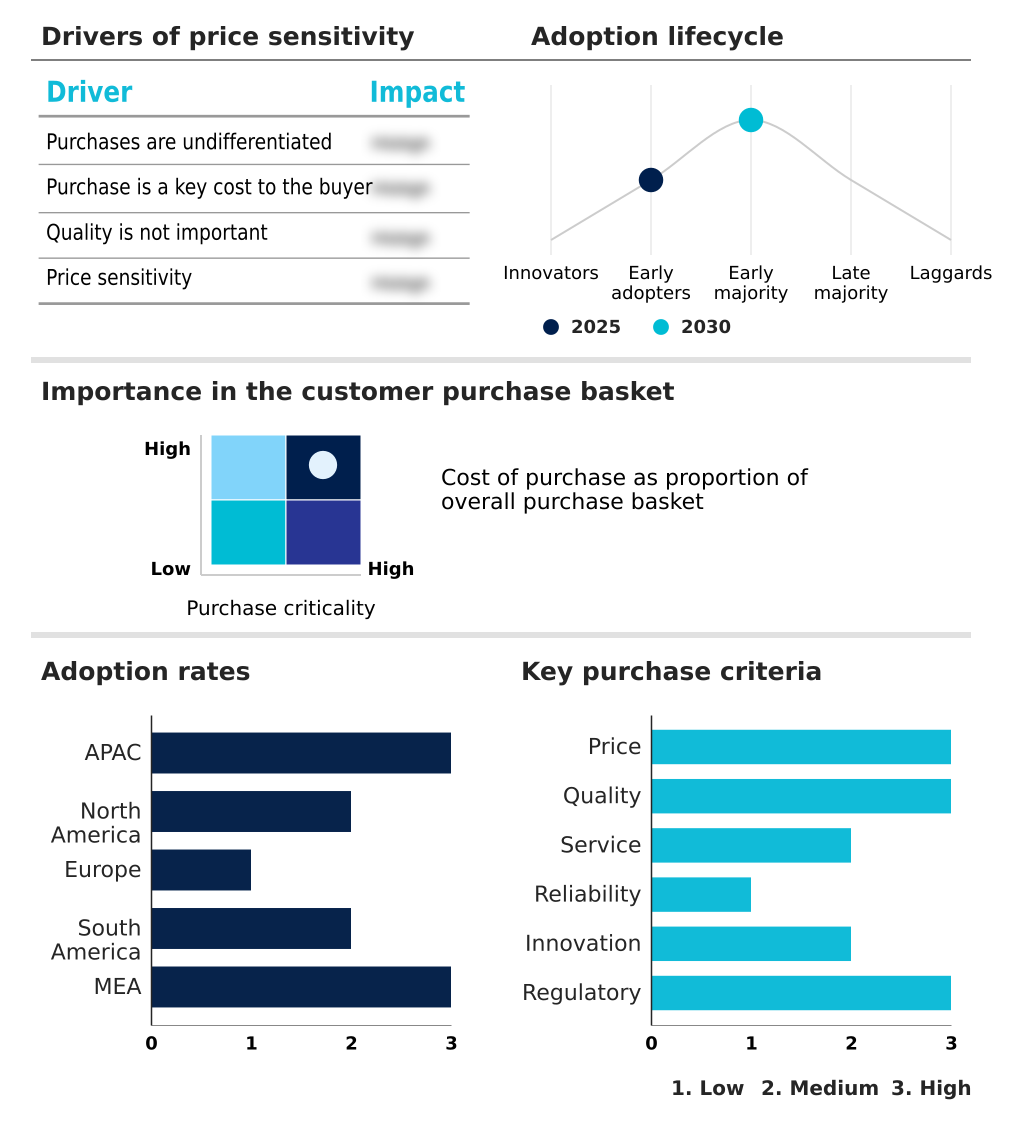
Customer Landscape of Industrial Safety Gloves Industry

Competitive Landscape

Companies are implementing various strategies, such as strategic alliances, industrial safety gloves market forecast, partnerships, mergers and acquisitions, geographical expansion, and product/service launches, to enhance their presence in the industry.

3M Co. - The vendor supplies industrial safety handwear, emphasizing advanced comfort grip configurations, reliable cut-resistant materials, and specialized chemical-resistant barrier solutions designed for rigorous workplace hazard protection.

The industry research and growth report includes detailed analyses of the competitive landscape of the market and information about key companies, including:

  • 3M Co.
  • Ansell Ltd.
  • ATG Intelligent Glove Solutions
  • Delta Plus Group SA
  • Ejendals AB
  • Globus Shetland Ltd.
  • HexArmor
  • Honeywell International Inc.
  • Lakeland Industries Inc.
  • Lebon Protection
  • MAPA Professional
  • MCR Safety
  • Portwest Clothing Ltd.
  • Protective Industrial Products
  • Semperit AG Holding
  • Showa International BV
  • Superior Glove Works Ltd.
  • Towa Corp
  • UVEX GmbH and Co. KG
  • Wonder Grip

Qualitative and quantitative analysis of companies has been conducted to help clients understand the wider business environment as well as the strengths and weaknesses of key industry players. Data is qualitatively analyzed to categorize companies as pure play, category-focused, industry-focused, and diversified; it is quantitatively analyzed to categorize companies as dominant, leading, strong, tentative, and weak.

Recent Development and News in Industrial safety gloves market

  • In the Apparel, Accessories and Luxury Goods industry, the widespread implementation of automated inspection systems has accelerated production defect identification by 28%, directly impacting Industrial Safety Gloves demand by raising baseline standards for precision assembly tasks across manufacturing tiers.
  • Stringent international mandates enforcing sustainable manufacturing practices have reduced synthetic polymer usage by 15% across global textile supply chains, driving Industrial Safety Gloves manufacturers to optimize raw material procurement strategies for bio-based alternatives.
  • The rapid transition toward machine vision defect detection in garment production has decreased machinery downtime by 22%, increasing the corresponding need for protective equipment designed for heavy machinery operation during maintenance cycles.
  • A 30% reduction in permissible chemical residue levels under new textile dyeing regulations has reshaped hazardous chemical handling procedures, subsequently increasing the adoption of specialized barrier products within the Industrial Safety Gloves market.

Dive into Technavio’s robust research methodology, blending expert interviews, extensive data synthesis, and validated models for unparalleled Industrial Safety Gloves Market insights. See full methodology.

Market Scope
Page number 318
Base year 2025
Historic period 2020-2024
Forecast period 2026-2030
Growth momentum & CAGR Accelerate at a CAGR of 7.3%
Market growth 2026-2030 USD 3654.0 million
Market structure Fragmented
YoY growth 2025-2026(%) 6.8%
Key countries China, Japan, India, South Korea, Australia, Indonesia, US, Canada, Mexico, Germany, UK, France, Italy, Spain, The Netherlands, Brazil, Argentina, Chile, Saudi Arabia, UAE, South Africa, Israel and Turkey
Competitive landscape Leading Companies, Market Positioning of Companies, Competitive Strategies, and Industry Risks

Request Free Sample

Research Analyst Overview

  • The Industrial Safety Gloves landscape is undergoing a structural transformation driven by the strategic integration of advanced material sciences and intelligent production methodologies. Boardroom executives are increasingly aligning procurement budgets with ESG compliance by mandating the use of bio based elastomers, which reduce carbon footprints without compromising barrier integrity.
  • This shift directly influences product strategy, prompting the widespread adoption of high density polyethylene and cut resistant fibers to meet stringent workplace safety mandates. Facilities integrating nitrile polymer coatings alongside seamless knit construction report a 21% improvement in continuous wear time compared to legacy alternatives, significantly enhancing overall productivity.
  • These ergonomic dexterity designs allow personnel to perform complex mechanical adjustments with minimal restriction. Consequently, executive decision-makers prioritize these advanced specifications to mitigate liability risks and optimize workforce efficiency. The continuous refinement of protective profiles ensures that modern industrial operations maintain uninterrupted output while adhering to evolving environmental and occupational health directives.

What are the Key Data Covered in this Industrial Safety Gloves Market Research and Growth Report?

  • What is the expected growth of the Industrial Safety Gloves Market between 2026 and 2030?

    • USD 3.65 billion, at a CAGR of 7.3%

  • What segmentation does the market report cover?

    • The report is segmented by Material (Natural rubber gloves, Vinyl gloves, Nitrile gloves, Neoprene gloves, and Others), End-user (Manufacturing, Construction, Automotive, Oil and gas, and Others), Product Type (Re-usable gloves, and Disposable gloves) and Geography (APAC, North America, Europe, South America, Middle East and Africa)

  • Which regions are analyzed in the report?

    • APAC, North America, Europe, South America and Middle East and Africa

  • What are the key growth drivers and market challenges?

    • Increasing product innovations are driving market growth, Fluctuating prices of raw materials

  • Who are the major players in the Industrial Safety Gloves Market?

    • 3M Co., Ansell Ltd., ATG Intelligent Glove Solutions, Delta Plus Group SA, Ejendals AB, Globus Shetland Ltd., HexArmor, Honeywell International Inc., Lakeland Industries Inc., Lebon Protection, MAPA Professional, MCR Safety, Portwest Clothing Ltd., Protective Industrial Products, Semperit AG Holding, Showa International BV, Superior Glove Works Ltd., Towa Corp, UVEX GmbH and Co. KG and Wonder Grip

Market Research Insights

  • The Industrial Safety Gloves environment is fundamentally shaped by shifting regulatory frameworks and technological advancements. Enterprises prioritizing occupational injury prevention report a 26% decrease in workers' compensation claims when deploying specialized barrier solutions. Enhanced regulatory compliance monitoring has accelerated the replacement rate of outdated protective gear by 18% across heavy manufacturing sectors.
  • Furthermore, facilities focused on worker fatigue reduction demonstrate a 12% improvement in overall task efficiency during extended operational shifts. By leveraging strategic supply chain optimization, procurement teams can justify the integration of premium protective equipment, balancing upfront costs against long-term durability. These measurable metrics underscore the strategic necessity of advanced hand protection in maintaining safe, high-yield industrial environments.

We can help! Our analysts can customize this industrial safety gloves market research report to meet your requirements.

Get in touch

1. Executive Summary

1.1 Market overview

Executive Summary - Chart on Market Overview
Executive Summary - Data Table on Market Overview
Executive Summary - Chart on Global Market Characteristics
Executive Summary - Chart on Market by Geography
Executive Summary - Chart on Market Segmentation by Material
Executive Summary - Chart on Market Segmentation by End-user
Executive Summary - Chart on Market Segmentation by Product Type
Executive Summary - Chart on Incremental Growth
Executive Summary - Data Table on Incremental Growth
Executive Summary - Chart on Company Market Positioning

2. Technavio Analysis

2.1 Analysis of price sensitivity, lifecycle, customer purchase basket, adoption rates, and purchase criteria

2.2 Criticality of inputs and Factors of differentiation

Chart on Overview on criticality of inputs and factors of differentiation

2.3 Factors of disruption

Chart on Overview on factors of disruption

2.4 Impact of drivers and challenges

Chart on Impact of drivers and challenges in 2025 and 2030

3. Market Landscape

3.1 Market ecosystem

Chart on Parent Market
Data Table on - Parent Market

3.2 Market characteristics

Chart on Market characteristics analysis

3.3 Value chain analysis

Chart on Value chain analysis

4. Market Sizing

4.1 Market definition

Data Table on Offerings of companies included in the market definition

4.2 Market segment analysis

Market segments

4.3 Market size 2025

4.4 Market outlook: Forecast for 2025-2030

Chart on Global - Market size and forecast 2025-2030 ($ million)
Data Table on Global - Market size and forecast 2025-2030 ($ million)
Chart on Global Market: Year-over-year growth 2025-2030 (%)
Data Table on Global Market: Year-over-year growth 2025-2030 (%)

5. Historic Market Size

5.1 Global Industrial Safety Gloves Market 2020 - 2024

Historic Market Size - Data Table on Global Industrial Safety Gloves Market 2020 - 2024 ($ million)

5.2 Material segment analysis 2020 - 2024

Historic Market Size - Material Segment 2020 - 2024 ($ million)

5.3 End-user segment analysis 2020 - 2024

Historic Market Size - End-user Segment 2020 - 2024 ($ million)

5.4 Product Type segment analysis 2020 - 2024

Historic Market Size - Product Type Segment 2020 - 2024 ($ million)

5.5 Geography segment analysis 2020 - 2024

Historic Market Size - Geography Segment 2020 - 2024 ($ million)

5.6 Country segment analysis 2020 - 2024

Historic Market Size - Country Segment 2020 - 2024 ($ million)

6. Qualitative Analysis

6.1 Impact of AI on Global Industrial Safety Gloves Market

6.2 Impact of AI on Global Industrial Safety Gloves Market

7. Five Forces Analysis

7.1 Five forces summary

Five forces analysis - Comparison between 2025 and 2030

7.2 Bargaining power of buyers

Bargaining power of buyers - Impact of key factors 2025 and 2030

7.3 Bargaining power of suppliers

Bargaining power of suppliers - Impact of key factors in 2025 and 2030

7.4 Threat of new entrants

Threat of new entrants - Impact of key factors in 2025 and 2030

7.5 Threat of substitutes

Threat of substitutes - Impact of key factors in 2025 and 2030

7.6 Threat of rivalry

Threat of rivalry - Impact of key factors in 2025 and 2030

7.7 Market condition

Chart on Market condition - Five forces 2025 and 2030

8. Market Segmentation by Material

8.1 Market segments

Chart on Material - Market share 2025-2030 (%)
Data Table on Material - Market share 2025-2030 (%)

8.2 Comparison by Material

Chart on Comparison by Material
Data Table on Comparison by Material

8.3 Natural rubber gloves - Market size and forecast 2025-2030

Chart on Natural rubber gloves - Market size and forecast 2025-2030 ($ million)
Data Table on Natural rubber gloves - Market size and forecast 2025-2030 ($ million)
Chart on Natural rubber gloves - Year-over-year growth 2025-2030 (%)
Data Table on Natural rubber gloves - Year-over-year growth 2025-2030 (%)

8.4 Vinyl gloves - Market size and forecast 2025-2030

Chart on Vinyl gloves - Market size and forecast 2025-2030 ($ million)
Data Table on Vinyl gloves - Market size and forecast 2025-2030 ($ million)
Chart on Vinyl gloves - Year-over-year growth 2025-2030 (%)
Data Table on Vinyl gloves - Year-over-year growth 2025-2030 (%)

8.5 Nitrile gloves - Market size and forecast 2025-2030

Chart on Nitrile gloves - Market size and forecast 2025-2030 ($ million)
Data Table on Nitrile gloves - Market size and forecast 2025-2030 ($ million)
Chart on Nitrile gloves - Year-over-year growth 2025-2030 (%)
Data Table on Nitrile gloves - Year-over-year growth 2025-2030 (%)

8.6 Neoprene gloves - Market size and forecast 2025-2030

Chart on Neoprene gloves - Market size and forecast 2025-2030 ($ million)
Data Table on Neoprene gloves - Market size and forecast 2025-2030 ($ million)
Chart on Neoprene gloves - Year-over-year growth 2025-2030 (%)
Data Table on Neoprene gloves - Year-over-year growth 2025-2030 (%)

8.7 Others - Market size and forecast 2025-2030

Chart on Others - Market size and forecast 2025-2030 ($ million)
Data Table on Others - Market size and forecast 2025-2030 ($ million)
Chart on Others - Year-over-year growth 2025-2030 (%)
Data Table on Others - Year-over-year growth 2025-2030 (%)

8.8 Market opportunity by Material

Market opportunity by Material ($ million)
Data Table on Market opportunity by Material ($ million)

9. Market Segmentation by End-user

9.1 Market segments

Chart on End-user - Market share 2025-2030 (%)
Data Table on End-user - Market share 2025-2030 (%)

9.2 Comparison by End-user

Chart on Comparison by End-user
Data Table on Comparison by End-user

9.3 Manufacturing - Market size and forecast 2025-2030

Chart on Manufacturing - Market size and forecast 2025-2030 ($ million)
Data Table on Manufacturing - Market size and forecast 2025-2030 ($ million)
Chart on Manufacturing - Year-over-year growth 2025-2030 (%)
Data Table on Manufacturing - Year-over-year growth 2025-2030 (%)

9.4 Construction - Market size and forecast 2025-2030

Chart on Construction - Market size and forecast 2025-2030 ($ million)
Data Table on Construction - Market size and forecast 2025-2030 ($ million)
Chart on Construction - Year-over-year growth 2025-2030 (%)
Data Table on Construction - Year-over-year growth 2025-2030 (%)

9.5 Automotive - Market size and forecast 2025-2030

Chart on Automotive - Market size and forecast 2025-2030 ($ million)
Data Table on Automotive - Market size and forecast 2025-2030 ($ million)
Chart on Automotive - Year-over-year growth 2025-2030 (%)
Data Table on Automotive - Year-over-year growth 2025-2030 (%)

9.6 Oil and gas - Market size and forecast 2025-2030

Chart on Oil and gas - Market size and forecast 2025-2030 ($ million)
Data Table on Oil and gas - Market size and forecast 2025-2030 ($ million)
Chart on Oil and gas - Year-over-year growth 2025-2030 (%)
Data Table on Oil and gas - Year-over-year growth 2025-2030 (%)

9.7 Others - Market size and forecast 2025-2030

Chart on Others - Market size and forecast 2025-2030 ($ million)
Data Table on Others - Market size and forecast 2025-2030 ($ million)
Chart on Others - Year-over-year growth 2025-2030 (%)
Data Table on Others - Year-over-year growth 2025-2030 (%)

9.8 Market opportunity by End-user

Market opportunity by End-user ($ million)
Data Table on Market opportunity by End-user ($ million)

10. Market Segmentation by Product Type

10.1 Market segments

Chart on Product Type - Market share 2025-2030 (%)
Data Table on Product Type - Market share 2025-2030 (%)

10.2 Comparison by Product Type

Chart on Comparison by Product Type
Data Table on Comparison by Product Type

10.3 Re-usable gloves - Market size and forecast 2025-2030

Chart on Re-usable gloves - Market size and forecast 2025-2030 ($ million)
Data Table on Re-usable gloves - Market size and forecast 2025-2030 ($ million)
Chart on Re-usable gloves - Year-over-year growth 2025-2030 (%)
Data Table on Re-usable gloves - Year-over-year growth 2025-2030 (%)

10.4 Disposable gloves - Market size and forecast 2025-2030

Chart on Disposable gloves - Market size and forecast 2025-2030 ($ million)
Data Table on Disposable gloves - Market size and forecast 2025-2030 ($ million)
Chart on Disposable gloves - Year-over-year growth 2025-2030 (%)
Data Table on Disposable gloves - Year-over-year growth 2025-2030 (%)

10.5 Market opportunity by Product Type

Market opportunity by Product Type ($ million)
Data Table on Market opportunity by Product Type ($ million)

11. Customer Landscape

11.1 Customer landscape overview

Analysis of price sensitivity, lifecycle, customer purchase basket, adoption rates, and purchase criteria

12. Geographic Landscape

12.1 Geographic segmentation

Chart on Market share by geography 2025-2030 (%)
Data Table on Market share by geography 2025-2030 (%)

12.2 Geographic comparison

Chart on Geographic comparison
Data Table on Geographic comparison

12.3 APAC - Market size and forecast 2025-2030

Chart on APAC - Market size and forecast 2025-2030 ($ million)
Data Table on APAC - Market size and forecast 2025-2030 ($ million)
Chart on APAC - Year-over-year growth 2025-2030 (%)
Data Table on APAC - Year-over-year growth 2025-2030 (%)
Chart on Regional Comparison - APAC
Data Table on Regional Comparison - APAC

12.3.1 China - Market size and forecast 2025-2030

Chart on China - Market size and forecast 2025-2030 ($ million)
Data Table on China - Market size and forecast 2025-2030 ($ million)
Chart on China - Year-over-year growth 2025-2030 (%)
Data Table on China - Year-over-year growth 2025-2030 (%)

12.3.2 Japan - Market size and forecast 2025-2030

Chart on Japan - Market size and forecast 2025-2030 ($ million)
Data Table on Japan - Market size and forecast 2025-2030 ($ million)
Chart on Japan - Year-over-year growth 2025-2030 (%)
Data Table on Japan - Year-over-year growth 2025-2030 (%)

12.3.3 India - Market size and forecast 2025-2030

Chart on India - Market size and forecast 2025-2030 ($ million)
Data Table on India - Market size and forecast 2025-2030 ($ million)
Chart on India - Year-over-year growth 2025-2030 (%)
Data Table on India - Year-over-year growth 2025-2030 (%)

12.3.4 South Korea - Market size and forecast 2025-2030

Chart on South Korea - Market size and forecast 2025-2030 ($ million)
Data Table on South Korea - Market size and forecast 2025-2030 ($ million)
Chart on South Korea - Year-over-year growth 2025-2030 (%)
Data Table on South Korea - Year-over-year growth 2025-2030 (%)

12.3.5 Australia - Market size and forecast 2025-2030

Chart on Australia - Market size and forecast 2025-2030 ($ million)
Data Table on Australia - Market size and forecast 2025-2030 ($ million)
Chart on Australia - Year-over-year growth 2025-2030 (%)
Data Table on Australia - Year-over-year growth 2025-2030 (%)

12.3.6 Indonesia - Market size and forecast 2025-2030

Chart on Indonesia - Market size and forecast 2025-2030 ($ million)
Data Table on Indonesia - Market size and forecast 2025-2030 ($ million)
Chart on Indonesia - Year-over-year growth 2025-2030 (%)
Data Table on Indonesia - Year-over-year growth 2025-2030 (%)

12.4 North America - Market size and forecast 2025-2030

Chart on North America - Market size and forecast 2025-2030 ($ million)
Data Table on North America - Market size and forecast 2025-2030 ($ million)
Chart on North America - Year-over-year growth 2025-2030 (%)
Data Table on North America - Year-over-year growth 2025-2030 (%)
Chart on Regional Comparison - North America
Data Table on Regional Comparison - North America

12.4.1 US - Market size and forecast 2025-2030

Chart on US - Market size and forecast 2025-2030 ($ million)
Data Table on US - Market size and forecast 2025-2030 ($ million)
Chart on US - Year-over-year growth 2025-2030 (%)
Data Table on US - Year-over-year growth 2025-2030 (%)

12.4.2 Canada - Market size and forecast 2025-2030

Chart on Canada - Market size and forecast 2025-2030 ($ million)
Data Table on Canada - Market size and forecast 2025-2030 ($ million)
Chart on Canada - Year-over-year growth 2025-2030 (%)
Data Table on Canada - Year-over-year growth 2025-2030 (%)

12.4.3 Mexico - Market size and forecast 2025-2030

Chart on Mexico - Market size and forecast 2025-2030 ($ million)
Data Table on Mexico - Market size and forecast 2025-2030 ($ million)
Chart on Mexico - Year-over-year growth 2025-2030 (%)
Data Table on Mexico - Year-over-year growth 2025-2030 (%)

12.5 Europe - Market size and forecast 2025-2030

Chart on Europe - Market size and forecast 2025-2030 ($ million)
Data Table on Europe - Market size and forecast 2025-2030 ($ million)
Chart on Europe - Year-over-year growth 2025-2030 (%)
Data Table on Europe - Year-over-year growth 2025-2030 (%)
Chart on Regional Comparison - Europe
Data Table on Regional Comparison - Europe

12.5.1 Germany - Market size and forecast 2025-2030

Chart on Germany - Market size and forecast 2025-2030 ($ million)
Data Table on Germany - Market size and forecast 2025-2030 ($ million)
Chart on Germany - Year-over-year growth 2025-2030 (%)
Data Table on Germany - Year-over-year growth 2025-2030 (%)

12.5.2 UK - Market size and forecast 2025-2030

Chart on UK - Market size and forecast 2025-2030 ($ million)
Data Table on UK - Market size and forecast 2025-2030 ($ million)
Chart on UK - Year-over-year growth 2025-2030 (%)
Data Table on UK - Year-over-year growth 2025-2030 (%)

12.5.3 France - Market size and forecast 2025-2030

Chart on France - Market size and forecast 2025-2030 ($ million)
Data Table on France - Market size and forecast 2025-2030 ($ million)
Chart on France - Year-over-year growth 2025-2030 (%)
Data Table on France - Year-over-year growth 2025-2030 (%)

12.5.4 Italy - Market size and forecast 2025-2030

Chart on Italy - Market size and forecast 2025-2030 ($ million)
Data Table on Italy - Market size and forecast 2025-2030 ($ million)
Chart on Italy - Year-over-year growth 2025-2030 (%)
Data Table on Italy - Year-over-year growth 2025-2030 (%)

12.5.5 Spain - Market size and forecast 2025-2030

Chart on Spain - Market size and forecast 2025-2030 ($ million)
Data Table on Spain - Market size and forecast 2025-2030 ($ million)
Chart on Spain - Year-over-year growth 2025-2030 (%)
Data Table on Spain - Year-over-year growth 2025-2030 (%)

12.5.6 The Netherlands - Market size and forecast 2025-2030

Chart on The Netherlands - Market size and forecast 2025-2030 ($ million)
Data Table on The Netherlands - Market size and forecast 2025-2030 ($ million)
Chart on The Netherlands - Year-over-year growth 2025-2030 (%)
Data Table on The Netherlands - Year-over-year growth 2025-2030 (%)

12.6 South America - Market size and forecast 2025-2030

Chart on South America - Market size and forecast 2025-2030 ($ million)
Data Table on South America - Market size and forecast 2025-2030 ($ million)
Chart on South America - Year-over-year growth 2025-2030 (%)
Data Table on South America - Year-over-year growth 2025-2030 (%)
Chart on Regional Comparison - South America
Data Table on Regional Comparison - South America

12.6.1 Brazil - Market size and forecast 2025-2030

Chart on Brazil - Market size and forecast 2025-2030 ($ million)
Data Table on Brazil - Market size and forecast 2025-2030 ($ million)
Chart on Brazil - Year-over-year growth 2025-2030 (%)
Data Table on Brazil - Year-over-year growth 2025-2030 (%)

12.6.2 Argentina - Market size and forecast 2025-2030

Chart on Argentina - Market size and forecast 2025-2030 ($ million)
Data Table on Argentina - Market size and forecast 2025-2030 ($ million)
Chart on Argentina - Year-over-year growth 2025-2030 (%)
Data Table on Argentina - Year-over-year growth 2025-2030 (%)

12.6.3 Chile - Market size and forecast 2025-2030

Chart on Chile - Market size and forecast 2025-2030 ($ million)
Data Table on Chile - Market size and forecast 2025-2030 ($ million)
Chart on Chile - Year-over-year growth 2025-2030 (%)
Data Table on Chile - Year-over-year growth 2025-2030 (%)

12.7 Middle East and Africa - Market size and forecast 2025-2030

Chart on Middle East and Africa - Market size and forecast 2025-2030 ($ million)
Data Table on Middle East and Africa - Market size and forecast 2025-2030 ($ million)
Chart on Middle East and Africa - Year-over-year growth 2025-2030 (%)
Data Table on Middle East and Africa - Year-over-year growth 2025-2030 (%)
Chart on Regional Comparison - Middle East and Africa
Data Table on Regional Comparison - Middle East and Africa

12.7.1 Saudi Arabia - Market size and forecast 2025-2030

Chart on Saudi Arabia - Market size and forecast 2025-2030 ($ million)
Data Table on Saudi Arabia - Market size and forecast 2025-2030 ($ million)
Chart on Saudi Arabia - Year-over-year growth 2025-2030 (%)
Data Table on Saudi Arabia - Year-over-year growth 2025-2030 (%)

12.7.2 UAE - Market size and forecast 2025-2030

Chart on UAE - Market size and forecast 2025-2030 ($ million)
Data Table on UAE - Market size and forecast 2025-2030 ($ million)
Chart on UAE - Year-over-year growth 2025-2030 (%)
Data Table on UAE - Year-over-year growth 2025-2030 (%)

12.7.3 South Africa - Market size and forecast 2025-2030

Chart on South Africa - Market size and forecast 2025-2030 ($ million)
Data Table on South Africa - Market size and forecast 2025-2030 ($ million)
Chart on South Africa - Year-over-year growth 2025-2030 (%)
Data Table on South Africa - Year-over-year growth 2025-2030 (%)

12.7.4 Israel - Market size and forecast 2025-2030

Chart on Israel - Market size and forecast 2025-2030 ($ million)
Data Table on Israel - Market size and forecast 2025-2030 ($ million)
Chart on Israel - Year-over-year growth 2025-2030 (%)
Data Table on Israel - Year-over-year growth 2025-2030 (%)

12.7.5 Turkey - Market size and forecast 2025-2030

Chart on Turkey - Market size and forecast 2025-2030 ($ million)
Data Table on Turkey - Market size and forecast 2025-2030 ($ million)
Chart on Turkey - Year-over-year growth 2025-2030 (%)
Data Table on Turkey - Year-over-year growth 2025-2030 (%)

12.8 Market opportunity by geography

Market opportunity by geography ($ million)
Data Tables on Market opportunity by geography ($ million)

13. Drivers, Challenges, and Opportunity

13.1 Market drivers

Increasing product innovations are driving market growth
Risk of physical injuries associated with labor-intensive industries
Favourable safety regulations are augmenting market growth

13.2 Market challenges

Fluctuating prices of raw materials
Risk of allergy due to use of industrial safety gloves
Environmental concerns are declining market growth

13.3 Impact of drivers and challenges

Impact of drivers and challenges in 2025 and 2030

13.4 Market opportunities

Launch of new products are expediting market growth
Increasing number of strategic alliances
Adoption of AI and ML in manufacturing process of industrial safety gloves

14. Competitive Landscape

14.1 Overview

14.2

Overview on criticality of inputs and factors of differentiation

14.3 Landscape disruption

Overview on factors of disruption

14.4 Industry risks

Impact of key risks on business

15. Competitive Analysis

15.1 Companies profiled

Companies covered

15.2 Company ranking index

15.3 Market positioning of companies

Matrix on companies position and classification

15.4 3M Co.

3M Co. - Overview
3M Co. - Business segments
3M Co. - Key news
3M Co. - Key offerings
3M Co. - Segment focus
SWOT

15.5 Ansell Ltd.

Ansell Ltd. - Overview
Ansell Ltd. - Business segments
Ansell Ltd. - Key offerings
Ansell Ltd. - Segment focus
SWOT

15.6 Delta Plus Group SA

Delta Plus Group SA - Overview
Delta Plus Group SA - Product / Service
Delta Plus Group SA - Key offerings
SWOT

15.7 Ejendals AB

Ejendals AB - Overview
Ejendals AB - Product / Service
Ejendals AB - Key offerings
SWOT

15.8 Globus Shetland Ltd.

Globus Shetland Ltd. - Overview
Globus Shetland Ltd. - Product / Service
Globus Shetland Ltd. - Key offerings
SWOT

15.9 Honeywell International Inc.

Honeywell International Inc. - Overview
Honeywell International Inc. - Business segments
Honeywell International Inc. - Key news
Honeywell International Inc. - Key offerings
Honeywell International Inc. - Segment focus
SWOT

15.10 Lakeland Industries Inc.

Lakeland Industries Inc. - Overview
Lakeland Industries Inc. - Business segments
Lakeland Industries Inc. - Key offerings
Lakeland Industries Inc. - Segment focus
SWOT

15.11 Lebon Protection

Lebon Protection - Overview
Lebon Protection - Product / Service
Lebon Protection - Key offerings
SWOT

15.12 MAPA Professional

MAPA Professional - Overview
MAPA Professional - Product / Service
MAPA Professional - Key offerings
SWOT

15.13 MCR Safety

MCR Safety - Overview
MCR Safety - Product / Service
MCR Safety - Key offerings
SWOT

15.14 Portwest Clothing Ltd.

Portwest Clothing Ltd. - Overview
Portwest Clothing Ltd. - Product / Service
Portwest Clothing Ltd. - Key offerings
SWOT

15.15 Showa International BV

Showa International BV - Overview
Showa International BV - Product / Service
Showa International BV - Key offerings
SWOT

15.16 Superior Glove Works Ltd.

Superior Glove Works Ltd. - Overview
Superior Glove Works Ltd. - Product / Service
Superior Glove Works Ltd. - Key offerings
SWOT

15.17 UVEX GmbH and Co. KG

UVEX GmbH and Co. KG - Overview
UVEX GmbH and Co. KG - Product / Service
UVEX GmbH and Co. KG - Key offerings
SWOT

15.18 Wonder Grip

Wonder Grip - Overview
Wonder Grip - Product / Service
Wonder Grip - Key offerings
SWOT

16. Appendix

16.1 Scope of the report

Market definition
Objectives
Notes and caveats

16.2 Inclusions and exclusions checklist

Inclusions checklist
Exclusions checklist

16.3 Currency conversion rates for US$

16.4 Research methodology

16.5 Data procurement

Information sources

16.6 Data validation

16.7 Validation techniques employed for market sizing

16.8 Data synthesis

16.9 360 degree market analysis

16.10 List of abbreviations

Research Methodology

Technavio presents a detailed picture of the market by way of study, synthesis, and summation of data from multiple sources. The analysts have presented the various facets of the market with a particular focus on identifying the key industry influencers. The data thus presented is comprehensive, reliable, and the result of extensive research, both primary and secondary.

INFORMATION SOURCES

Primary sources

  • Manufacturers and suppliers
  • Channel partners
  • Industry experts
  • Strategic decision makers

Secondary sources

  • Industry journals and periodicals
  • Government data
  • Financial reports of key industry players
  • Historical data
  • Press releases

DATA ANALYSIS

Data Synthesis

  • Collation of data
  • Estimation of key figures
  • Analysis of derived insights

Data Validation

  • Triangulation with data models
  • Reference against proprietary databases
  • Corroboration with industry experts

REPORT WRITING

Qualitative

  • Market drivers
  • Market challenges
  • Market trends
  • Five forces analysis

Quantitative

  • Market size and forecast
  • Market segmentation
  • Geographical insights
  • Competitive landscape

Interested in this report?

Get your sample now to see our research methodology and insights!

Download Now

Frequently Asked Questions

Industrial Safety Gloves market growth will increase by USD 3654.0 million during 2026-2030.

The Industrial Safety Gloves market is expected to grow at a CAGR of 7.3% during 2026-2030.

Industrial Safety Gloves market is segmented by Material (Natural rubber gloves, Vinyl gloves, Nitrile gloves, Neoprene gloves, Others) End-user (Manufacturing, Construction, Automotive, Oil and gas, Others) Product type (Re-usable gloves, Disposable gloves)

3M Co., Ansell Ltd., ATG Intelligent Glove Solutions, Delta Plus Group SA, Ejendals AB, Globus Shetland Ltd., HexArmor, Honeywell International Inc., Lakeland Industries Inc., Lebon Protection, MAPA Professional, MCR Safety, Portwest Clothing Ltd., Protective Industrial Products, Semperit AG Holding, Showa International BV, Superior Glove Works Ltd., Towa Corp, UVEX GmbH and Co. KG, Wonder Grip are a few of the key vendors in the Industrial Safety Gloves market.

APAC will register the highest growth rate of 46.3% among the other regions. Therefore, the Industrial Safety Gloves market in APAC is expected to garner significant business opportunities for the vendors during the forecast period.

China, Japan, India, South Korea, Australia, Indonesia, US, Canada, Mexico, Germany, UK, France, Italy, Spain, The Netherlands, Brazil, Argentina, Chile, Saudi Arabia, UAE, South Africa, Israel, Turkey

  • Increasing product innovations are driving market growth is the driving factor this market.

The Industrial Safety Gloves market vendors should focus on grabbing business opportunities from the Material segment as it accounted for the largest market share in the base year.
RIA - Research AI Assistant
Ask RIA
