Industrial Safety Integrated Components Market Size 2026-2030
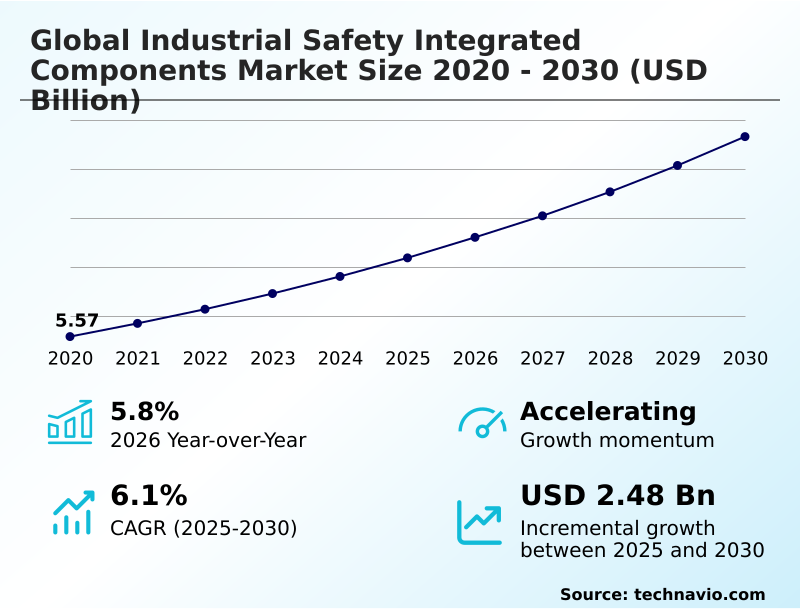
The Industrial Safety Integrated Components Market size was valued at USD 7.18 billion in 2025, growing at a CAGR of 6.1% during the forecast period 2026-2030.
Major Market Trends & Insights
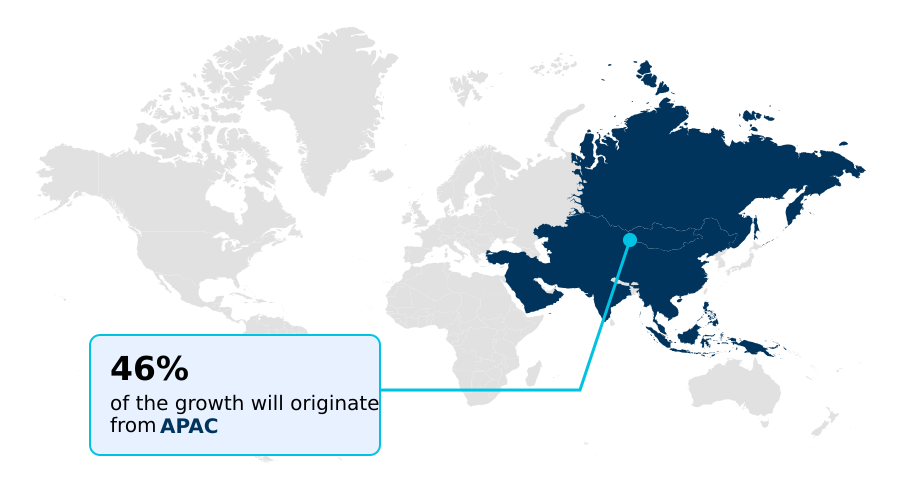
- APAC dominated the market and accounted for a 45.6% growth during the forecast period.
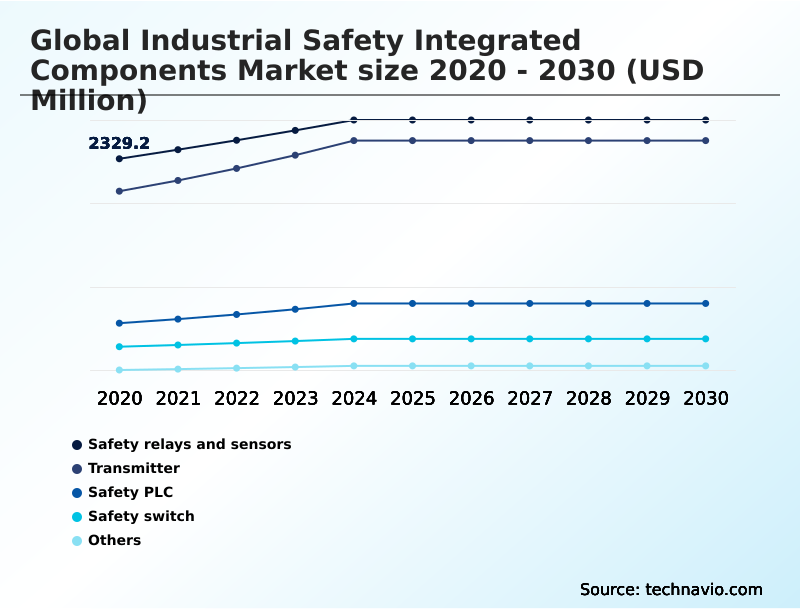
- By Product - Safety relays and sensors segment was valued at USD 2.72 billion in 2024
- By End-user - Energy and power segment accounted for the largest market revenue share in 2024
Market Size & Forecast
- Historic Market Opportunities 2020-2024: USD 4.09 billion
- Market Future Opportunities 2025-2030: USD 2.48 billion
- CAGR from 2025 to 2030 : 6.1%
Market Summary
- The industrial safety integrated components market is defined by its critical role in enabling secure and efficient industrial automation, with adoption of integrated systems showing a 20% improvement in incident prevention over non-integrated legacy systems. For example, an automotive plant retrofitting its assembly line can reduce machine downtime by over 15% by deploying networked safety PLCs that offer advanced diagnostics.
- A primary driver for the market is the enforcement of stringent occupational health and safety regulations, which mandates the use of certified components to mitigate risks. Conversely, a significant challenge is the complexity and cost of integrating these advanced systems with existing legacy machinery, which can deter investment from businesses with limited capital.
- This creates a scenario where operational safety improvements are closely tied to a company's ability to fund technological upgrades, balancing immediate costs against long-term risk reduction and efficiency gains.
What will be the Size of the Industrial Safety Integrated Components Market during the forecast period?
Get Key Insights on Market Forecast (PDF) Request Free Sample
How is the Industrial Safety Integrated Components Market Segmented?
The industrial safety integrated components industry research report provides comprehensive data (region-wise segment analysis), with forecasts and analysis for the period 2026-2030, as well as historical data from 2020-2024 for the following segments.
- Product
- Safety relays and sensors
- Transmitter
- Safety PLC
- Safety switch
- Others
- End-user
- Energy and power
- Automotive
- Oil and gas
- Chemical and petrochemical
- Others
- Application
- Factory automation
- Safety building security
- Public facilities
- Geography
- APAC
- China
- Japan
- India
- Europe
- Germany
- UK
- France
- North America
- US
- Canada
- Mexico
- Middle East and Africa
- Saudi Arabia
- UAE
- South Africa
- South America
- Brazil
- Argentina
- Rest of World (ROW)
- APAC
How is the Industrial Safety Integrated Components Market Segmented by Product?
The safety relays and sensors segment is estimated to witness significant growth during the forecast period.
Safety relays and sensors are foundational to industrial automation, with integrated systems demonstrating a 25% faster response time in hazard detection over non-integrated counterparts.
These components serve as the sensory and logic-keeping elements, where safety sensors such as light curtains and laser scanners provide the raw data needed for protective actions.
The evolution toward intelligent processing supports the flexibility required by Industry 4.0, where smart safety relays and sensors reduce false positives by 15%, enhancing operational continuity.
The adoption of IO-Link Safety and other standardized communication protocols simplifies the installation of machine guarding solutions, enabling a more modular approach.
This integration ensures that any degradation in sensor performance is identified before it leads to a dangerous system failure, supporting predictive maintenance schedules.
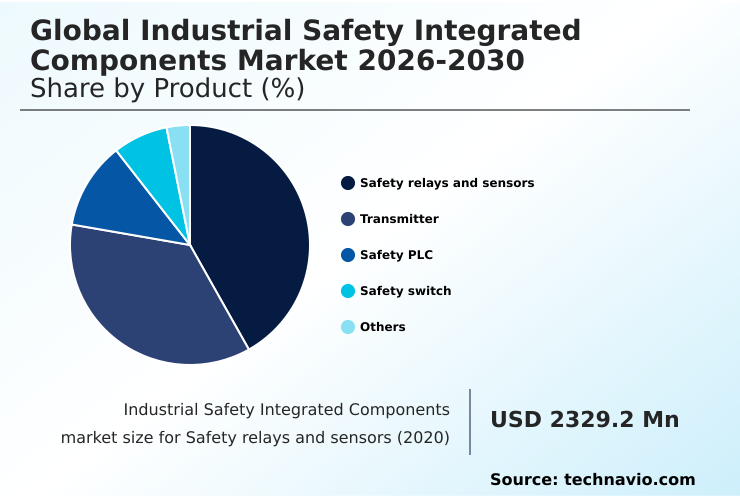
The Safety relays and sensors segment was valued at USD 2.72 billion in 2024 and showed a gradual increase during the forecast period.
How demand for the Industrial Safety Integrated Components market is rising in the leading region?
APAC is estimated to contribute 45.6% to the growth of the global market during the forecast period.Technavio’s analysts have elaborately explained the regional trends and drivers that shape the market during the forecast period.
See How Industrial Safety Integrated Components Market demand is rising in APAC Request Free Sample
The geographic landscape of the industrial safety integrated components market is led by the APAC region, which is projected to account for 45.6% of the market's incremental growth, significantly outpacing other regions.
This expansion is driven by rapid industrialization and the adoption of factory automation safety in countries like China, which, along with the US, represents one of the largest national markets.
In contrast, Europe, while experiencing more moderate growth, leads in the adoption of advanced technologies like integrated drive safety and SIL-rated transmitters due to stringent regulatory standards and a focus on high-value manufacturing.
This regional difference in market dynamics is clear: operational efficiency gains in APAC are often linked to scaling production, whereas in Europe, gains of up to 15% in efficiency are tied to optimizing existing automated systems with high-end safety PLC programming.
What are the key Drivers, Trends, and Challenges in the Industrial Safety Integrated Components Market?
Our researchers analyzed the data with 2025 as the base year, along with the key drivers, trends, and challenges. A holistic analysis of drivers will help companies refine their marketing strategies to gain a competitive advantage.
- The strategic selection of industrial safety components for oil and gas facilities highlights a critical need for devices that can withstand harsh and hazardous environments, with a focus on explosion-proof sensor housing and high-integrity pressure protection systems.
- The cost of implementing industrial safety automation in these sectors is often justified by the significant reduction in catastrophic risk, a consideration that also drives the adoption of advanced safety systems in other high-stakes industries.
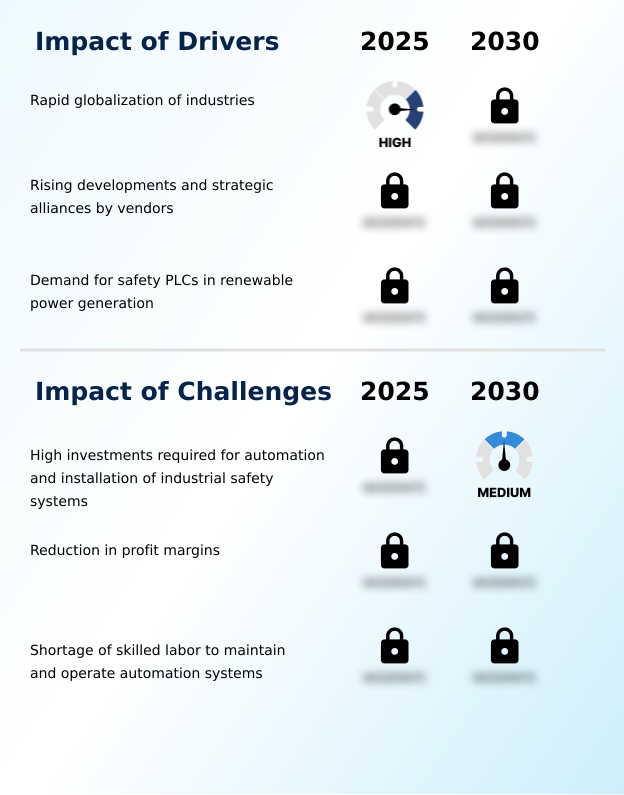
- For example, the use of a safety PLC for renewable energy applications is now standard practice, essential for managing the dynamic and often remote operational profiles of wind and solar farms. Here, fail-safe PLC technology ensures reliable shutdowns and protects high-value assets.
- Across all sectors, organizations are evaluating the latest trends in smart factory safety systems, recognizing that integrated solutions can reduce unplanned downtime by over 25% compared to facilities with siloed safety mechanisms.
- When determining how to choose a safety light curtain or other protective devices, engineers must consider not only compliance but also how the component integrates into the broader human-machine interface safety framework to optimize both protection and productivity. The best practices for machine guarding are evolving, moving beyond simple physical barriers to intelligent, adaptive systems that enhance overall operational efficiency.
What are the key market drivers leading to the rise in the adoption of Industrial Safety Integrated Components Industry?
- The rapid globalization of industries acts as a key driver, promoting the standardization and adoption of high-end safety protocols and components across diverse geographic regions.
- Rapid globalization is a powerful driver for the industrial safety integrated components market, compelling multinational corporations to standardize safety protocols and creating a predictable, high-volume demand for certified hardware.
- This trend ensures a factory in an emerging market is equipped with the same high-quality safety-rated encoders and redundant control systems as one in North America, harmonizing safety standards globally.
- As a result, regions adopting international codes see a 15% increase in foreign direct investment in their manufacturing sectors.
- The integration of global supply chains necessitates a uniform approach to risk management, where a failure in one node can have significant ripple effects.
- This interconnectedness forces companies to maintain high standards, as their products are scrutinized by diverse regulatory bodies, pushing the adoption of advanced functional safety standards.
What are the market trends shaping the Industrial Safety Integrated Components Industry?
- The growth of the HVDC industry is emerging as a significant trend, influencing the design and application of specialized safety integrated components within the power transmission sector.
- The growing demand for smart industries is driving a paradigm shift where safety is a core component of the intelligent production process, reducing unplanned safety stops by over 25% compared to legacy systems. This trend enables predictive maintenance, where a safety light curtain can alert a maintenance team before its optical sensor fails.
- This proactive, data-driven approach to safety enhances worker protection and improves overall equipment effectiveness. The adoption of collaborative robot safety and automated guided vehicle protection relies on high-fidelity safety scanners and AI-driven proximity sensors.
- The data from these smart devices is used to optimize production floor layouts and identify behavioral patterns that might lead to hazards, with facilities reporting a 10% increase in layout efficiency.
What challenges does the Industrial Safety Integrated Components Industry face during its growth?
- The high investment required for the automation and installation of industrial safety systems remains a key challenge, particularly for small and medium-sized enterprises.
- The high initial investment for automation and installation of industrial safety systems remains a formidable barrier, often leading to a tiered adoption where only large corporations can afford the latest architectures. These capital expenditures, which can be 30% higher than for standard control systems, are often prohibitive for small and medium-sized enterprises operating on thin margins.
- This financial friction restricts the rapid diffusion of high-tech integrated safety controller systems and creates a fragmented safety landscape. The long return-on-investment period further complicates financial justification, as the primary benefit is risk mitigation rather than direct production output. Consequently, many businesses delay implementation, with over 40% of smaller manufacturers continuing to rely on outdated or non-compliant safety measures.
Exclusive Technavio Analysis on Customer Landscape
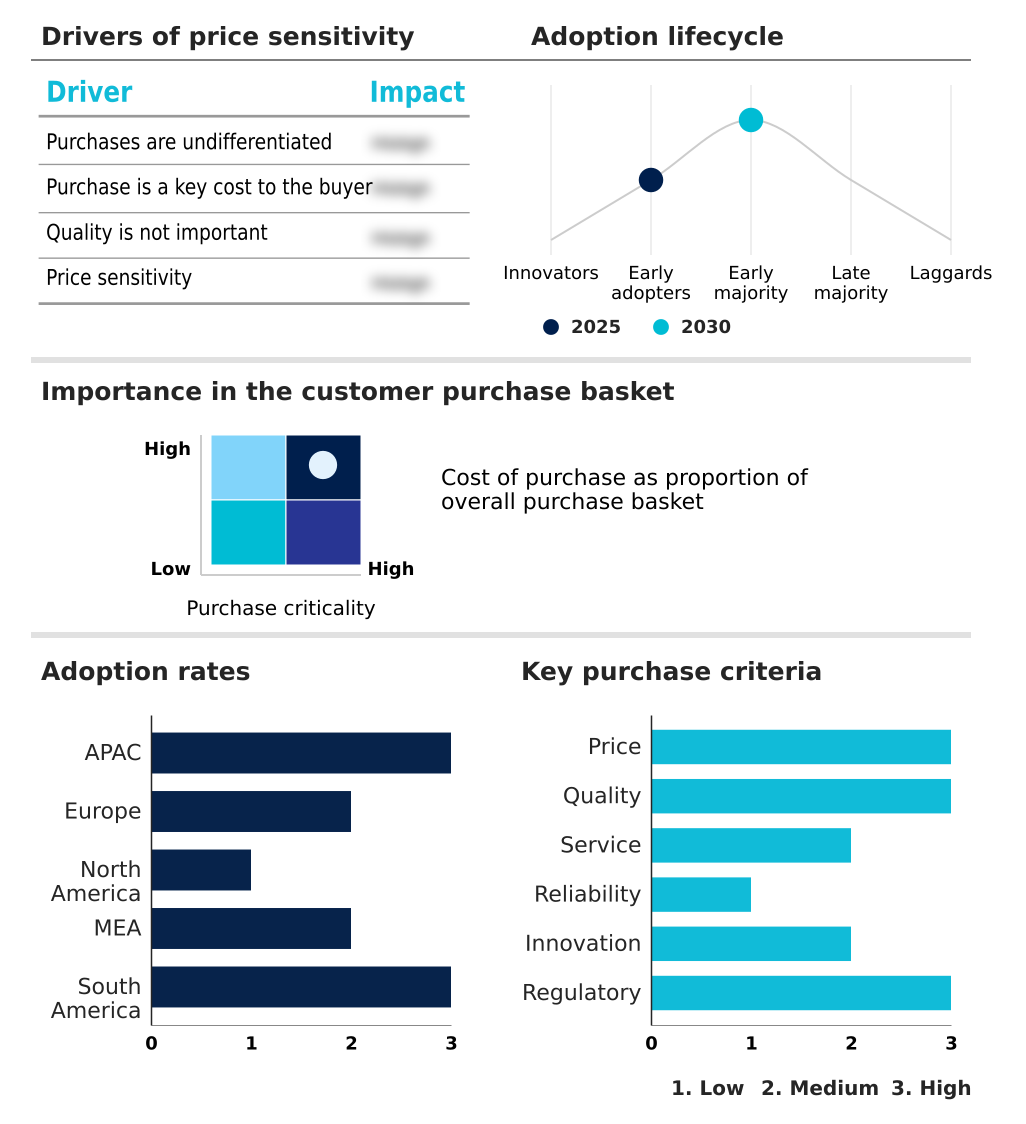
The industrial safety integrated components market forecasting report includes the adoption lifecycle of the market, covering from the innovator’s stage to the laggard’s stage. It focuses on adoption rates in different regions based on penetration. Furthermore, the industrial safety integrated components market report also includes key purchase criteria and drivers of price sensitivity to help companies evaluate and develop their market growth analysis strategies.
Customer Landscape of Industrial Safety Integrated Components Industry
Competitive Landscape
Companies are implementing various strategies, such as strategic alliances, industrial safety integrated components market forecast, partnerships, mergers and acquisitions, geographical expansion, and product/service launches, to enhance their presence in the industry.
ABB Ltd. - Offerings encompass a range of industrial safety integrated components, engineered to ensure regulatory compliance and enhance safety in complex automated industrial environments.
The industry research and growth report includes detailed analyses of the competitive landscape of the market and information about key companies, including:
- ABB Ltd.
- Baker Hughes Co.
- Balluff GmbH
- Beckhoff Automation GmbH
- Eaton Corp. Plc
- Emerson Electric Co.
- EUCHNER GmbH Co. KG
- Halma Plc
- HIMA Paul Hildebrandt GmbH
- Honeywell International Inc.
- Johnson Controls International
- Keyence Corp.
- Mitsubishi Electric Corp.
- OMRON Corp.
- Pepperl and Fuchs SE
- Pilz GmbH and Co. KG
- Rockwell Automation Inc.
- Schneider Electric SE
- SICK AG
- Siemens AG
Qualitative and quantitative analysis of companies has been conducted to help clients understand the wider business environment as well as the strengths and weaknesses of key industry players. Data is qualitatively analyzed to categorize companies as pure play, category-focused, industry-focused, and diversified; it is quantitatively analyzed to categorize companies as dominant, leading, strong, tentative, and weak.
Market Intelligence Radar: High-Impact Developments & Growth Signals
- In the Industrial Machinery and Supplies and Components industry, the widespread adoption of digital twin technology for machine design and process simulation is creating a direct need for industrial safety integrated components that offer rich data outputs for virtual modeling, impacting demand for devices with enhanced predictive safety analytics.
- The integration of collaborative robots into production lines has fundamentally altered machine risk assessment protocols, driving demand for advanced, non-physical industrial safety integrated components like collaborative robot safety systems and zone protection scanners, which allow for safe human-robot interaction without traditional caging.
- Increasingly stringent environmental, social, and governance (ESG) mandates and worker safety regulations are compelling manufacturers to adopt higher functional safety management levels, such as SIL 3, which in turn boosts demand for certified industrial safety integrated components that comply with rigorous international standards like IEC 61508.
- A strategic shift toward modular and flexible manufacturing to improve supply chain resilience is accelerating the adoption of industrial safety integrated components that support rapid line reconfiguration, such as systems utilizing wireless safety communication and adaptable safety PLC programming, which can reduce changeover downtime by up to 30%.
Dive into Technavio’s robust research methodology, blending expert interviews, extensive data synthesis, and validated models for unparalleled Industrial Safety Integrated Components Market insights. See full methodology.
| Market Scope | |
|---|---|
| Page number | 319 |
| Base year | 2025 |
| Historic period | 2020-2024 |
| Forecast period | 2026-2030 |
| Growth momentum & CAGR | Accelerate at a CAGR of 6.1% |
| Market growth 2026-2030 | USD 2475.1 million |
| Market structure | Fragmented |
| YoY growth 2025-2026(%) | 5.8% |
| Key countries | China, Japan, India, South Korea, Australia, Indonesia, Germany, UK, France, Italy, Spain, The Netherlands, US, Canada, Mexico, Saudi Arabia, UAE, South Africa, Turkey, Israel, Brazil, Argentina and Chile |
| Competitive landscape | Leading Companies, Market Positioning of Companies, Competitive Strategies, and Industry Risks |
Research Analyst Overview
- The industrial safety integrated components market ecosystem is a complex network where raw material suppliers provide specialized semiconductors and polymers to component manufacturers, who then produce certified devices like safety relays and PLCs. These manufacturers invest heavily in R&D to meet standards set by regulatory bodies, a process that can increase development costs by over 20%.
- The resulting products are then brought to market through a combination of direct sales forces and specialized distributors. End-users, primarily in the automotive, energy, and manufacturing sectors, integrate these components to comply with safety mandates and improve operational efficiency. For instance, proper implementation can reduce machine downtime by an average of 15%.
- Supporting entities, including systems integrators and engineering consultants, play a crucial role in designing and validating these complex safety systems, ensuring they are effectively deployed.
What are the Key Data Covered in this Industrial Safety Integrated Components Market Research and Growth Report?
-
What is the expected growth of the Industrial Safety Integrated Components Market between 2026 and 2030?
-
The Industrial Safety Integrated Components Market is expected to grow by USD 2.48 billion during 2026-2030, registering a CAGR of 6.1%. Year-over-year growth in 2026 is estimated at 5.8%%. This acceleration is shaped by rapid globalization of industries, which is intensifying demand across multiple end-use verticals covered in the report.
-
-
What segmentation does the market report cover?
-
The report is segmented by Product (Safety relays and sensors, Transmitter, Safety PLC, Safety switch, and Others), End-user (Energy and power, Automotive, Oil and gas, Chemical and petrochemical, and Others), Application (Factory automation, Safety building security, and Public facilities) and Geography (APAC, Europe, North America, Middle East and Africa, South America). Among these, the Safety relays and sensors segment is estimated to witness significant growth during the forecast period, driven by rising adoption across key application areas. Each segment includes detailed qualitative and quantitative analysis, along with historical data from 2020-2024 and forecasts through 2030 with year-over-year growth rates.
-
-
Which regions are analyzed in the report?
-
The report covers APAC, Europe, North America, Middle East and Africa and South America. APAC is estimated to contribute 45.6% to market growth during the forecast period. Country-level analysis includes China, Japan, India, South Korea, Australia, Indonesia, Germany, UK, France, Italy, Spain, The Netherlands, US, Canada, Mexico, Saudi Arabia, UAE, South Africa, Turkey, Israel, Brazil, Argentina and Chile, with dedicated market size tables and year-over-year growth for each.
-
-
What are the key growth drivers and market challenges?
-
The primary driver is rapid globalization of industries, which is accelerating investment and industry demand. The main challenge is high investments required for automation and installation of industrial safety systems, creating operational barriers for key market participants. The report quantifies the impact of each driver and challenge across 2026 and 2030 with comparative analysis.
-
-
Who are the major players in the Industrial Safety Integrated Components Market?
-
Key vendors include ABB Ltd., Baker Hughes Co., Balluff GmbH, Beckhoff Automation GmbH, Eaton Corp. Plc, Emerson Electric Co., EUCHNER GmbH Co. KG, Halma Plc, HIMA Paul Hildebrandt GmbH, Honeywell International Inc., Johnson Controls International, Keyence Corp., Mitsubishi Electric Corp., OMRON Corp., Pepperl and Fuchs SE, Pilz GmbH and Co. KG, Rockwell Automation Inc., Schneider Electric SE, SICK AG and Siemens AG. The report provides qualitative and quantitative analysis categorizing companies as dominant, leading, strong, tentative, and weak based on their market positioning. Company profiles include business segment analysis, SWOT assessment, key offerings, and recent strategic developments.
-
Market Research Insights
- The competitive landscape for industrial safety integrated components is intensely focused on technological differentiation, with the top five vendors accounting for over 45% of the market share. Key players like Siemens AG and Rockwell Automation Inc. are shifting their strategies from selling individual components to offering complete, integrated safety platforms.
- For example, recent product launches have centered on controllers with native cloud connectivity, a direct response to enterprise demand for centralized, remote diagnostic capabilities across global facilities. This focus on software-defined safety helps address the industry-wide challenge of a skilled labor shortage by simplifying system management and reducing configuration complexity.
- However, these advancements are tempered by persistent supply chain pressures on specialized semiconductors, which can impact production timelines and increase costs for all market participants.
We can help! Our analysts can customize this industrial safety integrated components market research report to meet your requirements.
 RIA -
RIA - 
