Industrial Solvents Market Size 2024-2028
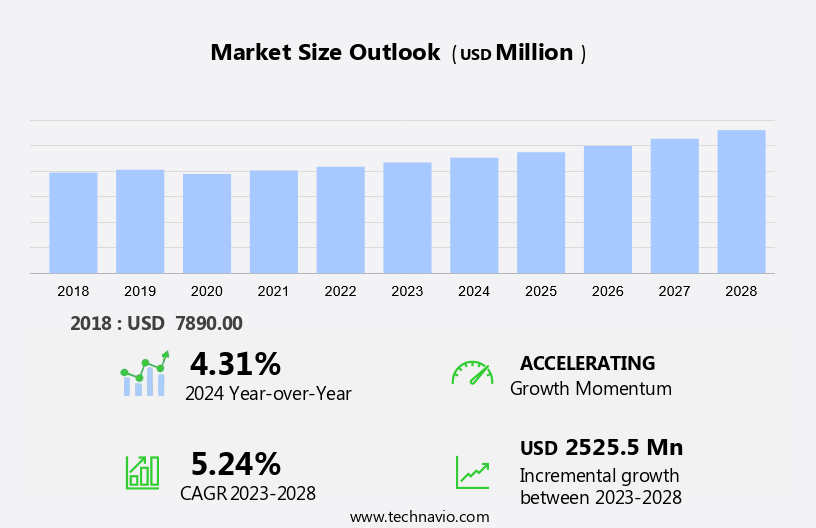
The industrial solvents market size is forecast to increase by USD 2.53 billion at a CAGR of 5.24% between 2023 and 2028. The market is experiencing significant growth due to several key drivers. One major factor is the increasing demand for oxygenated solvents in various industries, including consumer electronics and appliances. Additionally, there is a rising trend toward using low-volatile organic compound (VOC) and zero-VOC formulations to meet environmental regulations. Strict regulations on the use of industrial solvents, particularly in healthcare and medicine production for medical encapsulation, further fuel market growth. Alcohol continues to be a prominent industrial solvent, accounting for a significant share of chemical sales. This market analysis report provides an in-depth examination of these trends and the challenges they present to market participants.
What will the size of the market be during the forecast period?
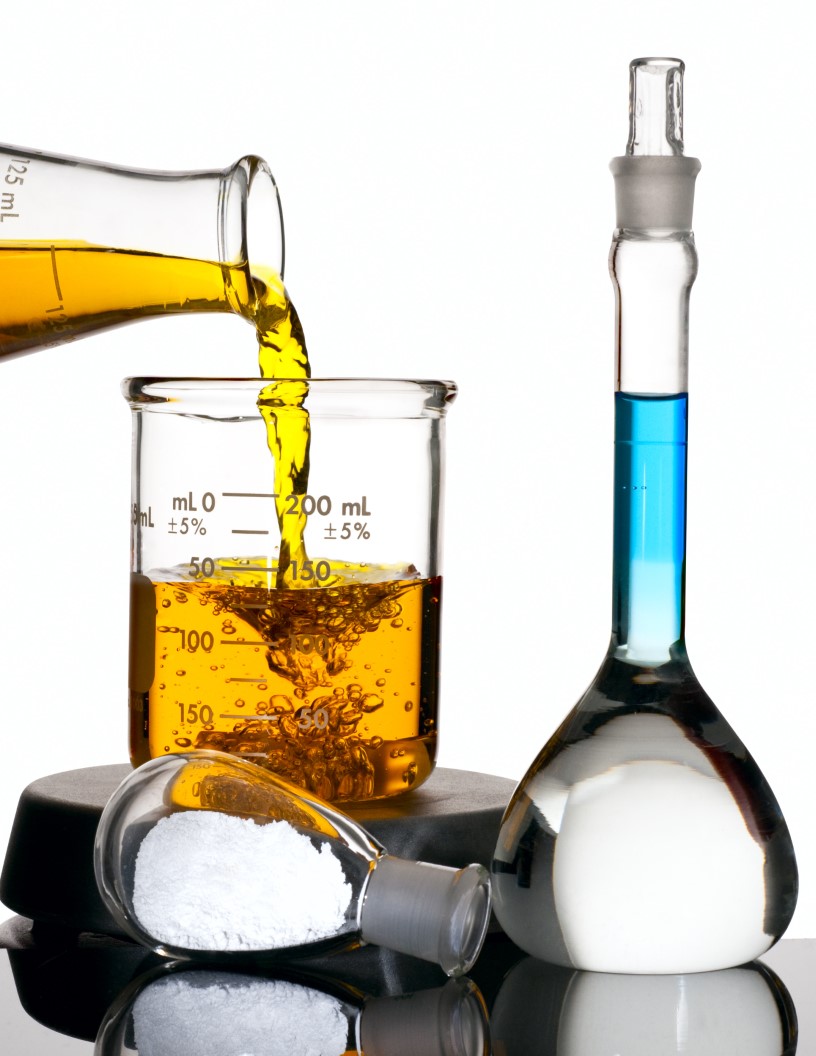
Industrial Solvents are chemical compounds used in various industries for different applications such as Paints and coatings, Electronics, Bulk chemicals, Oil and gas, Agrochemical sector, and Textile Industries. The market for Industrial Solvents is significant due to their extensive usage in various industrial processes. The demand for sustainable solvents derived from renewable feedstocks is on the rise due to increasing environmental concerns. Butane and Propane are commonly used Industrial Solvents in industries like Oil Refining and Recovery. Further, industrial Solvents are also used in the production of Adhesives, Sealants, and in Photographic Reproduction. They are used in the Rubber industry for the production of synthetic rubbers. Volatile Organic Compounds (VOCs) are a concern in the market due to their impact on the environment. Therefore, there is a growing trend towards the use of low-VOC and zero-VOC solvents. The market includes key applications such as Industrial processes, Oil and gas, Dissolution agents, Cleansing, Degreasing, Purification, Agrochemical sector, Butane, Propane, Adhesive, Sealant, Pesticides, Photographic Reproduction, Textile Industries, Oil Refining, Recovery, Dry Cleaning, and Rubber.
Market Segmentation
The market research report provides comprehensive data (region-wise segment analysis), with forecasts and estimates in "USD million" for the period 2024-2028, as well as historical data from 2018-2022 for the following segments.
- Type
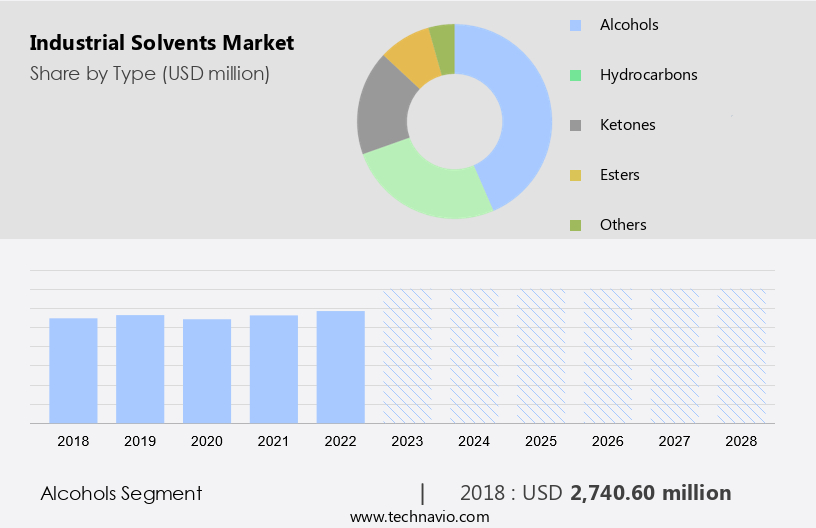
- Alcohols
- Hydrocarbons
- Ketones
- Esters
- Others
- End-user
- Paints and coatings
- Pharmaceuticals
- Adhesives
- Printing Inks
- Others
- Geography
- APAC
- China
- India
- Japan
- North America
- US
- Europe
- Germany
- UK
- South America
- Middle East and Africa
- APAC
By Type Insights
The alcohols segment is estimated to witness significant growth during the forecast period. Alcohols, including ethanol, isopropyl alcohol, and methanol, serve as efficient solvents for various substances, such as oils, fats, resins, and polymers. This versatility makes them indispensable in numerous industries, including pharmaceuticals, cosmetics, paints, and cleaning products. Alcohols' strong solvent properties enable them to dissolve both polar and non-polar compounds effectively. This attribute is crucial in applications like food and cosmetic industries, where the efficient recovery of active ingredients is vital. Moreover, many alcohols, particularly ethanol, are biodegradable and eco-friendly. Their use contributes to minimizing the environmental impact related to solvent disposal, making them a safer alternative to solvents derived from petroleum sources.
Further, in photographic reproduction, VOCs are essential in the development process of photographic films and papers. The use of VOCs in these industries is essential, but their environmental impact can be significant due to their high toxicity and contribution to smog formation. Therefore, there is a growing demand for alternative, eco-friendly solvents to replace VOCs in various applications. However, their environmental impact can be significant, leading to the need for eco-friendly alternatives.
Get a glance at the market share of various segments Request Free Sample
The alcohols segment accounted for USD 2.74 billion in 2018 and showed a gradual increase during the forecast period.
Regional Insights
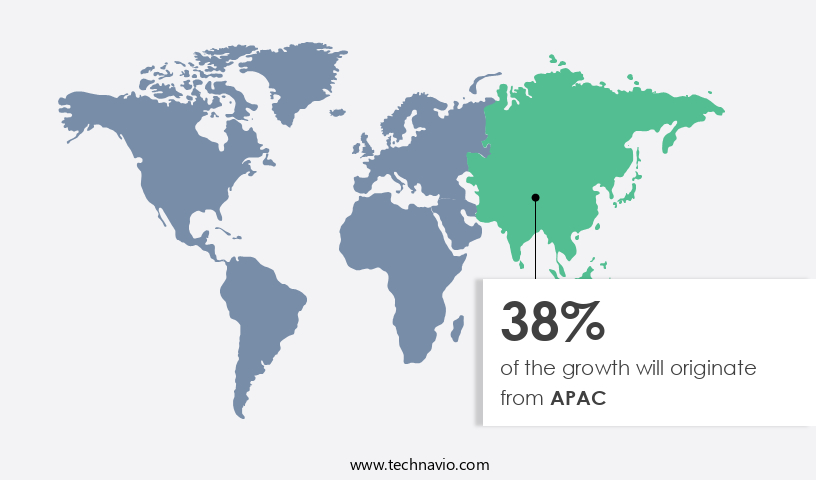
APAC is estimated to contribute 38% to the growth of the global market during the forecast period. Technavio's analysts have elaborately explained the regional trends and drivers that shape the market during the forecast period.
For more insights on the market share of various regions Request Free Sample
The market in Asia Pacific is experiencing significant growth, surpassing other global regions. This expansion is primarily attributed to the thriving manufacturing sectors, increasing industrialization, and rising disposable incomes in countries like China and India. Key end-use industries, including automotive, electronics, and construction, are major consumers of industrial solvents in the region. Moreover, there is a growing trend towards the adoption of sustainable solvents derived from renewable feedstocks. This shift is driven by increasing environmental awareness and stricter regulations. Emerging economies in Southeast Asia are contributing to market growth as they develop their industrial bases. The electronics and IT sectors in Asia Pacific are expanding rapidly, and the pharmaceutical and cosmetics industries are significant users of industrial solvents.
Further, the market is highly competitive, with both multinational corporations and local players vying for market share. The industrial processes in these sectors rely heavily on bulk chemicals, including industrial solvents, to manufacture their products efficiently and cost-effectively. In summary, the market in Asia Pacific is experiencing full-bodied growth due to the expanding manufacturing sectors, increasing industrialization, and the shift towards sustainable solvents. The region's electronics, IT, pharmaceutical, and cosmetics industries are major consumers of industrial solvents, making the market highly competitive.
Our researchers analyzed the data with 2023 as the base year, along with the key drivers, trends, and challenges. A holistic analysis of drivers will help companies refine their marketing strategies to gain a competitive advantage.
Market Driver
Growing demand for oxygenated solvents is notably driving market growth. Industrial solvents are essential chemical compounds utilized in various industries, including paints and coatings, electronics, bulk chemicals, oil and gas, agrochemicals, and healthcare. In the chemical field, they serve as dissolution agents, cleansing and degreasing agents, and purification agents.
Moreover, sustainable solvents derived from renewable feedstocks are gaining popularity due to environmental concerns. In the electronics sector, industrial solvents are integral to the production of computers, circuit boards, smartphones, networking devices, and consumer electronics. Thus, such factors are driving the growth of the market during the forecast period.
Market Trends
Rising shift toward low-VOC and zero-VOC formulations is the key trend in the market. Industrial solvents play a vital role in various industries, including paints and coatings, electronics, bulk chemicals, oil and gas, agrochemicals, and healthcare. These chemical compounds are essential for dissolution agents in industrial processes, cleansing and degreasing agents, and purification agents.
Moreover, in the electronics industry, solvents are used in the production of circuit boards, computers, smartphones, and networking devices. Sustainable solvents derived from renewable feedstocks are gaining popularity due to their eco-friendly nature. Thus, such trends will shape the growth of the market during the forecast period.
Market Challenge
Stringent regulations on use of industrial solvents is the major challenge that affects the growth of the market. Industrial solvents are essential chemical compounds used in various industries, including paints and coatings, electronics, bulk chemicals, oil and gas, agrochemical sector, and healthcare. These solvents serve multiple functions such as dissolution agents, cleansing and degreasing agents, and purification agents.
Moreover, in the paints and coatings industry, solvents like butane, propane, hexane, isopropyl alcohol, and ethanol are widely used. In the electronics sector, solvents are integral to the production of circuit boards, computers, smartphones, networking devices, and consumer electronics. Hence, the above factors will impede the growth of the market during the forecast period.
Exclusive Customer Landscape
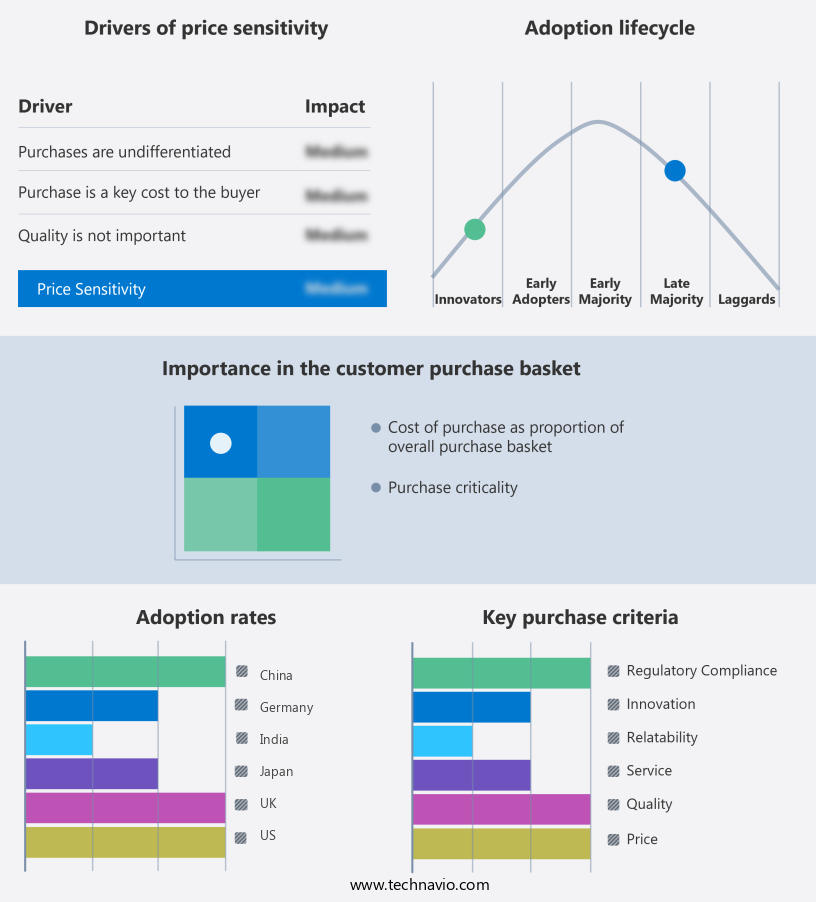
The market forecasting report includes the adoption lifecycle of the market, covering from the innovator's stage to the laggard's stage. It focuses on adoption rates in different regions based on penetration. Furthermore, the report also includes key purchase criteria and drivers of price sensitivity to help companies evaluate and develop their market growth analysis strategies.
Customer Landscape
Key Companies & Market Insights
Companies are implementing various strategies, such as strategic alliances, partnerships, mergers and acquisitions, geographical expansion, and product/service launches, to enhance their presence in the market.
Arkema SA: The company offers Industrial Solvents such as oxygenated solvents, acetone derivatives, used for chemical synthesis as diluents or as functional additives.
The market research and growth report includes detailed analyses of the competitive landscape of the market and information about key companies, including:
- BASF SE
- Chevron Phillips Chemical Co. LLC
- Clariant AG
- Dow Inc.
- Eastman Chemical Co.
- Exxon Mobil Corp.
- Honeywell International Inc.
- Huntsman Corp.
- Idemitsu Kosan Co. Ltd.
- Industrial Solvents and Chemicals Pvt. Ltd.
- INEOS AG
- LyondellBasell Industries N.V.
- Reliance Industries Ltd.
- Sasol Ltd.
- SATELLITE CHEMICAL CO. LTD.
- Shell plc
- Sydney Solvents
- TotalEnergies SE
- Trice Chemicals Industries LLC
Qualitative and quantitative analysis of companies has been conducted to help clients understand the wider business environment as well as the strengths and weaknesses of key market players. Data is qualitatively analyzed to categorize companies as pure play, category-focused, industry-focused, and diversified; it is quantitatively analyzed to categorize companies as dominant, leading, strong, tentative, and weak.
Research Analyst Overview
Industrial solvents play a crucial role in various industries, including electronics, oil and gas, paints and coatings, and bulk chemicals. These chemical compounds are essential for processes such as dissolution agents in electronics manufacturing, degreasing in metal industries, and solvents in oil refining. In the electronics sector, solvents are used in the production of computers, circuit boards, smartphones, and networking devices. The demand for sustainable solvents derived from renewable feedstocks is increasing due to the growing focus on green chemistry. Industrial solvents find extensive applications in the agrochemical sector, where they are used as intermediates in the production of pesticides. They are also used as Dissolution agents, Cleansing, and Degreasing agents. In the Electronics industry, Industrial Solvents are used for Purification processes. In the Agrochemical sector, they are used as intermediates in the production of Pesticides.
Further, in the healthcare sector, industrial solvents are used in medicine production and medical encapsulation. The market includes a wide range of chemical types, such as hydrocarbons, alcohols, ketones, chlorinated solvents, esters, and others. Some commonly used industrial solvents include butane, propane, hexane, isopropyl alcohol, and ethanol. Waste solvents are also gaining popularity due to recycling and the reduction of volatile organic compounds (VOCs) emissions. Industrial solvents are used in various industries, including textiles, oil refining, recovery, dry cleaning, rubber, polymer, fuel additives, and adhesives and sealants. They are also used in industries such as paints and coatings, printing ink, cosmetics, and the residential and infrastructure sectors.
|
Market Scope |
|
|
Report Coverage |
Details |
|
Page number |
220 |
|
Base year |
2023 |
|
Historic period |
2018-2022 |
|
Forecast period |
2024-2028 |
|
Growth momentum & CAGR |
Accelerate at a CAGR of 5.24% |
|
Market growth 2024-2028 |
USD 2.53 billion |
|
Market structure |
Fragmented |
|
YoY growth 2023-2024(%) |
4.31 |
|
Regional analysis |
APAC, North America, Europe, South America, and Middle East and Africa |
|
Performing market contribution |
APAC at 38% |
|
Key countries |
China, US, Germany, India, UK, and Japan |
|
Competitive landscape |
Leading Companies, Market Positioning of Companies, Competitive Strategies, and Industry Risks |
|
Key companies profiled |
Arkema SA, BASF SE, Chevron Phillips Chemical Co. LLC, Clariant AG, Dow Inc., Eastman Chemical Co., Exxon Mobil Corp., Honeywell International Inc., Huntsman Corp., Idemitsu Kosan Co. Ltd., Industrial Solvents and Chemicals Pvt. Ltd., INEOS AG, LyondellBasell Industries N.V., Reliance Industries Ltd., Sasol Ltd., SATELLITE CHEMICAL CO. LTD., Shell plc, Sydney Solvents, TotalEnergies SE, and Trice Chemicals Industries LLC |
|
Market dynamics |
Parent market analysis, market growth inducers and obstacles, market forecast, fast-growing and slow-growing segment analysis, COVID-19 impact and recovery analysis and future consumer dynamics, market condition analysis for the forecast period |
|
Customization purview |
If our market report has not included the data that you are looking for, you can reach out to our analysts and get segments customized. |
What are the Key Data Covered in this Market Research and Growth Report?
- CAGR of the market during the forecast period
- Detailed information on factors that will drive the market growth and forecasting between 2024 and 2028
- Precise estimation of the size of the market and its contribution of the market in focus to the parent market
- Accurate predictions about upcoming market growth and trends and changes in consumer behaviour
- Growth of the market across APAC, North America, Europe, South America, and Middle East and Africa
- Thorough analysis of the market's competitive landscape and detailed information about companies
- Comprehensive analysis of factors that will challenge the growth of market companies
We can help! Our analysts can customize this market research report to meet your requirements. Get in touch
 RIA -
RIA - 
