Industrial Vacuum Valves Market Analysis APAC, North America, Europe, South America, Middle East and Africa - China, US, South Korea, UK, Japan - Size and Forecast 2024-2028

Industrial Vacuum Valves Market Analysis APAC, North America, Europe, South America, Middle East and Africa - China, US, South Korea, UK, Japan - Size and Forecast 2024-2028

Published: May 2024 180 Pages SKU: IRTNTR45666

Market Overview at a Glance

$526.2 Mn
Market Opportunity
6.65%
CAGR
6.12
YoY growth 2023-2024(%)

Industrial Vacuum Valves Market Size 2024-2028

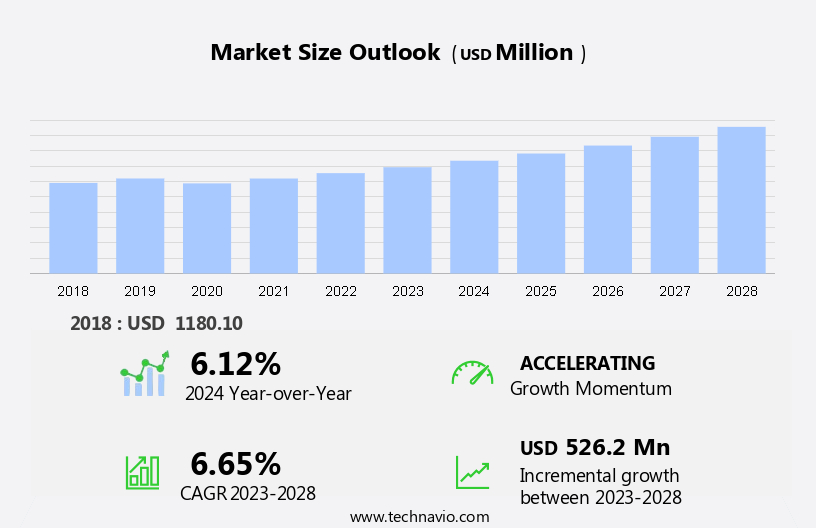
The industrial vacuum valves market size is forecast to increase by USD 526.2 million, at a CAGR of 6.65% between 2023 and 2028. Market growth analysis aligned with the augmented production of smartphones has sparked a surge in investments aimed at modernizing industrial facilities. This trend is further fueled by the growing demand for various commodities. As smartphone usage continues to rise globally, manufacturers are ramping up their production capacities to meet consumer needs. This has led to substantial investments in upgrading and modernizing industrial facilities to enhance efficiency, output, and technological capabilities. Additionally, the growing demand for various commodities across industries has prompted businesses to expand and innovate their production processes. This includes sectors such as electronics, automotive, and consumer goods, where the need for raw materials and finished products is continuously increasing. The confluence of increased smartphone production, investments in industrial modernization, and rising demand for commodities underscores the dynamic nature of the contemporary market landscape, driving innovation and economic growth. Our report examines historic data from 2018 - 2022, besides analyzing the current and forecasts market scenario.

Market Forecasting and Size

Industrial Vacuum Valves Market Size

Market Forecast 2024-2028

To learn more about this market report,  Request Free Sample

Market Dynamics

The market is being propelled by the increasing adoption of automation and the continuous emphasis on improved maintenance practices. As industries such as power plants, semiconductor manufacturing, and chemicals embrace automation, there is a growing need for efficient vacuum valves to optimize processes and ensure smooth operations. Additionally, the emergence of smart valves equipped with IoT capabilities is revolutionizing maintenance strategies by enabling real-time monitoring and predictive maintenance, thereby minimizing downtime and enhancing overall productivity. Furthermore, several trends are shaping the Industrial Vacuum Valves market. Our researchers studied the market research and growth data for years, with 2023 as the base year and 2023 as the estimated year, and presented the key drivers, trends, and challenges for the market.

Key Driver- Growing demand for different commodities

The industrial vacuum valve market is experiencing a surge in demand driven by various factors. Firstly, rising consumer spending worldwide is leading to increased demand for pharmaceuticals, food products, automobiles, and household appliances. This heightened demand across diverse sectors is fostering steady economic development, propelling growth within each industry. Moreover, economic expansion positively influences consumer confidence, spurring further purchases and stimulating industrial and manufacturing activities.

Furthermore, shifts in lifestyle and dietary habits, coupled with a rise in chronic diseases, are fueling the need for pharmaceuticals across different therapeutic areas. This escalating demand necessitates heightened manufacturing activities in pharmaceuticals, food processing, chemicals, and other key industries such as automotive, electronics, and construction aggregates. As these industries are significant end users of vacuum valves, the global industrial vacuum valve market is poised for substantial growth in the forecast period.

Significant Trends- Incorporation of simulation software in valve manufacturing

Market players can use 3D simulation software to address customer needs in terms of design requirements and applications. Vacuum valve design simulation helps suppliers reduce manufacturing costs and product development time when manufacturing non-standard valves. This simulation software can also be used to analyze and test solutions during the design phase without creating multiple prototypes.

Moreover, valve manufacturing (for new valve designs) can take up to several weeks, so engineering simulation can help significantly reduce time and effort. Advanced 3D simulation software has been observed to speed up the prototype testing process and improve valve manufacturing. This simulation method also helps to improve valve design functionality and minimize physical testing and associated costs. Thus, such factors will drive the growth of the market during the forecast period. 

Major Challenge- Price wars among companies and competition from local market players

If market participants incur additional implementation and maintenance costs, this will impact pricing strategies. On the other hand, customers are looking for high-quality, low-cost valves with additional features. These factors force market players to lower the price of their products to increase their market share. This requires market players to continually revise their pricing strategies to generate more revenue and invest in research and development.

Additionally, various economic factors allow domestic manufacturers in developing countries such as India, China, South Africa, and Brazil to provide end users with high-quality valves at lower costs while putting some international suppliers at a disadvantage. As a result, the threat of low-cost suppliers limits the entry of international suppliers in developing countries, especially  APAC, thereby impeding the growth of the market during the forecast period.

Market Segmentation

In the market, the rapidly growing semiconductor industry, driven by the demand for memory chips and transistors in various electronic devices, is a significant driver of market growth.It plays a critical role in semiconductor manufacturing processes, such as thin-film coating and flat-panel display production, where precise vacuum control is essential for ensuring product quality. Moreover, the increasing integration of IoT, wireless communications, AI, and cloud computing technologies in industrial applications, including automotive electronics and consumer electronics like smartphones, is driving the demand for advanced equipmet capable of meeting the stringent performance requirements of modern manufacturing processes.

End-user Segment Analysis:

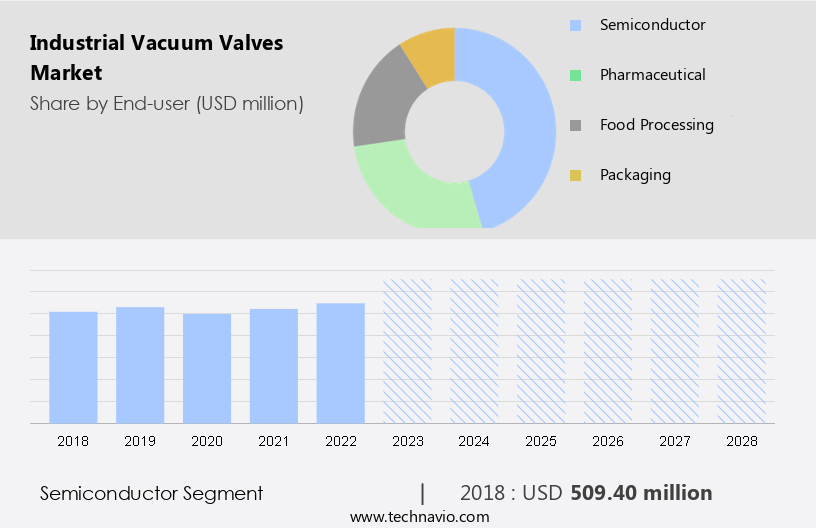
The semiconductor segment will account for a major share of the market's growth during the forecast period.?The semiconductor industry is anticipated to grow due to factors such as increased investment in 5G by countries such as China, expansion of server farms for cloud and streaming services, and increased adoption of AI in industries such as manufacturing. Additionally, the increasing adoption of four major programmable semiconductor technologies is driving the growth of the semiconductor industry which includes graphics processing units (GPUs), field programmable gate arrays (FPGAs), microprocessor units (MPUs), and artificial intelligence (AI). 

Industrial Vacuum Valves Market Size

Customized Report as per your requirements!

The semiconductor segment was valued at USD 509.40 million in 2018. Additionally, the entire semiconductor industry makes heavy use of the systems during the manufacturing process. The devices are used in processes such as etching and sputtering as well as wafer ion implantation processes in chambers. They are used to remove exhaust air from the vacuum chamber and supply atmospheric pressure to the chamber. Therefore, the growth in the semiconductor industry will drive the growth of the market during the forecast period.

Type Segment Analysis 

Based on type, the market has been segmented into low vacuum valves, high valves, and ultra high valves. The low valves?segment will account for the largest share of this segment.? The high demand for this is driven by a variety of industries and applications where precise control of vacuum levels is important. These are used in equipment such as vacuum chambers, mass spectrometers, and electron microscopes. In addition, these are used in the semiconductor industry, pharmaceutical companies, biotechnology companies, and the aerospace industry. As the industry continues to evolve and demands more precise control of processes, the demand for high-quality products is expected to remain strong and is expected to drive market growth during the forecast period.

Regional Analysis

Industrial Vacuum Valves Market Share by Geography

For more insights on the market share of various regions Download Sample PDF now!

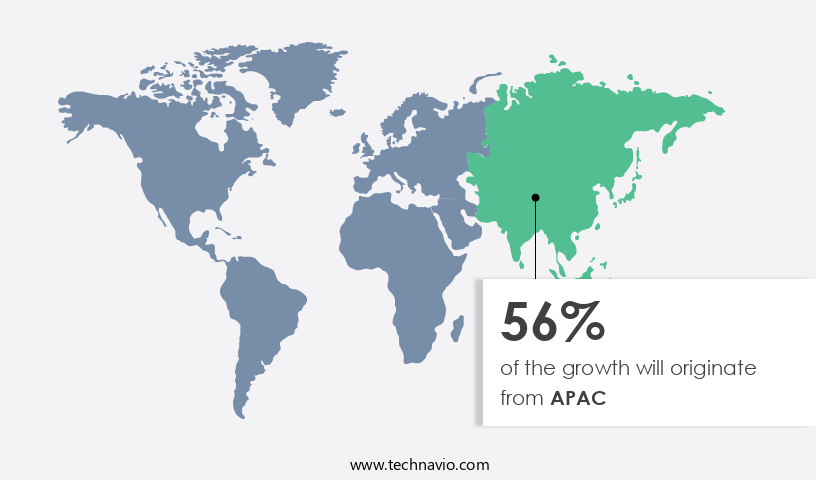
APAC is estimated to contribute 56% to the growth by 2028. Technavio's analysts have provided extensive insight into the market forecasting, detailing the regional trends and drivers influencing the market's trajectory throughout the forecast period. APAC is the manufacturing hub for most consumer durables, electronic products, and IT equipment. Some of the world's largest electronics companies and foundries have offices and branches in countries such as Taiwan, China, Japan, South Korea, and India, contributing significantly to the market.

Furthermore,  the demand for consumer electronic appliances is currently increasing in Asia, mainly due to technological advances, falling prices of home appliances, and rising per capita income. Semiconductors form the basic components of all these consumer electronic devices. Therefore, the increasing demand for semiconductors in the region will create ample opportunities for the market in the medium-term forecast period.

Key Companies & Market Insights

Companies are implementing various strategies, such as strategic alliances, partnerships, mergers and acquisitions, geographical expansion, and product/service launches, to enhance their presence in the market.

  • Agilent Technologies Inc.: The company offers industrial vacuum valves such as Metal UHV Valves Series 54, Aluminum Block Valves Series 26, and Aluminum Gate Valves Series 12.

We also have detailed analyses of the market’s competitive landscape and offer information on 20 market companies, including:

Agilent Technologies Inc., Atlas Copco AB, CKD Corp., Cryofab Inc., DeZURIK Inc., Elmac Technologies, Emerson Electric Co., Huntington Vacuum Products, Kurt J Lesker Co., MDC vacuum Products LLC, MKS Instruments Inc., Motherwell Tank Protection, Parker Hannifin Corp., Pfeiffer Vacuum Technology AG, Qigao Group, Ramen Valves AB, SMC Corp., Torr Marketing India Pvt. Ltd., VAG GmbH, and VAT Group AG

Technavio market forecast the an in-depth analysis of the market and its players through combined qualitative and quantitative data. The analysis classifies companies into categories based on their business approaches, including pure-play, category-focused, industry-focused, and diversified. Companies are specially categorized into dominant, leading, strong, tentative, and weak, based on their quantitative data analysis.  

Segment Overview

The market research report provides comprehensive data (region wise segment analysis), with forecasts and estimates in "USD Million" for the period 2024-2028, as well as historical data from 2018 - 2022 for the following segments.

  • End-user Outlook 
    • Semiconductor
    • Pharmaceutical
    • Food processing
    • Packaging
  • Type Outlook 
    • Low vacuum valves
    • High vacuum valves
    • Ultra high vacuum valves
  • Region Outlook 
    • North America
      • The U.S.
      • Canada
    • Europe
      • The U.K.
      • Germany
      • France
      • Rest of Europe
    • APAC
      • China
      • India
    • South America
      • Chile
      • Brazil
      • Argentina
    • Middle East & Africa
      • Saudi Arabia
      • South Africa
      • Rest of the Middle East & Africa

You may also interested in below market reports:

  • Rupture Disc Market: The rupture disc market is estimated to grow at a CAGR of 2.97% between 2022 and 2027. The size of the market is forecast to increase by USD 88.91 million. 
  • Metal Casting Market: The global metal casting market size is forecast to increase by USD 12.15 billion at a CAGR of 6.22% between 2023 and 2028. 
  • Brushless DC Motors MarketThe brushless DC motors market is estimated to grow at a CAGR of 4.07% between 2022 and 2027. The size of the market is forecast to increase by USD 2,586.75 million. 

Market Analyst Overview

The market is witnessing significant growth, driven by advancements such as IoT-integrated valves that offer enhanced functionality and control. These valves are crucial for fluid flow management techniques, ensuring precise isolation, pressure control, and gas flow direction in various applications across industries. In the semiconductor manufacturing industry, where vacuum purity is paramount, vacuum valves play a crucial role in processes such as extraction, refining, and semiconductor chip production. Moreover, in industries like flat-panel display manufacturing and analytical instruments manufacturing, vacuum valves are indispensable for processes involving indium–tin oxide (ITO) thin-film coatings, flexible displays, and high-resolution displays. The advent of IoT and machine learning further enhances valve performance and efficiency, enabling seamless integration with data storage systems and analytical instruments.

Additionally, vacuum valves are integral to critical operations in the food & beverage industry, facilitating processes like vacuum evaporation, de-aeration, and freeze-drying. As the demand for advanced displays and vacuum-based manufacturing processes continues to rise, propelled by innovations in technologies like CVD, PVD, MOCVD, and PECVD, the Industrial Vacuum Valves Market is poised for sustained growth. Despite restraints such as particle generation and outgassing, increasing adoption across R&D industries, semiconductor markets, and flat-panel display production industries underscores the market's promising trajectory. Further, the market is witnessing robust growth driven by diverse applications across industries such as paper & pulp, food & beverages, and the oil & gas sector. These valves, operating under various conditions including vacuum, argon atmospheres, and high pressure ranges, play a crucial role in critical processes like fractional distillation, vacuum filtration, and bottling. Additionally, advancements like IoT integration enable enhanced control and monitoring of vacuum systems, ensuring efficient operation. With increasing demand driven by emerging technologies like 5G cellular networks, semiconductor chips, and flat-panel display production, the Industrial Vacuum Valves Market is poised for continued expansion, catering to the evolving needs of diverse industrial sectors.

Market Scope

Report Coverage

Details

Page number

180

Base year

2023

Historic period

2018-2022

Forecast period

2024-2028

Growth momentum & CAGR

Accelerate at a CAGR of 6.65%

Market Growth 2024-2028

USD 526.2 million

Market structure

Fragmented

YoY growth 2023-2024(%)

6.12

Regional analysis

APAC, North America, Europe, South America, and Middle East and Africa

Performing market contribution

APAC at 56%

Key countries

China, US, South Korea, UK, and Japan

Competitive landscape

Leading Companies, Market Positioning of Companies, Competitive Strategies, and Industry Risks

Key companies profiled

Agilent Technologies Inc., Atlas Copco AB, CKD Corp., Cryofab Inc., DeZURIK Inc., Elmac Technologies, Emerson Electric Co., Huntington Vacuum Products, Kurt J Lesker Co., MDC vacuum Products LLC, MKS Instruments Inc., Motherwell Tank Protection, Parker Hannifin Corp., Pfeiffer Vacuum Technology AG, Qigao Group, Ramen Valves AB, SMC Corp., Torr Marketing India Pvt. Ltd., VAG GmbH, and VAT Group AG

Market dynamics

Parent market analysis, Market growth inducers and obstacles, Fast-growing and slow-growing segment analysis, COVID-19 impact and recovery analysis and future consumer dynamics, and market condition analysis for the forecast period. 

Customization purview

If our report has not included the data that you are looking for, you can reach out to our analysts and get segments customized.

Request Sample PDF 

What are the Key Data Covered in this Market Research Report?

  • CAGR of the market during the forecast period
  • Detailed information on factors that will drive the growth of the market between 2024 and 2028
  • Precise estimation of the market growth and trends and its contribution to the market in focus on the parent market
  • Accurate predictions about upcoming market trends and analysis and changes in consumer behavior
  • Market growth and forecasting across APAC, North America, Europe, South America, and Middle East and Africa
  • A thorough market analysis and report of the market’s competitive landscape and detailed information about companies
  • Comprehensive analysis of factors that will challenge the growth of market  companies

We can help! Our analysts can customize this market research report to meet your requirements. Get in touch

1 Executive Summary

  • 1.1 Market overview
    • Executive Summary - Chart on Market Overview
    • Executive Summary - Data Table on Market Overview
    • Executive Summary - Chart on Global Market Characteristics
    • Executive Summary - Chart on Market by Geography
    • Executive Summary - Chart on Market Segmentation by End-user
    • Executive Summary - Chart on Market Segmentation by Type
    • Executive Summary - Chart on Incremental Growth
    • Executive Summary - Data Table on Incremental Growth
    • Executive Summary - Chart on Company Market Positioning

2 Market Landscape

  • 2.1 Market ecosystem
    • Parent Market
    • Data Table on - Parent Market
  • 2.2 Market characteristics
    • Market characteristics analysis
  • 2.3 Value chain analysis
    • Value Chain Analysis

3 Market Sizing

  • 3.1 Market definition
    • Offerings of companies included in the market definition
  • 3.2 Market segment analysis
    • Market segments
  • 3.3 Market size 2023
    • 3.4 Market outlook: Forecast for 2023-2028
      • Chart on Global - Market size and forecast 2023-2028 ($ million)
      • Data Table on Global - Market size and forecast 2023-2028 ($ million)
      • Chart on Global Market: Year-over-year growth 2023-2028 (%)
      • Data Table on Global Market: Year-over-year growth 2023-2028 (%)

    4 Historic Market Size

    • 4.1 Global Industrial Vacuum Valves Market 2018 - 2022
      • Historic Market Size - Data Table on Global Industrial Vacuum Valves Market 2018 - 2022 ($ million)
    • 4.2 End-user segment analysis 2018 - 2022
      • Historic Market Size - End-user Segment 2018 - 2022 ($ million)
    • 4.3 Type segment analysis 2018 - 2022
      • Historic Market Size - Type Segment 2018 - 2022 ($ million)
    • 4.4 Geography segment analysis 2018 - 2022
      • Historic Market Size - Geography Segment 2018 - 2022 ($ million)
    • 4.5 Country segment analysis 2018 - 2022
      • Historic Market Size - Country Segment 2018 - 2022 ($ million)

    5 Five Forces Analysis

    • 5.1 Five forces summary
      • Five forces analysis - Comparison between 2023 and 2028
    • 5.2 Bargaining power of buyers
      • Bargaining power of buyers - Impact of key factors 2023 and 2028
    • 5.3 Bargaining power of suppliers
      • Bargaining power of suppliers - Impact of key factors in 2023 and 2028
    • 5.4 Threat of new entrants
      • Threat of new entrants - Impact of key factors in 2023 and 2028
    • 5.5 Threat of substitutes
      • Threat of substitutes - Impact of key factors in 2023 and 2028
    • 5.6 Threat of rivalry
      • Threat of rivalry - Impact of key factors in 2023 and 2028
    • 5.7 Market condition
      • Chart on Market condition - Five forces 2023 and 2028

    6 Market Segmentation by End-user

    • 6.1 Market segments
      • Chart on End-user - Market share 2023-2028 (%)
      • Data Table on End-user - Market share 2023-2028 (%)
    • 6.2 Comparison by End-user
      • Chart on Comparison by End-user
      • Data Table on Comparison by End-user
    • 6.3 Semiconductor - Market size and forecast 2023-2028
      • Chart on Semiconductor - Market size and forecast 2023-2028 ($ million)
      • Data Table on Semiconductor - Market size and forecast 2023-2028 ($ million)
      • Chart on Semiconductor - Year-over-year growth 2023-2028 (%)
      • Data Table on Semiconductor - Year-over-year growth 2023-2028 (%)
    • 6.4 Pharmaceutical - Market size and forecast 2023-2028
      • Chart on Pharmaceutical - Market size and forecast 2023-2028 ($ million)
      • Data Table on Pharmaceutical - Market size and forecast 2023-2028 ($ million)
      • Chart on Pharmaceutical - Year-over-year growth 2023-2028 (%)
      • Data Table on Pharmaceutical - Year-over-year growth 2023-2028 (%)
    • 6.5 Food processing - Market size and forecast 2023-2028
      • Chart on Food processing - Market size and forecast 2023-2028 ($ million)
      • Data Table on Food processing - Market size and forecast 2023-2028 ($ million)
      • Chart on Food processing - Year-over-year growth 2023-2028 (%)
      • Data Table on Food processing - Year-over-year growth 2023-2028 (%)
    • 6.6 Packaging - Market size and forecast 2023-2028
      • Chart on Packaging - Market size and forecast 2023-2028 ($ million)
      • Data Table on Packaging - Market size and forecast 2023-2028 ($ million)
      • Chart on Packaging - Year-over-year growth 2023-2028 (%)
      • Data Table on Packaging - Year-over-year growth 2023-2028 (%)
    • 6.7 Market opportunity by End-user
      • Market opportunity by End-user ($ million)
      • Data Table on Market opportunity by End-user ($ million)

    7 Market Segmentation by Type

    • 7.1 Market segments
      • Chart on Type - Market share 2023-2028 (%)
      • Data Table on Type - Market share 2023-2028 (%)
    • 7.2 Comparison by Type
      • Chart on Comparison by Type
      • Data Table on Comparison by Type
    • 7.3 Low vacuum valves - Market size and forecast 2023-2028
      • Chart on Low vacuum valves - Market size and forecast 2023-2028 ($ million)
      • Data Table on Low vacuum valves - Market size and forecast 2023-2028 ($ million)
      • Chart on Low vacuum valves - Year-over-year growth 2023-2028 (%)
      • Data Table on Low vacuum valves - Year-over-year growth 2023-2028 (%)
    • 7.4 High vacuum valves - Market size and forecast 2023-2028
      • Chart on High vacuum valves - Market size and forecast 2023-2028 ($ million)
      • Data Table on High vacuum valves - Market size and forecast 2023-2028 ($ million)
      • Chart on High vacuum valves - Year-over-year growth 2023-2028 (%)
      • Data Table on High vacuum valves - Year-over-year growth 2023-2028 (%)
    • 7.5 Ultra high vacuum valves - Market size and forecast 2023-2028
      • Chart on Ultra high vacuum valves - Market size and forecast 2023-2028 ($ million)
      • Data Table on Ultra high vacuum valves - Market size and forecast 2023-2028 ($ million)
      • Chart on Ultra high vacuum valves - Year-over-year growth 2023-2028 (%)
      • Data Table on Ultra high vacuum valves - Year-over-year growth 2023-2028 (%)
    • 7.6 Market opportunity by Type
      • Market opportunity by Type ($ million)
      • Data Table on Market opportunity by Type ($ million)

    8 Customer Landscape

    • 8.1 Customer landscape overview
      • Analysis of price sensitivity, lifecycle, customer purchase basket, adoption rates, and purchase criteria

    9 Geographic Landscape

    • 9.1 Geographic segmentation
      • Chart on Market share by geography 2023-2028 (%)
      • Data Table on Market share by geography 2023-2028 (%)
    • 9.2 Geographic comparison
      • Chart on Geographic comparison
      • Data Table on Geographic comparison
    • 9.3 APAC - Market size and forecast 2023-2028
      • Chart on APAC - Market size and forecast 2023-2028 ($ million)
      • Data Table on APAC - Market size and forecast 2023-2028 ($ million)
      • Chart on APAC - Year-over-year growth 2023-2028 (%)
      • Data Table on APAC - Year-over-year growth 2023-2028 (%)
    • 9.4 North America - Market size and forecast 2023-2028
      • Chart on North America - Market size and forecast 2023-2028 ($ million)
      • Data Table on North America - Market size and forecast 2023-2028 ($ million)
      • Chart on North America - Year-over-year growth 2023-2028 (%)
      • Data Table on North America - Year-over-year growth 2023-2028 (%)
    • 9.5 Europe - Market size and forecast 2023-2028
      • Chart on Europe - Market size and forecast 2023-2028 ($ million)
      • Data Table on Europe - Market size and forecast 2023-2028 ($ million)
      • Chart on Europe - Year-over-year growth 2023-2028 (%)
      • Data Table on Europe - Year-over-year growth 2023-2028 (%)
    • 9.6 South America - Market size and forecast 2023-2028
      • Chart on South America - Market size and forecast 2023-2028 ($ million)
      • Data Table on South America - Market size and forecast 2023-2028 ($ million)
      • Chart on South America - Year-over-year growth 2023-2028 (%)
      • Data Table on South America - Year-over-year growth 2023-2028 (%)
    • 9.7 Middle East and Africa - Market size and forecast 2023-2028
      • Chart on Middle East and Africa - Market size and forecast 2023-2028 ($ million)
      • Data Table on Middle East and Africa - Market size and forecast 2023-2028 ($ million)
      • Chart on Middle East and Africa - Year-over-year growth 2023-2028 (%)
      • Data Table on Middle East and Africa - Year-over-year growth 2023-2028 (%)
    • 9.8 China - Market size and forecast 2023-2028
      • Chart on China - Market size and forecast 2023-2028 ($ million)
      • Data Table on China - Market size and forecast 2023-2028 ($ million)
      • Chart on China - Year-over-year growth 2023-2028 (%)
      • Data Table on China - Year-over-year growth 2023-2028 (%)
    • 9.9 US - Market size and forecast 2023-2028
      • Chart on US - Market size and forecast 2023-2028 ($ million)
      • Data Table on US - Market size and forecast 2023-2028 ($ million)
      • Chart on US - Year-over-year growth 2023-2028 (%)
      • Data Table on US - Year-over-year growth 2023-2028 (%)
    • 9.10 South Korea - Market size and forecast 2023-2028
      • Chart on South Korea - Market size and forecast 2023-2028 ($ million)
      • Data Table on South Korea - Market size and forecast 2023-2028 ($ million)
      • Chart on South Korea - Year-over-year growth 2023-2028 (%)
      • Data Table on South Korea - Year-over-year growth 2023-2028 (%)
    • 9.11 UK - Market size and forecast 2023-2028
      • Chart on UK - Market size and forecast 2023-2028 ($ million)
      • Data Table on UK - Market size and forecast 2023-2028 ($ million)
      • Chart on UK - Year-over-year growth 2023-2028 (%)
      • Data Table on UK - Year-over-year growth 2023-2028 (%)
    • 9.12 Japan - Market size and forecast 2023-2028
      • Chart on Japan - Market size and forecast 2023-2028 ($ million)
      • Data Table on Japan - Market size and forecast 2023-2028 ($ million)
      • Chart on Japan - Year-over-year growth 2023-2028 (%)
      • Data Table on Japan - Year-over-year growth 2023-2028 (%)
    • 9.13 Market opportunity by geography
      • Market opportunity by geography ($ million)
      • Data Tables on Market opportunity by geography ($ million)

    10 Drivers, Challenges, and Opportunity/Restraints

    • 10.1 Market drivers
      • 10.2 Market challenges
        • 10.3 Impact of drivers and challenges
          • Impact of drivers and challenges in 2023 and 2028
        • 10.4 Market opportunities/restraints

          11 Competitive Landscape

          • 11.1 Overview
            • 11.2 Competitive Landscape
              • Overview on criticality of inputs and factors of differentiation
            • 11.3 Landscape disruption
              • Overview on factors of disruption
            • 11.4 Industry risks
              • Impact of key risks on business

            12 Competitive Analysis

            • 12.1 Companies profiled
              • Companies covered
            • 12.2 Market positioning of companies
              • Matrix on companies position and classification
            • 12.3 Agilent Technologies Inc.
              • Agilent Technologies Inc. - Overview
              • Agilent Technologies Inc. - Business segments
              • Agilent Technologies Inc. - Key news
              • Agilent Technologies Inc. - Key offerings
              • Agilent Technologies Inc. - Segment focus
            • 12.4 Atlas Copco AB
              • Atlas Copco AB - Overview
              • Atlas Copco AB - Business segments
              • Atlas Copco AB - Key news
              • Atlas Copco AB - Key offerings
              • Atlas Copco AB - Segment focus
            • 12.5 CKD Corp.
              • CKD Corp. - Overview
              • CKD Corp. - Business segments
              • CKD Corp. - Key offerings
              • CKD Corp. - Segment focus
            • 12.6 DeZURIK Inc.
              • DeZURIK Inc. - Overview
              • DeZURIK Inc. - Product / Service
              • DeZURIK Inc. - Key offerings
            • 12.7 Emerson Electric Co.
              • Emerson Electric Co. - Overview
              • Emerson Electric Co. - Business segments
              • Emerson Electric Co. - Key news
              • Emerson Electric Co. - Key offerings
              • Emerson Electric Co. - Segment focus
            • 12.8 Huntington Vacuum Products
              • Huntington Vacuum Products - Overview
              • Huntington Vacuum Products - Product / Service
              • Huntington Vacuum Products - Key offerings
            • 12.9 Kurt J Lesker Co.
              • Kurt J Lesker Co. - Overview
              • Kurt J Lesker Co. - Product / Service
              • Kurt J Lesker Co. - Key offerings
            • 12.10 MDC vacuum Products LLC
              • MDC vacuum Products LLC - Overview
              • MDC vacuum Products LLC - Product / Service
              • MDC vacuum Products LLC - Key offerings
            • 12.11 MKS Instruments Inc.
              • MKS Instruments Inc. - Overview
              • MKS Instruments Inc. - Business segments
              • MKS Instruments Inc. - Key offerings
              • MKS Instruments Inc. - Segment focus
            • 12.12 Parker Hannifin Corp.
              • Parker Hannifin Corp. - Overview
              • Parker Hannifin Corp. - Business segments
              • Parker Hannifin Corp. - Key news
              • Parker Hannifin Corp. - Key offerings
              • Parker Hannifin Corp. - Segment focus
            • 12.13 Pfeiffer Vacuum Technology AG
              • Pfeiffer Vacuum Technology AG - Overview
              • Pfeiffer Vacuum Technology AG - Business segments
              • Pfeiffer Vacuum Technology AG - Key offerings
              • Pfeiffer Vacuum Technology AG - Segment focus
            • 12.14 Qigao Group
              • Qigao Group - Overview
              • Qigao Group - Product / Service
              • Qigao Group - Key offerings
            • 12.15 SMC Corp.
              • SMC Corp. - Overview
              • SMC Corp. - Product / Service
              • SMC Corp. - Key offerings
            • 12.16 VAG GmbH
              • VAG GmbH - Overview
              • VAG GmbH - Product / Service
              • VAG GmbH - Key offerings
            • 12.17 VAT Group AG
              • VAT Group AG - Overview
              • VAT Group AG - Business segments
              • VAT Group AG - Key offerings
              • VAT Group AG - Segment focus

            13 Appendix

            • 13.1 Scope of the report
              • 13.2 Inclusions and exclusions checklist
                • Inclusions checklist
                • Exclusions checklist
              • 13.3 Currency conversion rates for US$
                • Currency conversion rates for US$
              • 13.4 Research methodology
                • Research methodology
              • 13.5 Data procurement
                • Information sources
              • 13.6 Data validation
                • Data validation
              • 13.7 Validation techniques employed for market sizing
                • Validation techniques employed for market sizing
              • 13.8 Data synthesis
                • Data synthesis
              • 13.9 360 degree market analysis
                • 360 degree market analysis
              • 13.10 List of abbreviations
                • List of abbreviations

              Research Methodology

              Technavio presents a detailed picture of the market by way of study, synthesis, and summation of data from multiple sources. The analysts have presented the various facets of the market with a particular focus on identifying the key industry influencers. The data thus presented is comprehensive, reliable, and the result of extensive research, both primary and secondary.

              INFORMATION SOURCES

              Primary sources

              • Manufacturers and suppliers
              • Channel partners
              • Industry experts
              • Strategic decision makers

              Secondary sources

              • Industry journals and periodicals
              • Government data
              • Financial reports of key industry players
              • Historical data
              • Press releases

              DATA ANALYSIS

              Data Synthesis

              • Collation of data
              • Estimation of key figures
              • Analysis of derived insights

              Data Validation

              • Triangulation with data models
              • Reference against proprietary databases
              • Corroboration with industry experts

              REPORT WRITING

              Qualitative

              • Market drivers
              • Market challenges
              • Market trends
              • Five forces analysis

              Quantitative

              • Market size and forecast
              • Market segmentation
              • Geographical insights
              • Competitive landscape

              Interested in this report?

              Get your sample now to see our research methodology and insights!

              Download Now

              Frequently Asked Questions

              Industrial Vacuum Valves market growth will increase by $ 526.2 mn during 2024-2028 .

              The Industrial Vacuum Valves market is expected to grow at a CAGR of 6.65% during 2024-2028 .

              Industrial Vacuum Valves market is segmented by End-user( Semiconductor, Pharmaceutical, Food processing, Packaging) Type( Low vacuum valves, High vacuum valves, Ultra high vacuum valves, South America, MEA)

              Agilent Technologies Inc., Atlas Copco AB, CKD Corp., Cryofab Inc., DeZURIK Inc., Elmac Technologies, Emerson Electric Co., Huntington Vacuum Products, Kurt J Lesker Co., MDC vacuum Products LLC, MKS Instruments Inc., Motherwell Tank Protection, Parker Hannifin Corp., Pfeiffer Vacuum Technology AG, Qigao Group, Ramen Valves AB, SMC Corp., Torr Marketing India Pvt. Ltd., VAG GmbH, VAT Group AG are a few of the key vendors in the Industrial Vacuum Valves market.

              APAC will register the highest growth rate of 56% among the other regions. Therefore, the Industrial Vacuum Valves market in APAC is expected to garner significant business opportunities for the vendors during the forecast period.

              China, US, South Korea, UK, Japan

              • Augmented production of smartphonesThe sales of smartphones are expected to grow during the forecast period. Largescale manufacturing activities in countries like China is the driving factor this market.
              • Taiwan is the driving factor this market.
              • South Korea is the driving factor this market.
              • Japan is the driving factor this market.
              • and Singapore indicate the demand for new is the driving factor this market.
              • advanced smartphones across the globe. The smartphone market is gradually approaching the maturity stage. However is the driving factor this market.
              • the shipments of smartphones are still growing is the driving factor this market.
              • which will lead to the growth of the semiconductor industry. The slow growth in mobile phone sales was majorly attributed to the market fragmentation in North America is the driving factor this market.
              • Western Europe is the driving factor this market.
              • and China is the driving factor this market.
              • as well as the drop in the ASPs of smartphones in developed countries. However is the driving factor this market.
              • there are still many regions where smartphones are still not widely available is the driving factor this market.
              • and the market penetration of smartphones in these areas will drive the growth of semiconductor manufacturing activities. Moreover is the driving factor this market.
              • major smartphone manufacturers such as Samsung is the driving factor this market.
              • Apple is the driving factor this market.
              • Huawei is the driving factor this market.
              • Xiaomi is the driving factor this market.
              • OPPO is the driving factor this market.
              • and others have been revolutionizing the world of smartphones by introducing new design features and powerful performance characteristics at affordable price ranges. This trend is expected to fuel smartphone sales during the forecast period. China is the driving factor this market.
              • Hong Kong is the driving factor this market.
              • Vietnam is the driving factor this market.
              • Singapore is the driving factor this market.
              • and Taiwan are major producers of smartphones is the driving factor this market.
              • and the growing smartphone market will spur the need for more semiconductor component manufacturing activities in the region. There is an exponential growth in the number of people accessing the Internet using smartphones as their prices have been declining with technological advances. For instance is the driving factor this market.
              • more people access social media platforms like Instagram is the driving factor this market.
              • Facebook is the driving factor this market.
              • WhatsApp is the driving factor this market.
              • Twitter is the driving factor this market.
              • and LinkedIn is the driving factor this market.
              • as well as banking facilities and mobile wallets on mobile platforms rather than on laptops or desktops. The increased use of the Internet using smartphones has encouraged smartphone manufacturers to introduce new technologies like LTE is the driving factor this market.
              • 4G is the driving factor this market.
              • and 5G technologies on their devices. The introduction of cheaper smartphones is enabling people in the lower-income brackets to buy such mobile phones to access the Internet. Increasing semiconductor manufacturing activities to cater to the growth in demand for electronic goods such as smartphones will drive demand for industrial vacuum valves during the forecast period. is the driving factor this market.

              The Industrial Vacuum Valves market vendors should focus on grabbing business opportunities from the Semiconductor segment as it accounted for the largest market share in the base year.