Industrial Welding Robots Market Analysis, Size, and Forecast 2026-2030: APAC (China, Japan, and India), Europe (Germany, UK, and France), North America (US, Canada, and Mexico), South America (Brazil, Argentina, and Chile), Middle East and Africa (Saudi Arabia, UAE, and South Africa), and Rest of World (ROW)

Industrial Welding Robots Market Analysis, Size, and Forecast 2026-2030:
APAC (China, Japan, and India), Europe (Germany, UK, and France), North America (US, Canada, and Mexico), South America (Brazil, Argentina, and Chile), Middle East and Africa (Saudi Arabia, UAE, and South Africa), and Rest of World (ROW)

Published: Oct 2026 303 Pages SKU: IRTNTR46545

Market Overview at a Glance

$3.75 B
Market Opportunity
7.2%
CAGR 2025 - 2030
60.9%
APAC Growth
$4.06 B
Spot welding robots segment 2024

Industrial Welding Robots Market Size 2026-2030

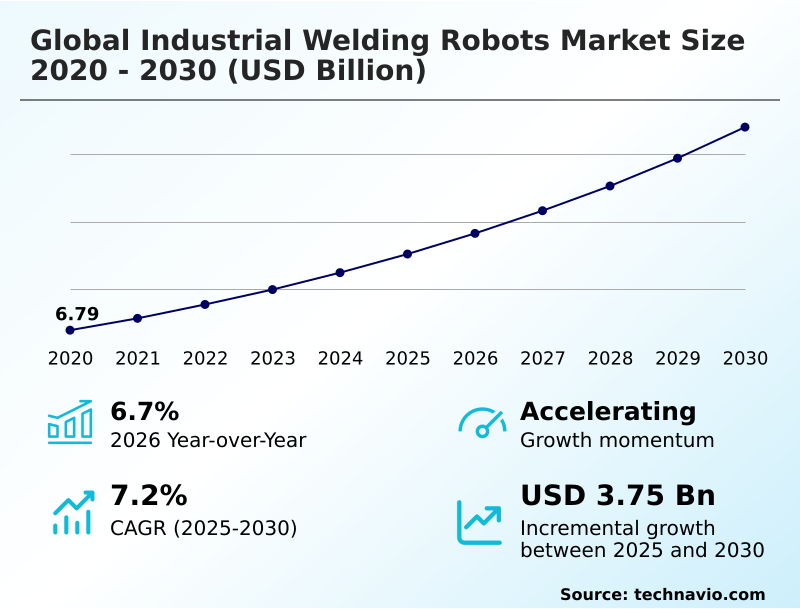
The industrial welding robots market size is valued to increase by USD 3.75 billion, at a CAGR of 7.2% from 2025 to 2030. Automotive electrification and lightweight materials will drive the industrial welding robots market.

Major Market Trends & Insights

  • APAC dominated the market and accounted for a 60.9% growth during the forecast period.
  • By Product - Spot welding robots segment was valued at USD 4.06 billion in 2024
  • By End-user - Automotive segment accounted for the largest market revenue share in 2024

Market Size & Forecast

  • Market Opportunities: USD 5.99 billion
  • Market Future Opportunities: USD 3.75 billion
  • CAGR from 2025 to 2030 : 7.2%

Market Summary

  • The Industrial Welding Robots market demonstrates robust expansion as modern fabrication facilities increasingly replace traditional manual setups with advanced automated systems to enhance throughput. In the automotive sector, supply chain optimization strategies now heavily rely on robotic cells to ensure rigorous quality control standards across continuous production cycles.
  • Facilities upgrading to these automated platforms routinely experience a 35% reduction in material waste and a 20% increase in overall operational speed. This acceleration is primarily driven by the convergence of industrial automation with artificial intelligence, empowering robots to dynamically adjust torch angles and wire feed speeds on the fly.
  • Conversely, the initial hardware acquisition and mastery of sophisticated programming interfaces represent formidable operational challenges, creating steep learning curves for legacy factory personnel. Consequently, enterprises are compelled to invest in extensive retraining initiatives while deploying intuitive, teach-free interfaces to bridge the widening talent gap and maintain baseline production capacity.

What will be the Size of the Industrial Welding Robots Market during the forecast period?
Get Key Insights on Market Forecast (PDF) Get Free Sample

How is the Industrial Welding Robots Market Segmented?

The industrial welding robots industry research report provides comprehensive data (region-wise segment analysis), with forecasts and estimates in "USD million" for the period 2026-2030, as well as historical data from 2020-2024 for the following segments.

  • Product
    • Spot welding robots
    • Arc welding robots
    • Laser welding robots
  • End-user
    • Automotive
    • Electrical and electronics
    • Heavy machinery
    • Others
  • Capacity
    • Medium payload
    • Low payload
    • Heavy payload
  • Geography
    • APAC
      • China
      • Japan
      • India
      • South Korea
      • Australia
      • Indonesia
    • Europe
      • Germany
      • UK
      • France
      • Italy
      • Spain
      • The Netherlands
    • North America
      • US
      • Canada
      • Mexico
    • South America
      • Brazil
      • Argentina
      • Chile
    • Middle East and Africa
      • Saudi Arabia
      • UAE
      • South Africa
      • Israel
      • Turkey

By Product Insights

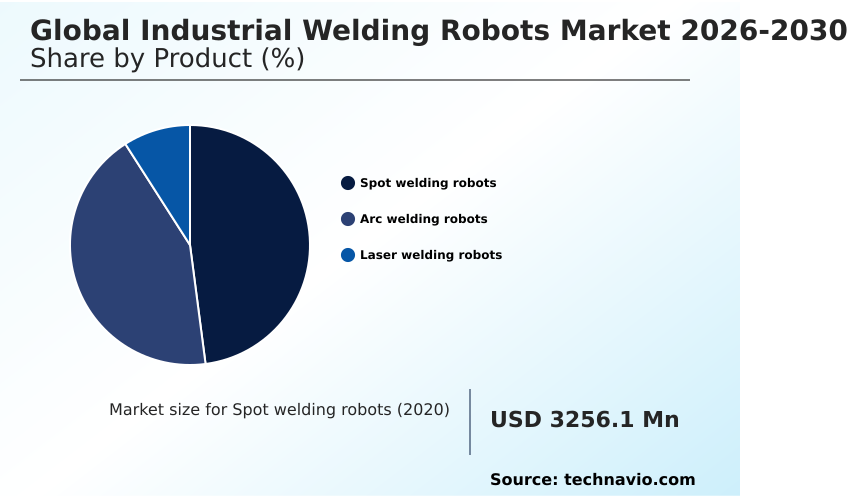
The spot welding robots segment is estimated to witness significant growth during the forecast period.

Spot welding robots represent a dominant foundational pillar within modern high-volume manufacturing environments, holding a substantial share of overall industrial welding robots deployments.

Driven primarily by rigorous demands in the automotive sector, these units excel in assembling structural body frames and specialized electric vehicle battery enclosures where absolute speed and consistency are mandatory.

Engineered to deliver high clamping forces and precise electrical currents through resistance spot welding guns, these systems ensure critical sheet metal joints meet stringent safety criteria without human variance.

Implementing automated spot welding cells allows facilities to offset persistent skilled labor shortages while achieving continuous round-the-clock throughput.

By leveraging advanced tooling, operators consistently reach zero defect tolerances, resulting in a 22% improvement in cycle time optimization compared to traditional manual joining methods.
Get Free Sample

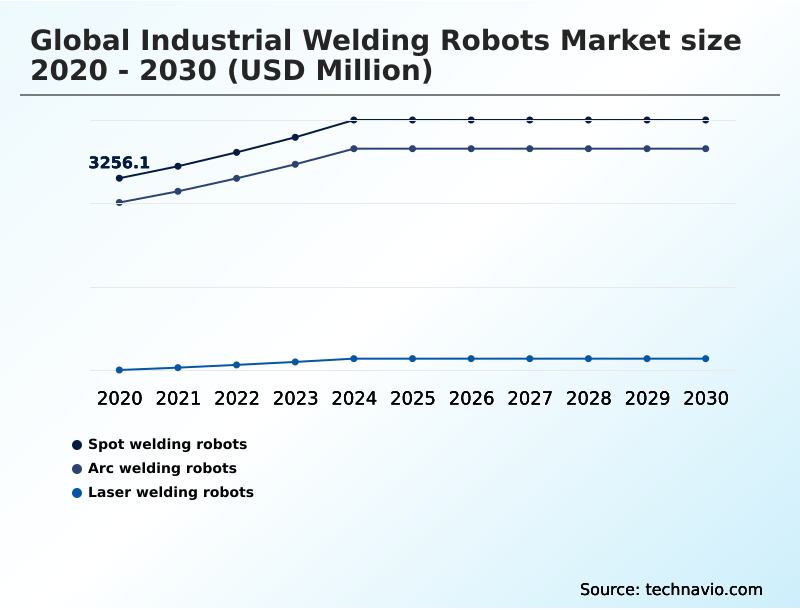
The Spot welding robots segment was valued at USD 4.06 billion in 2024 and showed a gradual increase during the forecast period.
Get Free Sample

Regional Analysis

APAC is estimated to contribute 60.9% to the growth of the global market during the forecast period.Technavio’s analysts have elaborately explained the regional trends and drivers that shape the market during the forecast period.
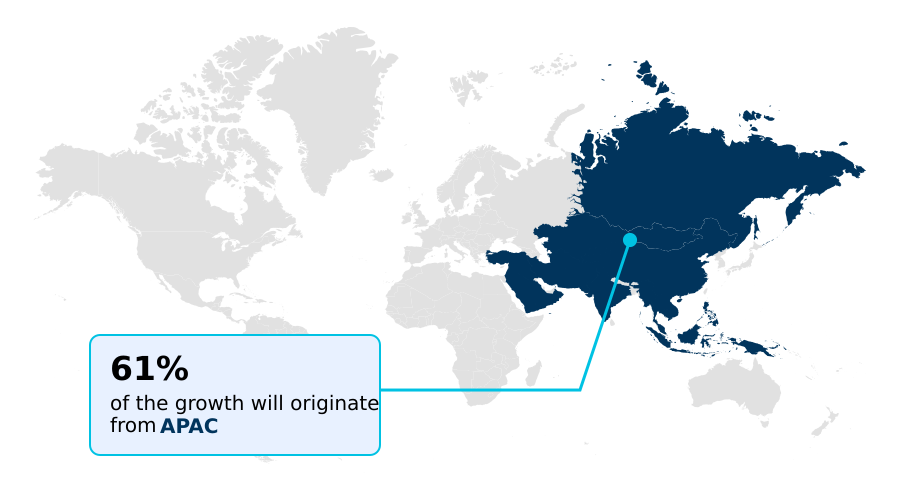
See How Industrial Welding Robots Market Demand is Rising in APAC Get Free Sample

The geographic landscape for Industrial Welding Robots reveals distinct operational priorities across different manufacturing hubs.

The APAC region leads deployment, driven by massive electronics and automotive production requirements, achieving a 32% faster adoption rate of smart factory ecosystems compared to European markets.

European facilities, hindered by stringent ergonomics and high labor costs, prioritize heavy duty articulated robots equipped with offline programming software to maximize energy efficiency. This strategic adaptation has lowered unexpected downtime by 18% in advanced German and Italian plants.

Meanwhile, North American enterprises heavily integrate teach free programming platforms to combat severe skilled workforce shortages, resulting in a 25% improvement in rapid line reconfiguration.

By leveraging high speed articulation and networked telemetry, these distinct regional strategies highlight how businesses dynamically tailor automated welding infrastructure to overcome localized supply chain bottlenecks and compliance mandates.

Market Dynamics

Our researchers analyzed the data with 2025 as the base year, along with the key drivers, trends, and challenges. A holistic analysis of drivers will help companies refine their marketing strategies to gain a competitive advantage.

  • As heavy industries transition toward intelligent manufacturing models, the operational dynamics within the Industrial Welding Robots sector undergo profound structural enhancements. Modern fabrication facilities increasingly prioritize advanced applications such as electric vehicle battery enclosure welding to meet stringent structural and thermal safety requirements demanded by next-generation transportation sectors.
  • This shift necessitates the integration of real time adaptive seam tracking technologies, which dynamically correct torch trajectories to compensate for subtle material fit-up inconsistencies without halting production lines. Compared to traditional manual inspection workflows, implementing automated machine vision joint inspection enables facilities to identify microscopic anomalies instantly, effectively reducing post-process rework delays by up to 35%.
  • Furthermore, small and medium-sized enterprises historically constrained by floor space and capital limitations now accelerate their adoption rates through collaborative robotic welding cell deployment. These flexible systems allow human operators to work safely alongside automated units, streamlining complex assembly tasks. To overcome the steep learning curves associated with legacy programming, manufacturers increasingly leverage teachless robotic path optimization software.
  • This advancement compresses setup times from hours to mere minutes, demonstrating a distinct operational advantage over rigid, pre-programmed industrial cells. By aligning these sophisticated joining technologies with agile supply chain planning and rigorous compliance standards, industrial operators ensure continuous output resilience, lower material waste, and secure long-term competitive viability within an increasingly complex global fabrication landscape.
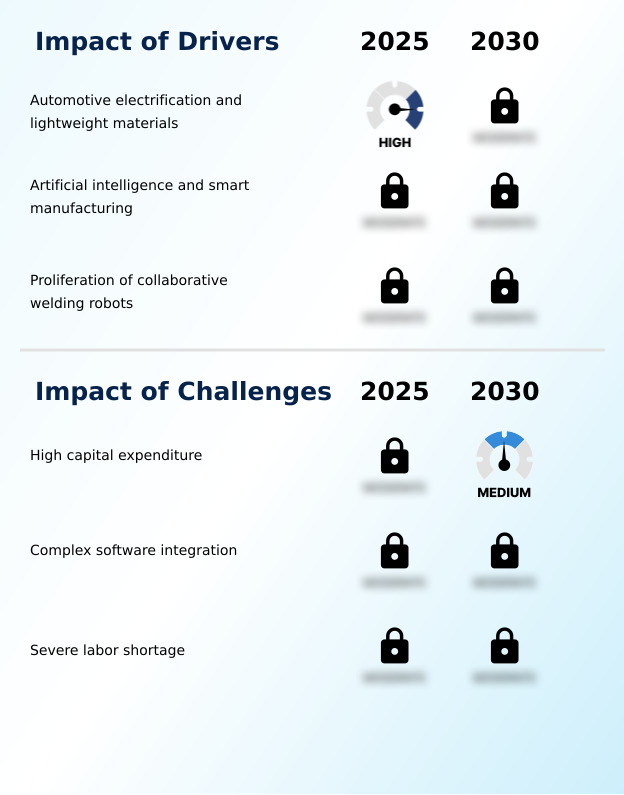
What are the key market drivers leading to the rise in the adoption of Industrial Welding Robots Industry?

  • The rapid industry transition toward automotive electrification and the adoption of lightweight materials act as primary catalysts accelerating the demand for precision automated joining solutions.

  • The accelerated global transition toward electric vehicle production serves as a powerful driver reshaping the demand for Industrial Welding Robots.
  • Contemporary manufacturing requires the intricate assembly of lightweight aluminum frames, which demand exceptionally tight tolerances to ensure structural integrity and battery safety.
  • To meet these rigorous standards, automotive suppliers aggressively deploy high payload capacity robots capable of handling complex geometric configurations without compromising cycle times. This shift toward automated precision metal joining has lowered unexpected thermal damage rates by 26%.
  • Additionally, integrating collaborative welding robots alongside automated torch cleaners reduces routine maintenance delays by 15%, streamlining shop floor operations. These continuous technological enhancements elevate process efficiency, compelling manufacturers to abandon inadequate manual techniques in favor of scalable, high-volume robotic solutions.

What are the market trends shaping the Industrial Welding Robots Industry?

  • The integration of advanced machine vision systems is emerging as a critical trend transforming automated manufacturing environments. This technological shift enables dynamic trajectory correction and real-time quality assurance across complex fabrication processes.

  • The integration of advanced machine vision and artificial intelligence into Industrial Welding Robots represents a transformative shift in automated fabrication. Traditional automated cells historically relied entirely on rigid numerical coordinates, which frequently failed during subtle dimensional variations. Today, high-performance systems utilize generative artificial intelligence to enable dynamic path optimization, automatically correcting seam deviations without human intervention.
  • This visual intelligence ensures optimal penetration and flawless bead placement, effectively reducing structural rework by 34%. Furthermore, by fusing optical data with automated motion control, these vision-enabled platforms instantly detect microscopic surface cracks before assemblies move down the production chain.
  • This proactive defect identification improves overall forecast accuracy regarding component yield by 18%, allowing manufacturing enterprises to achieve unprecedented process reliability and satisfy stringent aerospace and defense certification requirements globally.

What challenges does the Industrial Welding Robots Industry face during its growth?

  • Substantial initial capital expenditure requirements for hardware procurement and peripheral system integration pose a significant barrier, particularly for small and medium-sized manufacturing enterprises.

  • Securing adequate initial capital and mastering sophisticated programming interfaces represent formidable operational challenges for deploying Industrial Welding Robots. The procurement of advanced hardware, including high precision servo motors and specialized power sources, requires substantial upfront investment that frequently deters small and medium-sized enterprises.
  • Furthermore, operators must precisely manage shielding gas flow rates and configure adaptive voltage adjustments to maintain optimal weld seam integrity. When thermal distortion compensation fails during complex geometries, pre-programmed paths deviate, leading to costly manufacturing bottlenecks. Facilities struggling with software integration report a 25% increase in initial setup delays compared to traditional manual joining methods.
  • Until intuitive, AI-driven programming becomes universally accessible, these steep technical learning curves and integration expenses will persistently restrict deployment velocity, lowering overall operational efficiency by up to 14% during transition periods.

Exclusive Technavio Analysis on Customer Landscape

The industrial welding robots market forecasting report includes the adoption lifecycle of the market, covering from the innovator’s stage to the laggard’s stage. It focuses on adoption rates in different regions based on penetration. Furthermore, the industrial welding robots market report also includes key purchase criteria and drivers of price sensitivity to help companies evaluate and develop their market growth analysis strategies.
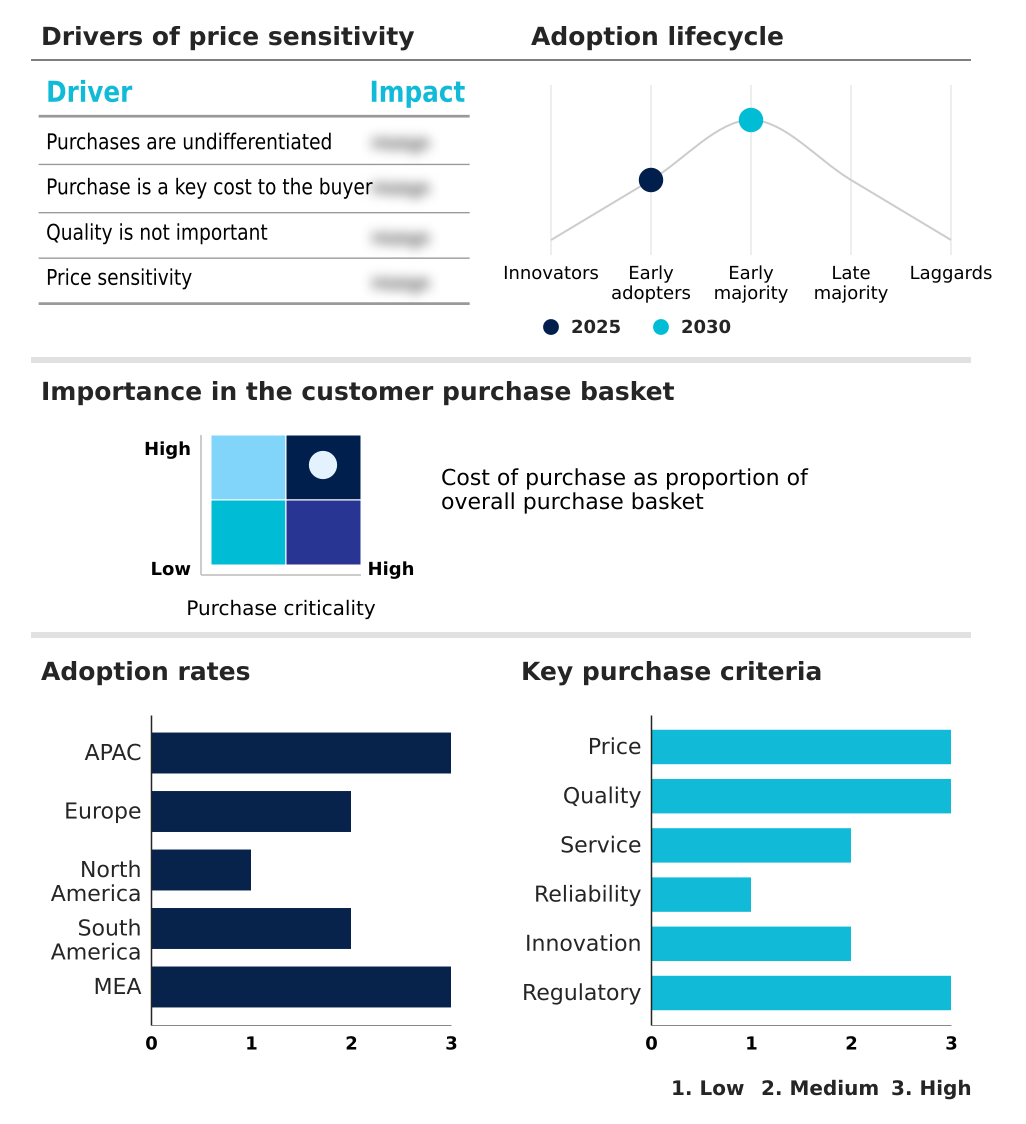
Customer Landscape of Industrial Welding Robots Industry

Competitive Landscape

Companies are implementing various strategies, such as strategic alliances, industrial welding robots market forecast, partnerships, mergers and acquisitions, geographical expansion, and product/service launches, to enhance their presence in the industry.

ABB Ltd. - The provider specializes in advanced industrial welding robots, featuring articulated models designed to enhance manufacturing precision, optimize cycle times, and support diverse automation requirements.

The industry research and growth report includes detailed analyses of the competitive landscape of the market and information about key companies, including:

  • ABB Ltd.
  • Carl Cloos Schweibtechnik GmbH
  • Comau SpA
  • Daihen Corp.
  • Doosan Corp.
  • Efort Intelligent Equipment
  • Estun Automation Co. Ltd.
  • FANUC Corp.
  • GSK CNC Equipment Co. Ltd.
  • Hanwha Robotics CO. LTD
  • HD Hyundai Robotics
  • IGM Robotersysteme AG
  • JAKA Robotics
  • Kawasaki Robotics USA Inc.
  • KUKA AG
  • Nachi Fujikoshi Corp.
  • Panasonic Holdings Corp.
  • SIASUN Robot and Automation CO.
  • Yaskawa Electric Corp.

Qualitative and quantitative analysis of companies has been conducted to help clients understand the wider business environment as well as the strengths and weaknesses of key industry players. Data is qualitatively analyzed to categorize companies as pure play, category-focused, industry-focused, and diversified; it is quantitatively analyzed to categorize companies as dominant, leading, strong, tentative, and weak.

Recent Development and News in Industrial welding robots market

  • In the Industrial Machinery and Supplies and Components industry, the rapid deployment of plug and play deployment frameworks across tier-two facilities has lowered integration barriers, directly impacting Industrial Welding Robots demand by accelerating collaborative welding robots adoption in high-mix fabrication lines.
  • Stringent workplace safety regulations mandating hazardous fume ventilation and restricted human exposure in heavy machinery fabrication have driven manufacturers to replace manual joining with automated robotic cell integration, boosting equipment procurement by 18%.
  • Advancements in digital twin simulation software within complex manufacturing networks have enabled virtual validation of complex geometric configurations, reducing physical setup times by 25% and expanding the deployment of highly customized Industrial Welding Robots.
  • The global push toward electric vehicle infrastructure within the broader transportation machinery sector has shifted raw material usage toward lightweight aluminum frames, creating a 30% surge in demand for precision metal joining systems like specialized Industrial Welding Robots.

Dive into Technavio’s robust research methodology, blending expert interviews, extensive data synthesis, and validated models for unparalleled Industrial Welding Robots Market insights. See full methodology.

Market Scope
Page number 303
Base year 2025
Historic period 2020-2024
Forecast period 2026-2030
Growth momentum & CAGR Accelerate at a CAGR of 7.2%
Market growth 2026-2030 USD 3745.0 million
Market structure Fragmented
YoY growth 2025-2026(%) 6.7%
Key countries China, Japan, India, South Korea, Australia, Indonesia, Germany, UK, France, Italy, Spain, The Netherlands, US, Canada, Mexico, Brazil, Argentina, Chile, Saudi Arabia, UAE, South Africa, Israel and Turkey
Competitive landscape Leading Companies, Market Positioning of Companies, Competitive Strategies, and Industry Risks

Request Free Sample

Research Analyst Overview

  • Industrial Welding Robots are continuously evolving from rigid mechanical executors into intelligent, self-optimizing manufacturing assets. Boardrooms increasingly view these automated systems as critical components for long-term product strategy and compliance alignment, rather than mere capital expenditures.
  • By integrating high resolution optical sensors and automated seam tracking, modern robotic cells dynamically compensate for thermal distortion, ensuring absolute precision across complex gas metal arc welding applications. This technological shift directly impacts budgeting decisions, as enterprises utilizing advanced adaptive multi-layer welding report a 30% reduction in costly structural rework and material waste.
  • Furthermore, the deployment of internet of things connectivity enables facilities to implement robust predictive maintenance frameworks that monitor mechanical stress across robot axes in real time. This proactive approach identifies potential component failures before catastrophic breakdowns occur, effectively increasing overall equipment effectiveness by 22%.
  • As manufacturers strive for maximum asset utilization and rigorous quality assurance, these intelligent welding platforms provide an indispensable mechanism for maintaining manufacturing excellence and securing operational profitability.

What are the Key Data Covered in this Industrial Welding Robots Market Research and Growth Report?

  • What is the expected growth of the Industrial Welding Robots Market between 2026 and 2030?

    • USD 3.75 billion, at a CAGR of 7.2%

  • What segmentation does the market report cover?

    • The report is segmented by Product (Spot welding robots, Arc welding robots, and Laser welding robots), End-user (Automotive, Electrical and electronics, Heavy machinery, and Others), Capacity (Medium payload, Low payload, and Heavy payload) and Geography (APAC, Europe, North America, South America, Middle East and Africa)

  • Which regions are analyzed in the report?

    • APAC, Europe, North America, South America and Middle East and Africa

  • What are the key growth drivers and market challenges?

    • Automotive electrification and lightweight materials, High capital expenditure

  • Who are the major players in the Industrial Welding Robots Market?

    • ABB Ltd., Carl Cloos Schweibtechnik GmbH, Comau SpA, Daihen Corp., Doosan Corp., Efort Intelligent Equipment, Estun Automation Co. Ltd., FANUC Corp., GSK CNC Equipment Co. Ltd., Hanwha Robotics CO. LTD, HD Hyundai Robotics, IGM Robotersysteme AG, JAKA Robotics, Kawasaki Robotics USA Inc., KUKA AG, Nachi Fujikoshi Corp., Panasonic Holdings Corp., SIASUN Robot and Automation CO. and Yaskawa Electric Corp.

Market Research Insights

  • The Industrial Welding Robots landscape is evolving rapidly to support high volume manufacturing requirements across demanding industrial sectors. Facilities prioritizing automated post weld quality inspections report a 28% decrease in critical component failures, directly enhancing overall structural integrity. Furthermore, adopting advanced robotic configurations allows plants to achieve continuous round the clock throughput without compromising precision.
  • This strategic shift leads to a 22% improvement in cycle time optimization, substantially lowering long-term operational costs. By integrating these adaptive systems, manufacturers mitigate skilled labor shortages and align production capabilities with stringent global compliance standards, driving measurable returns on investment across complex assembly operations.

We can help! Our analysts can customize this industrial welding robots market research report to meet your requirements.

Get in touch

1. Executive Summary

1.1 Market overview

Executive Summary - Chart on Market Overview
Executive Summary - Data Table on Market Overview
Executive Summary - Chart on Global Market Characteristics
Executive Summary - Chart on Market by Geography
Executive Summary - Chart on Market Segmentation by Product
Executive Summary - Chart on Market Segmentation by End-user
Executive Summary - Chart on Market Segmentation by Capacity
Executive Summary - Chart on Incremental Growth
Executive Summary - Data Table on Incremental Growth
Executive Summary - Chart on Company Market Positioning

2. Technavio Analysis

2.1 Analysis of price sensitivity, lifecycle, customer purchase basket, adoption rates, and purchase criteria

2.2 Criticality of inputs and Factors of differentiation

Chart on Overview on criticality of inputs and factors of differentiation

2.3 Factors of disruption

Chart on Overview on factors of disruption

2.4 Impact of drivers and challenges

Chart on Impact of drivers and challenges in 2025 and 2030

3. Market Landscape

3.1 Market ecosystem

Chart on Parent Market
Data Table on - Parent Market

3.2 Market characteristics

Chart on Market characteristics analysis

3.3 Value chain analysis

Chart on Value chain analysis

4. Market Sizing

4.1 Market definition

Data Table on Offerings of companies included in the market definition

4.2 Market segment analysis

Market segments

4.3 Market size 2025

4.4 Market outlook: Forecast for 2025-2030

Chart on Global - Market size and forecast 2025-2030 ($ million)
Data Table on Global - Market size and forecast 2025-2030 ($ million)
Chart on Global Market: Year-over-year growth 2025-2030 (%)
Data Table on Global Market: Year-over-year growth 2025-2030 (%)

5. Historic Market Size

5.1 Global Industrial Welding Robots Market 2020 - 2024

Historic Market Size - Data Table on Global Industrial Welding Robots Market 2020 - 2024 ($ million)

5.2 Product segment analysis 2020 - 2024

Historic Market Size - Product Segment 2020 - 2024 ($ million)

5.3 End-user segment analysis 2020 - 2024

Historic Market Size - End-user Segment 2020 - 2024 ($ million)

5.4 Capacity segment analysis 2020 - 2024

Historic Market Size - Capacity Segment 2020 - 2024 ($ million)

5.5 Geography segment analysis 2020 - 2024

Historic Market Size - Geography Segment 2020 - 2024 ($ million)

5.6 Country segment analysis 2020 - 2024

Historic Market Size - Country Segment 2020 - 2024 ($ million)

6. Qualitative Analysis

6.1 Impact of AI on Global Industrial Welding Robots Market

6.2 Impact of geopolitical conflicts on Global Industrial Welding Robots Market

7. Five Forces Analysis

7.1 Five forces summary

Five forces analysis - Comparison between 2025 and 2030

7.2 Bargaining power of buyers

Bargaining power of buyers - Impact of key factors 2025 and 2030

7.3 Bargaining power of suppliers

Bargaining power of suppliers - Impact of key factors in 2025 and 2030

7.4 Threat of new entrants

Threat of new entrants - Impact of key factors in 2025 and 2030

7.5 Threat of substitutes

Threat of substitutes - Impact of key factors in 2025 and 2030

7.6 Threat of rivalry

Threat of rivalry - Impact of key factors in 2025 and 2030

7.7 Market condition

Chart on Market condition - Five forces 2025 and 2030

8. Market Segmentation by Product

8.1 Market segments

Chart on Product - Market share 2025-2030 (%)
Data Table on Product - Market share 2025-2030 (%)

8.2 Comparison by Product

Chart on Comparison by Product
Data Table on Comparison by Product

8.3 Spot welding robots - Market size and forecast 2025-2030

Chart on Spot welding robots - Market size and forecast 2025-2030 ($ million)
Data Table on Spot welding robots - Market size and forecast 2025-2030 ($ million)
Chart on Spot welding robots - Year-over-year growth 2025-2030 (%)
Data Table on Spot welding robots - Year-over-year growth 2025-2030 (%)

8.4 Arc welding robots - Market size and forecast 2025-2030

Chart on Arc welding robots - Market size and forecast 2025-2030 ($ million)
Data Table on Arc welding robots - Market size and forecast 2025-2030 ($ million)
Chart on Arc welding robots - Year-over-year growth 2025-2030 (%)
Data Table on Arc welding robots - Year-over-year growth 2025-2030 (%)

8.5 Laser welding robots - Market size and forecast 2025-2030

Chart on Laser welding robots - Market size and forecast 2025-2030 ($ million)
Data Table on Laser welding robots - Market size and forecast 2025-2030 ($ million)
Chart on Laser welding robots - Year-over-year growth 2025-2030 (%)
Data Table on Laser welding robots - Year-over-year growth 2025-2030 (%)

8.6 Market opportunity by Product

Market opportunity by Product ($ million)
Data Table on Market opportunity by Product ($ million)

9. Market Segmentation by End-user

9.1 Market segments

Chart on End-user - Market share 2025-2030 (%)
Data Table on End-user - Market share 2025-2030 (%)

9.2 Comparison by End-user

Chart on Comparison by End-user
Data Table on Comparison by End-user

9.3 Automotive - Market size and forecast 2025-2030

Chart on Automotive - Market size and forecast 2025-2030 ($ million)
Data Table on Automotive - Market size and forecast 2025-2030 ($ million)
Chart on Automotive - Year-over-year growth 2025-2030 (%)
Data Table on Automotive - Year-over-year growth 2025-2030 (%)

9.4 Electrical and electronics - Market size and forecast 2025-2030

Chart on Electrical and electronics - Market size and forecast 2025-2030 ($ million)
Data Table on Electrical and electronics - Market size and forecast 2025-2030 ($ million)
Chart on Electrical and electronics - Year-over-year growth 2025-2030 (%)
Data Table on Electrical and electronics - Year-over-year growth 2025-2030 (%)

9.5 Heavy machinery - Market size and forecast 2025-2030

Chart on Heavy machinery - Market size and forecast 2025-2030 ($ million)
Data Table on Heavy machinery - Market size and forecast 2025-2030 ($ million)
Chart on Heavy machinery - Year-over-year growth 2025-2030 (%)
Data Table on Heavy machinery - Year-over-year growth 2025-2030 (%)

9.6 Others - Market size and forecast 2025-2030

Chart on Others - Market size and forecast 2025-2030 ($ million)
Data Table on Others - Market size and forecast 2025-2030 ($ million)
Chart on Others - Year-over-year growth 2025-2030 (%)
Data Table on Others - Year-over-year growth 2025-2030 (%)

9.7 Market opportunity by End-user

Market opportunity by End-user ($ million)
Data Table on Market opportunity by End-user ($ million)

10. Market Segmentation by Capacity

10.1 Market segments

Chart on Capacity - Market share 2025-2030 (%)
Data Table on Capacity - Market share 2025-2030 (%)

10.2 Comparison by Capacity

Chart on Comparison by Capacity
Data Table on Comparison by Capacity

10.3 Medium payload - Market size and forecast 2025-2030

Chart on Medium payload - Market size and forecast 2025-2030 ($ million)
Data Table on Medium payload - Market size and forecast 2025-2030 ($ million)
Chart on Medium payload - Year-over-year growth 2025-2030 (%)
Data Table on Medium payload - Year-over-year growth 2025-2030 (%)

10.4 Low payload - Market size and forecast 2025-2030

Chart on Low payload - Market size and forecast 2025-2030 ($ million)
Data Table on Low payload - Market size and forecast 2025-2030 ($ million)
Chart on Low payload - Year-over-year growth 2025-2030 (%)
Data Table on Low payload - Year-over-year growth 2025-2030 (%)

10.5 Heavy payload - Market size and forecast 2025-2030

Chart on Heavy payload - Market size and forecast 2025-2030 ($ million)
Data Table on Heavy payload - Market size and forecast 2025-2030 ($ million)
Chart on Heavy payload - Year-over-year growth 2025-2030 (%)
Data Table on Heavy payload - Year-over-year growth 2025-2030 (%)

10.6 Market opportunity by Capacity

Market opportunity by Capacity ($ million)
Data Table on Market opportunity by Capacity ($ million)

11. Customer Landscape

11.1 Customer landscape overview

Analysis of price sensitivity, lifecycle, customer purchase basket, adoption rates, and purchase criteria

12. Geographic Landscape

12.1 Geographic segmentation

Chart on Market share by geography 2025-2030 (%)
Data Table on Market share by geography 2025-2030 (%)

12.2 Geographic comparison

Chart on Geographic comparison
Data Table on Geographic comparison

12.3 APAC - Market size and forecast 2025-2030

Chart on APAC - Market size and forecast 2025-2030 ($ million)
Data Table on APAC - Market size and forecast 2025-2030 ($ million)
Chart on APAC - Year-over-year growth 2025-2030 (%)
Data Table on APAC - Year-over-year growth 2025-2030 (%)
Chart on Regional Comparison - APAC
Data Table on Regional Comparison - APAC

12.3.1 China - Market size and forecast 2025-2030

Chart on China - Market size and forecast 2025-2030 ($ million)
Data Table on China - Market size and forecast 2025-2030 ($ million)
Chart on China - Year-over-year growth 2025-2030 (%)
Data Table on China - Year-over-year growth 2025-2030 (%)

12.3.2 Japan - Market size and forecast 2025-2030

Chart on Japan - Market size and forecast 2025-2030 ($ million)
Data Table on Japan - Market size and forecast 2025-2030 ($ million)
Chart on Japan - Year-over-year growth 2025-2030 (%)
Data Table on Japan - Year-over-year growth 2025-2030 (%)

12.3.3 India - Market size and forecast 2025-2030

Chart on India - Market size and forecast 2025-2030 ($ million)
Data Table on India - Market size and forecast 2025-2030 ($ million)
Chart on India - Year-over-year growth 2025-2030 (%)
Data Table on India - Year-over-year growth 2025-2030 (%)

12.3.4 South Korea - Market size and forecast 2025-2030

Chart on South Korea - Market size and forecast 2025-2030 ($ million)
Data Table on South Korea - Market size and forecast 2025-2030 ($ million)
Chart on South Korea - Year-over-year growth 2025-2030 (%)
Data Table on South Korea - Year-over-year growth 2025-2030 (%)

12.3.5 Australia - Market size and forecast 2025-2030

Chart on Australia - Market size and forecast 2025-2030 ($ million)
Data Table on Australia - Market size and forecast 2025-2030 ($ million)
Chart on Australia - Year-over-year growth 2025-2030 (%)
Data Table on Australia - Year-over-year growth 2025-2030 (%)

12.3.6 Indonesia - Market size and forecast 2025-2030

Chart on Indonesia - Market size and forecast 2025-2030 ($ million)
Data Table on Indonesia - Market size and forecast 2025-2030 ($ million)
Chart on Indonesia - Year-over-year growth 2025-2030 (%)
Data Table on Indonesia - Year-over-year growth 2025-2030 (%)

12.4 Europe - Market size and forecast 2025-2030

Chart on Europe - Market size and forecast 2025-2030 ($ million)
Data Table on Europe - Market size and forecast 2025-2030 ($ million)
Chart on Europe - Year-over-year growth 2025-2030 (%)
Data Table on Europe - Year-over-year growth 2025-2030 (%)
Chart on Regional Comparison - Europe
Data Table on Regional Comparison - Europe

12.4.1 Germany - Market size and forecast 2025-2030

Chart on Germany - Market size and forecast 2025-2030 ($ million)
Data Table on Germany - Market size and forecast 2025-2030 ($ million)
Chart on Germany - Year-over-year growth 2025-2030 (%)
Data Table on Germany - Year-over-year growth 2025-2030 (%)

12.4.2 UK - Market size and forecast 2025-2030

Chart on UK - Market size and forecast 2025-2030 ($ million)
Data Table on UK - Market size and forecast 2025-2030 ($ million)
Chart on UK - Year-over-year growth 2025-2030 (%)
Data Table on UK - Year-over-year growth 2025-2030 (%)

12.4.3 France - Market size and forecast 2025-2030

Chart on France - Market size and forecast 2025-2030 ($ million)
Data Table on France - Market size and forecast 2025-2030 ($ million)
Chart on France - Year-over-year growth 2025-2030 (%)
Data Table on France - Year-over-year growth 2025-2030 (%)

12.4.4 Italy - Market size and forecast 2025-2030

Chart on Italy - Market size and forecast 2025-2030 ($ million)
Data Table on Italy - Market size and forecast 2025-2030 ($ million)
Chart on Italy - Year-over-year growth 2025-2030 (%)
Data Table on Italy - Year-over-year growth 2025-2030 (%)

12.4.5 Spain - Market size and forecast 2025-2030

Chart on Spain - Market size and forecast 2025-2030 ($ million)
Data Table on Spain - Market size and forecast 2025-2030 ($ million)
Chart on Spain - Year-over-year growth 2025-2030 (%)
Data Table on Spain - Year-over-year growth 2025-2030 (%)

12.4.6 The Netherlands - Market size and forecast 2025-2030

Chart on The Netherlands - Market size and forecast 2025-2030 ($ million)
Data Table on The Netherlands - Market size and forecast 2025-2030 ($ million)
Chart on The Netherlands - Year-over-year growth 2025-2030 (%)
Data Table on The Netherlands - Year-over-year growth 2025-2030 (%)

12.5 North America - Market size and forecast 2025-2030

Chart on North America - Market size and forecast 2025-2030 ($ million)
Data Table on North America - Market size and forecast 2025-2030 ($ million)
Chart on North America - Year-over-year growth 2025-2030 (%)
Data Table on North America - Year-over-year growth 2025-2030 (%)
Chart on Regional Comparison - North America
Data Table on Regional Comparison - North America

12.5.1 US - Market size and forecast 2025-2030

Chart on US - Market size and forecast 2025-2030 ($ million)
Data Table on US - Market size and forecast 2025-2030 ($ million)
Chart on US - Year-over-year growth 2025-2030 (%)
Data Table on US - Year-over-year growth 2025-2030 (%)

12.5.2 Canada - Market size and forecast 2025-2030

Chart on Canada - Market size and forecast 2025-2030 ($ million)
Data Table on Canada - Market size and forecast 2025-2030 ($ million)
Chart on Canada - Year-over-year growth 2025-2030 (%)
Data Table on Canada - Year-over-year growth 2025-2030 (%)

12.5.3 Mexico - Market size and forecast 2025-2030

Chart on Mexico - Market size and forecast 2025-2030 ($ million)
Data Table on Mexico - Market size and forecast 2025-2030 ($ million)
Chart on Mexico - Year-over-year growth 2025-2030 (%)
Data Table on Mexico - Year-over-year growth 2025-2030 (%)

12.6 South America - Market size and forecast 2025-2030

Chart on South America - Market size and forecast 2025-2030 ($ million)
Data Table on South America - Market size and forecast 2025-2030 ($ million)
Chart on South America - Year-over-year growth 2025-2030 (%)
Data Table on South America - Year-over-year growth 2025-2030 (%)
Chart on Regional Comparison - South America
Data Table on Regional Comparison - South America

12.6.1 Brazil - Market size and forecast 2025-2030

Chart on Brazil - Market size and forecast 2025-2030 ($ million)
Data Table on Brazil - Market size and forecast 2025-2030 ($ million)
Chart on Brazil - Year-over-year growth 2025-2030 (%)
Data Table on Brazil - Year-over-year growth 2025-2030 (%)

12.6.2 Argentina - Market size and forecast 2025-2030

Chart on Argentina - Market size and forecast 2025-2030 ($ million)
Data Table on Argentina - Market size and forecast 2025-2030 ($ million)
Chart on Argentina - Year-over-year growth 2025-2030 (%)
Data Table on Argentina - Year-over-year growth 2025-2030 (%)

12.6.3 Chile - Market size and forecast 2025-2030

Chart on Chile - Market size and forecast 2025-2030 ($ million)
Data Table on Chile - Market size and forecast 2025-2030 ($ million)
Chart on Chile - Year-over-year growth 2025-2030 (%)
Data Table on Chile - Year-over-year growth 2025-2030 (%)

12.7 Middle East and Africa - Market size and forecast 2025-2030

Chart on Middle East and Africa - Market size and forecast 2025-2030 ($ million)
Data Table on Middle East and Africa - Market size and forecast 2025-2030 ($ million)
Chart on Middle East and Africa - Year-over-year growth 2025-2030 (%)
Data Table on Middle East and Africa - Year-over-year growth 2025-2030 (%)
Chart on Regional Comparison - Middle East and Africa
Data Table on Regional Comparison - Middle East and Africa

12.7.1 Saudi Arabia - Market size and forecast 2025-2030

Chart on Saudi Arabia - Market size and forecast 2025-2030 ($ million)
Data Table on Saudi Arabia - Market size and forecast 2025-2030 ($ million)
Chart on Saudi Arabia - Year-over-year growth 2025-2030 (%)
Data Table on Saudi Arabia - Year-over-year growth 2025-2030 (%)

12.7.2 UAE - Market size and forecast 2025-2030

Chart on UAE - Market size and forecast 2025-2030 ($ million)
Data Table on UAE - Market size and forecast 2025-2030 ($ million)
Chart on UAE - Year-over-year growth 2025-2030 (%)
Data Table on UAE - Year-over-year growth 2025-2030 (%)

12.7.3 South Africa - Market size and forecast 2025-2030

Chart on South Africa - Market size and forecast 2025-2030 ($ million)
Data Table on South Africa - Market size and forecast 2025-2030 ($ million)
Chart on South Africa - Year-over-year growth 2025-2030 (%)
Data Table on South Africa - Year-over-year growth 2025-2030 (%)

12.7.4 Israel - Market size and forecast 2025-2030

Chart on Israel - Market size and forecast 2025-2030 ($ million)
Data Table on Israel - Market size and forecast 2025-2030 ($ million)
Chart on Israel - Year-over-year growth 2025-2030 (%)
Data Table on Israel - Year-over-year growth 2025-2030 (%)

12.7.5 Turkey - Market size and forecast 2025-2030

Chart on Turkey - Market size and forecast 2025-2030 ($ million)
Data Table on Turkey - Market size and forecast 2025-2030 ($ million)
Chart on Turkey - Year-over-year growth 2025-2030 (%)
Data Table on Turkey - Year-over-year growth 2025-2030 (%)

12.8 Market opportunity by geography

Market opportunity by geography ($ million)
Data Tables on Market opportunity by geography ($ million)

13. Drivers, Challenges, and Opportunity

13.1 Market drivers

Automotive electrification and lightweight materials
Artificial intelligence and smart manufacturing
Proliferation of collaborative welding robots

13.2 Market challenges

High capital expenditure
Complex software integration
Severe labor shortage

13.3 Impact of drivers and challenges

Impact of drivers and challenges in 2025 and 2030

13.4 Market opportunities

Adoption of machine vision systems
Expansion of smart factory infrastructure
Proliferation of teachless robotic programming

14. Competitive Landscape

14.1 Overview

14.2

Overview on criticality of inputs and factors of differentiation

14.3 Landscape disruption

Overview on factors of disruption

14.4 Industry risks

Impact of key risks on business

15. Competitive Analysis

15.1 Companies profiled

Companies covered

15.2 Company ranking index

15.3 Market positioning of companies

Matrix on companies position and classification

15.4 ABB Ltd.

ABB Ltd. - Overview
ABB Ltd. - Business segments
ABB Ltd. - Key news
ABB Ltd. - Key offerings
ABB Ltd. - Segment focus
SWOT

15.5 Carl Cloos Schweibtechnik GmbH

Carl Cloos Schweibtechnik GmbH - Overview
Carl Cloos Schweibtechnik GmbH - Product / Service
Carl Cloos Schweibtechnik GmbH - Key offerings
SWOT

15.6 Comau SpA

Comau SpA - Overview
Comau SpA - Product / Service
Comau SpA - Key offerings
SWOT

15.7 Daihen Corp.

Daihen Corp. - Overview
Daihen Corp. - Business segments
Daihen Corp. - Key offerings
Daihen Corp. - Segment focus
SWOT

15.8 Doosan Corp.

Doosan Corp. - Overview
Doosan Corp. - Business segments
Doosan Corp. - Key news
Doosan Corp. - Key offerings
Doosan Corp. - Segment focus
SWOT

15.9 Efort Intelligent Equipment

Efort Intelligent Equipment - Overview
Efort Intelligent Equipment - Product / Service
Efort Intelligent Equipment - Key offerings
SWOT

15.10 Estun Automation Co. Ltd.

Estun Automation Co. Ltd. - Overview
Estun Automation Co. Ltd. - Business segments
Estun Automation Co. Ltd. - Key offerings
Estun Automation Co. Ltd. - Segment focus
SWOT

15.11 FANUC Corp.

FANUC Corp. - Overview
FANUC Corp. - Business segments
FANUC Corp. - Key offerings
FANUC Corp. - Segment focus
SWOT

15.12 HD Hyundai Robotics

HD Hyundai Robotics - Overview
HD Hyundai Robotics - Product / Service
HD Hyundai Robotics - Key offerings
SWOT

15.13 IGM Robotersysteme AG

IGM Robotersysteme AG - Overview
IGM Robotersysteme AG - Product / Service
IGM Robotersysteme AG - Key offerings
SWOT

15.14 KUKA AG

KUKA AG - Overview
KUKA AG - Product / Service
KUKA AG - Key offerings
SWOT

15.15 Nachi Fujikoshi Corp.

Nachi Fujikoshi Corp. - Overview
Nachi Fujikoshi Corp. - Business segments
Nachi Fujikoshi Corp. - Key offerings
Nachi Fujikoshi Corp. - Segment focus
SWOT

15.16 Panasonic Holdings Corp.

Panasonic Holdings Corp. - Overview
Panasonic Holdings Corp. - Business segments
Panasonic Holdings Corp. - Key news
Panasonic Holdings Corp. - Key offerings
Panasonic Holdings Corp. - Segment focus
SWOT

15.17 SIASUN Robot and Automation CO.

SIASUN Robot and Automation CO. - Overview
SIASUN Robot and Automation CO. - Business segments
SIASUN Robot and Automation CO. - Key offerings
SIASUN Robot and Automation CO. - Segment focus
SWOT

15.18 Yaskawa Electric Corp.

Yaskawa Electric Corp. - Overview
Yaskawa Electric Corp. - Product / Service
Yaskawa Electric Corp. - Key offerings
SWOT

16. Appendix

16.1 Scope of the report

Market definition
Objectives
Notes and caveats

16.2 Inclusions and exclusions checklist

Inclusions checklist
Exclusions checklist

16.3 Currency conversion rates for US$

16.4 Research methodology

16.5 Data procurement

Information sources

16.6 Data validation

16.7 Validation techniques employed for market sizing

16.8 Data synthesis

16.9 360 degree market analysis

16.10 List of abbreviations

Research Methodology

Technavio presents a detailed picture of the market by way of study, synthesis, and summation of data from multiple sources. The analysts have presented the various facets of the market with a particular focus on identifying the key industry influencers. The data thus presented is comprehensive, reliable, and the result of extensive research, both primary and secondary.

INFORMATION SOURCES

Primary sources

  • Manufacturers and suppliers
  • Channel partners
  • Industry experts
  • Strategic decision makers

Secondary sources

  • Industry journals and periodicals
  • Government data
  • Financial reports of key industry players
  • Historical data
  • Press releases

DATA ANALYSIS

Data Synthesis

  • Collation of data
  • Estimation of key figures
  • Analysis of derived insights

Data Validation

  • Triangulation with data models
  • Reference against proprietary databases
  • Corroboration with industry experts

REPORT WRITING

Qualitative

  • Market drivers
  • Market challenges
  • Market trends
  • Five forces analysis

Quantitative

  • Market size and forecast
  • Market segmentation
  • Geographical insights
  • Competitive landscape

Interested in this report?

Get your sample now to see our research methodology and insights!

Download Now

Frequently Asked Questions

Industrial Welding Robots market growth will increase by USD 3745.0 million during 2026-2030.

The Industrial Welding Robots market is expected to grow at a CAGR of 7.2% during 2026-2030.

Industrial Welding Robots market is segmented by Product (Spot welding robots, Arc welding robots, Laser welding robots) End-user (Automotive, Electrical and electronics, Heavy machinery, Others) Capacity (Medium payload, Low payload, Heavy payload)

ABB Ltd., Carl Cloos Schweibtechnik GmbH, Comau SpA, Daihen Corp., Doosan Corp., Efort Intelligent Equipment, Estun Automation Co. Ltd., FANUC Corp., GSK CNC Equipment Co. Ltd., Hanwha Robotics CO. LTD, HD Hyundai Robotics, IGM Robotersysteme AG, JAKA Robotics, Kawasaki Robotics USA Inc., KUKA AG, Nachi Fujikoshi Corp., Panasonic Holdings Corp., SIASUN Robot and Automation CO., Yaskawa Electric Corp. are a few of the key vendors in the Industrial Welding Robots market.

APAC will register the highest growth rate of 60.9% among the other regions. Therefore, the Industrial Welding Robots market in APAC is expected to garner significant business opportunities for the vendors during the forecast period.

China, Japan, India, South Korea, Australia, Indonesia, Germany, UK, France, Italy, Spain, The Netherlands, US, Canada, Mexico, Brazil, Argentina, Chile, Saudi Arabia, UAE, South Africa, Israel, Turkey

  • Automotive electrification and lightweight materials is the driving factor this market.

The Industrial Welding Robots market vendors should focus on grabbing business opportunities from the Product segment as it accounted for the largest market share in the base year.
RIA - Research AI Assistant
Ask RIA
