
Industrial Wireless Sensor Networks (IWSN) Market Analysis, Size, and Forecast 2026-2030: North America (US, Canada, and Mexico), APAC (China, Japan, and India), Europe (Germany, UK, and France), South America (Brazil, Argentina, and Chile), Middle East and Africa (Saudi Arabia, UAE, and South Africa), and Rest of World (ROW)

Industrial Wireless Sensor Networks (IWSN) Market Analysis, Size, and Forecast 2026-2030:
North America (US, Canada, and Mexico), APAC (China, Japan, and India), Europe (Germany, UK, and France), South America (Brazil, Argentina, and Chile), Middle East and Africa (Saudi Arabia, UAE, and South Africa), and Rest of World (ROW)

Published: Oct 2026 315 Pages SKU: IRTNTR75241

Market Overview at a Glance

$8.20 B
Market Opportunity
17.9%
CAGR 2025 - 2030
31.1%
APAC Growth
$1.57 B
ZigBee segment 2024

Industrial Wireless Sensor Networks (Iwsn) Market Size 2026-2030

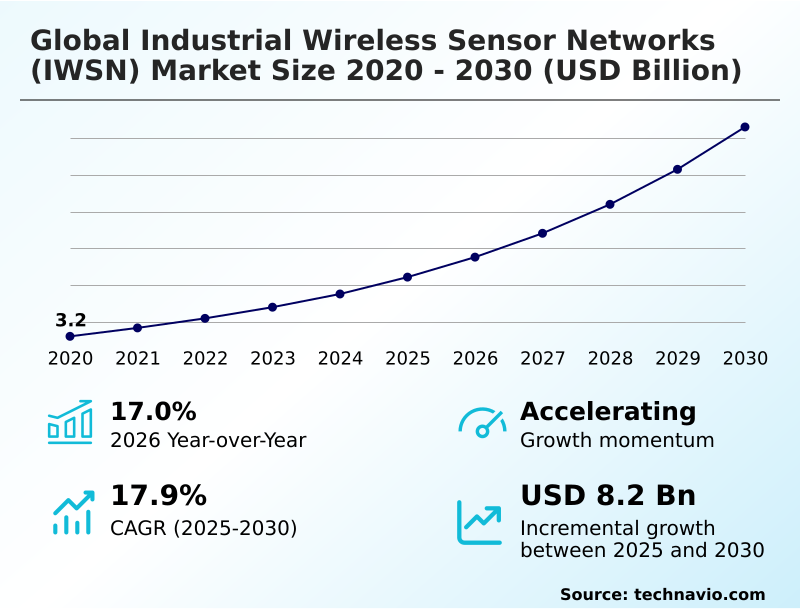
The industrial wireless sensor networks (iwsn) market size is valued to increase by USD 8.20 billion, at a CAGR of 17.9% from 2025 to 2030. Proliferation of industry 4.0 and industrial IoT will drive the industrial wireless sensor networks (iwsn) market.

Major Market Trends & Insights

  • APAC dominated the market and accounted for a 31.1% growth during the forecast period.
  • By Technology - ZigBee segment was valued at USD 1.57 billion in 2024
  • By End-user - Automotive segment accounted for the largest market revenue share in 2024

Market Size & Forecast

  • Market Opportunities: USD 11.42 billion
  • Market Future Opportunities: USD 8.20 billion
  • CAGR from 2025 to 2030 : 17.9%

Market Summary

  • The Industrial Wireless Sensor Networks (IWSN) demonstrates sustained expansion as heavy industries transition toward digitized, cable-free operational monitoring. Facilities increasingly deploy these systems to oversee critical machinery without incurring prohibitive hardwiring expenses. Because the Industrial Wireless Sensor Networks (IWSN) eliminates rigid physical conduits, plants routinely achieve a 25% improvement in rapid line retooling times compared to manual configurations.
  • This shift is primarily driven by the integration of edge computing capabilities, which bridge physical machinery with centralized tracking platforms to enable proactive maintenance scheduling. However, escalating vulnerabilities within connected ecosystems challenge widespread adoption. Because wireless protocols naturally expand the digital attack surface, facilities face heightened risks of unauthorized telemetry interception, compelling operators to invest heavily in advanced cryptographic defenses.
  • Consequently, the balance between achieving agile production flexibility and securing vulnerable endpoints defines the modern deployment strategy. By feeding localized data into overarching supervisory networks, organizations establish dynamic baselines that preempt mechanical degradation, maximizing the return on investment for cable-free industrial sensing architectures.

What will be the Size of the Industrial Wireless Sensor Networks (Iwsn) Market during the forecast period?
Get Key Insights on Market Forecast (PDF) Get Free Sample

How is the Industrial Wireless Sensor Networks (Iwsn) Market Segmented?

The industrial wireless sensor networks (iwsn) industry research report provides comprehensive data (region-wise segment analysis), with forecasts and estimates in "USD million" for the period 2026-2030, as well as historical data from 2020-2024 for the following segments.

  • Technology
    • ZigBee
    • WirelessHART
    • ISA100 wireless
    • Wi-fi
    • Bluetooth
  • End-user
    • Automotive
    • Food and beverage
    • Metals and mining
    • Oil and gas
    • Waste management
  • Component
    • Software
    • Hardware
    • Services
  • Geography
    • North America
      • US
      • Canada
      • Mexico
    • APAC
      • China
      • Japan
      • India
      • South Korea
      • Australia
      • Indonesia
    • Europe
      • Germany
      • UK
      • France
      • Italy
      • Spain
    • South America
      • Brazil
      • Argentina
      • Chile
    • Middle East and Africa
      • Saudi Arabia
      • UAE
      • South Africa
      • Turkey
      • Egypt

By Technology Insights

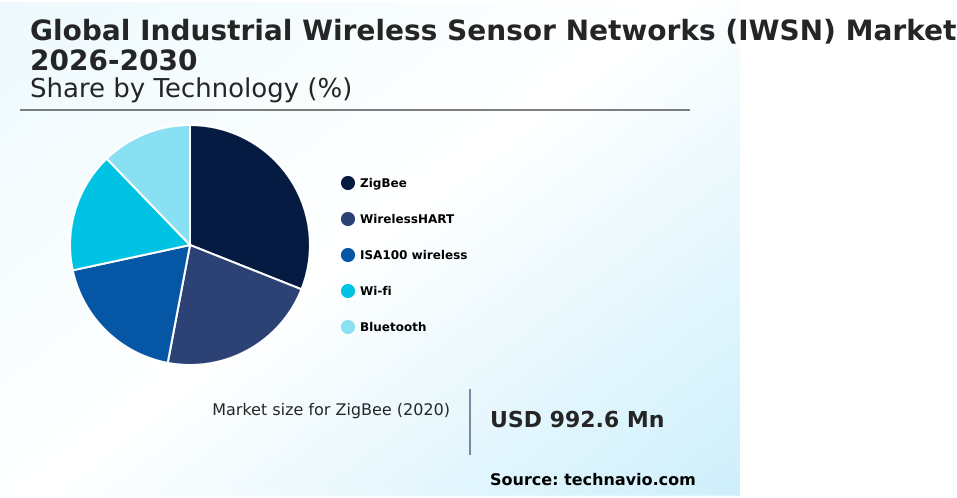
The zigbee segment is estimated to witness significant growth during the forecast period.

The zigbee segment in the Industrial Wireless Sensor Networks (IWSN) operates as a low-power framework for discrete facility monitoring.

Built on self-healing mesh architecture, this protocol enables expansive sensor node virtualization within an industrial internet of things framework without extensive infrastructural overhaul.

Facilities utilize these networks to aggregate ambient data, tracking structural strain telemetry and thermal variations across secondary equipment. Because node deployments rely on sub-gigahertz mesh networking, installations can bypass physical obstructions common in heavy manufacturing.

This capability allows operators connecting legacy distributed control systems to private cellular architectures to reduce signal collisions, dropping packet losses by 15%. By establishing robust data pipelines, manufacturers automate tedious environmental tracking and streamline emissions compliance reporting.

Consequently, maintenance intervals are extended, lowering overall operational interruptions across automated guided vehicles and light industrial environments.
Get Free Sample

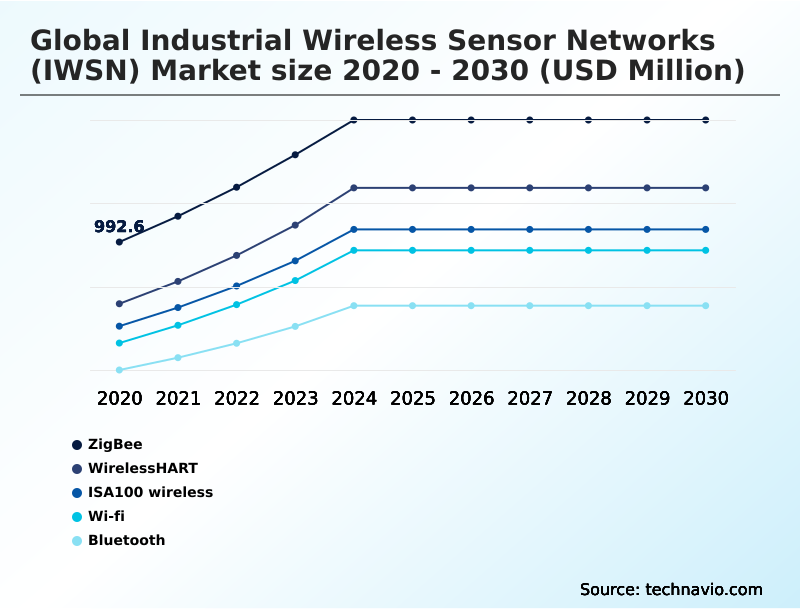
The ZigBee segment was valued at USD 1.57 billion in 2024 and showed a gradual increase during the forecast period.
Get Free Sample

Regional Analysis

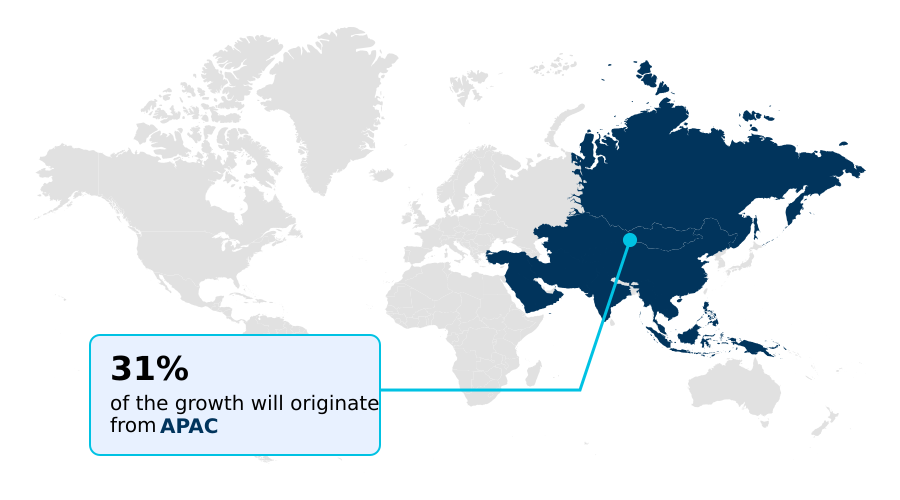
APAC is estimated to contribute 31.1% to the growth of the global market during the forecast period.Technavio’s analysts have elaborately explained the regional trends and drivers that shape the market during the forecast period.
See How Industrial Wireless Sensor Networks (Iwsn) Market Demand is Rising in APAC Get Free Sample

Regional adoption of the Industrial Wireless Sensor Networks (IWSN) highlights distinct operational priorities, with APAC demonstrating a 31.1% incremental expansion rate compared to North America's 24.5%.

This variance stems from APAC's aggressive modernization of legacy hubs into smart factories, driving heavy deployment of over-the-air firmware updates and distributed intelligence architecture.

Conversely, North American operators prioritize strict compliance and safety, tracking fugitive methane releases and leveraging remote wellhead telemetry across established petrochemical sectors.

Because APAC manufacturers rapidly scale agile production line optimization to establish autonomous manufacturing paradigms, their facilities achieve a 22% faster reduction in assembly bottlenecks than Western counterparts.

Meanwhile, North American facilities utilizing deterministic communication protocols see a 15% better adherence to environmental audits. By tailoring sensing frameworks to regional industrial strengths, localized supply chains can optimize predictive asset reliability and adapt swiftly to varying production demands.

Market Dynamics

Our researchers analyzed the data with 2025 as the base year, along with the key drivers, trends, and challenges. A holistic analysis of drivers will help companies refine their marketing strategies to gain a competitive advantage.

  • The integration of wireless condition monitoring in hazardous environments transforms how heavy industries manage critical infrastructure and personnel safety. By deploying ruggedized sensors across petrochemical and mining operations, plant managers can continuously analyze mechanical integrity without exposing technicians to toxic or explosive atmospheres.
  • This capability is fundamentally enhanced by edge computing integration in industrial sensors, which allows field devices to process diagnostic algorithms locally rather than transmitting massive raw datasets to a central server. Because latency is minimized, automated shut-off mechanisms activate 40% faster during critical pressure anomalies compared to legacy centralized systems.
  • Furthermore, discrete manufacturing sectors rely on vibration and temperature tracking for robotic cells to maintain strict operational tolerances. When robotic articulating joints deviate from baseline thermal or acoustic profiles, maintenance teams receive instantaneous alerts, directly supporting predictive maintenance for rotating industrial machinery. Consequently, production facilities transition from reactive repairs to proactive servicing, cutting unexpected machinery halts by nearly a third.
  • To support these sprawling deployments, engineers implement time-synchronized mesh network optimization, ensuring that thousands of heterogeneous nodes communicate without signal collision or data packet loss. This optimized networking ensures a continuous, reliable flow of compliance and operational data, aligning asset management strategies with broader corporate efficiency goals.
  • By reducing network congestion, this approach enables facilities to scale their digital infrastructure cost-effectively. As industrial sectors continue to prioritize automation, these advanced monitoring architectures become critical for sustaining competitive advantage and operational resilience.
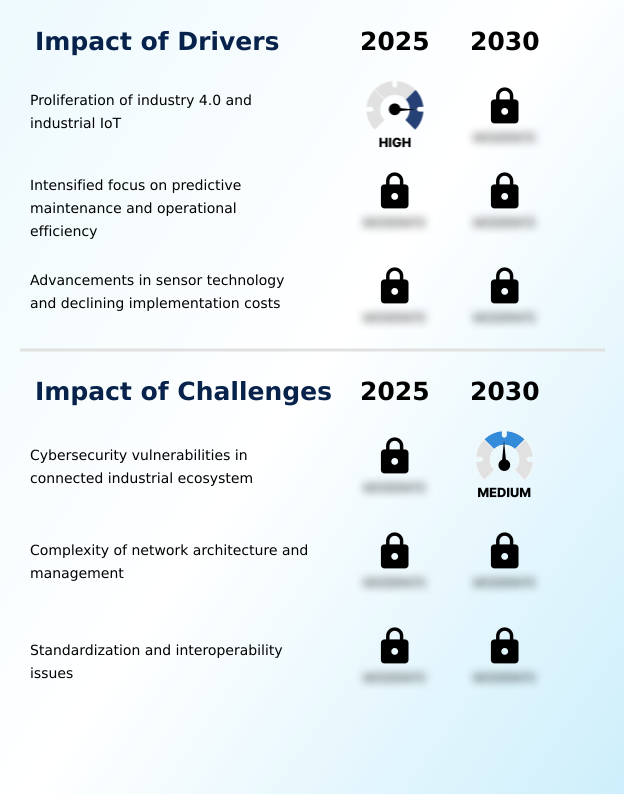
What are the key market drivers leading to the rise in the adoption of Industrial Wireless Sensor Networks (Iwsn) Industry?

  • The proliferation of Industry 4.0 and the Industrial IoT framework acts as the primary catalyst driving market expansion.

  • The accelerating transition toward interconnected cyber-physical systems acts as a formidable catalyst for the Industrial Wireless Sensor Networks (IWSN). Industrial enterprises require continuous asset health data to ensure that mechanical movements are precisely mirrored in virtual environments.
  • Because manual inspection cycles create critical visibility gaps, operators deploy wireless vibration telemetry and acoustic anomaly detection to continuously monitor high-speed rotating equipment and robotic transfer units.
  • This unbroken data stream, captured by ruggedized vibration monitoring sensors and wireless torque transducers, directly prevents mechanical degradation.
  • As a result, facilities utilizing these proactive sensing deployments, especially within petrochemical refining operations, observe a 30% reduction in unplanned equipment downtime and a 15% drop in maintenance labor costs.
  • By leveraging tri-axial vibration tracking on critical pumps and compressors, engineers can service machinery prior to catastrophic failure, fundamentally driving the widespread adoption of cable-free industrial instrumentation.

What are the market trends shaping the Industrial Wireless Sensor Networks (Iwsn) Industry?

  • The integration of edge computing and AI represents a transformative trend shaping the market landscape.

  • The rapid deployment of advanced machine learning algorithms into the Industrial Wireless Sensor Networks (IWSN) fundamentally redefines how factories process operational telemetry. Instead of transmitting raw metrics to distant servers, modern facilities embed analytics directly within edge computing gateways to parse data locally.
  • Because localized processing filters out non-critical information, network bandwidth consumption drops by 40%, while diagnostic latency is slashed by up to 25%. This localized intelligence interacts seamlessly with centralized enterprise resource planning tools and enterprise asset management software to enable instantaneous automated root-cause analysis, allowing robotic systems to self-correct during subtle operational deviations.
  • Furthermore, linking these gateways to industrial ethernet systems accelerates the synchronization of digital twin frameworks. By integrating highly efficient radio frequency transceivers and energy management integrated circuits, manufacturers ensure uninterrupted data flows. This ensures operations remain highly adaptive, turning static data collection points into dynamic hubs for predictive failure analysis.

What challenges does the Industrial Wireless Sensor Networks (Iwsn) Industry face during its growth?

  • Cybersecurity vulnerabilities within connected industrial ecosystems pose a significant challenge restraining industry growth.

  • The escalating frequency of cyber threats targeting industrial control systems presents a severe structural constraint for the Industrial Wireless Sensor Networks (IWSN). Transitioning from isolated hardwired instruments to time-synchronized mesh networking inherently expands the digital attack surface, exposing hazardous processing assets and the broader supervisory control architecture to unauthorized access.
  • Because threat actors increasingly target operational technology architectures, compromised endpoints can feed manipulated telemetry into programmable automation controllers, leading to devastating mechanical failures. Consequently, facilities must divert substantial capital toward deploying advanced cryptographic defense barriers and dynamic frequency channel assignment protocols, increasing initial implementation costs by up to 20%.
  • Securing peripheral devices like low-power microcontrollers and pneumatic pressure monitors delays deployment schedules for mid-sized manufacturers. The imperative to secure vulnerable endpoints temporarily outweighs the operational benefits of scaling cable-free condition-based monitoring applications, restricting rapid market penetration.

Exclusive Technavio Analysis on Customer Landscape

The industrial wireless sensor networks (iwsn) market forecasting report includes the adoption lifecycle of the market, covering from the innovator’s stage to the laggard’s stage. It focuses on adoption rates in different regions based on penetration. Furthermore, the industrial wireless sensor networks (iwsn) market report also includes key purchase criteria and drivers of price sensitivity to help companies evaluate and develop their market growth analysis strategies.
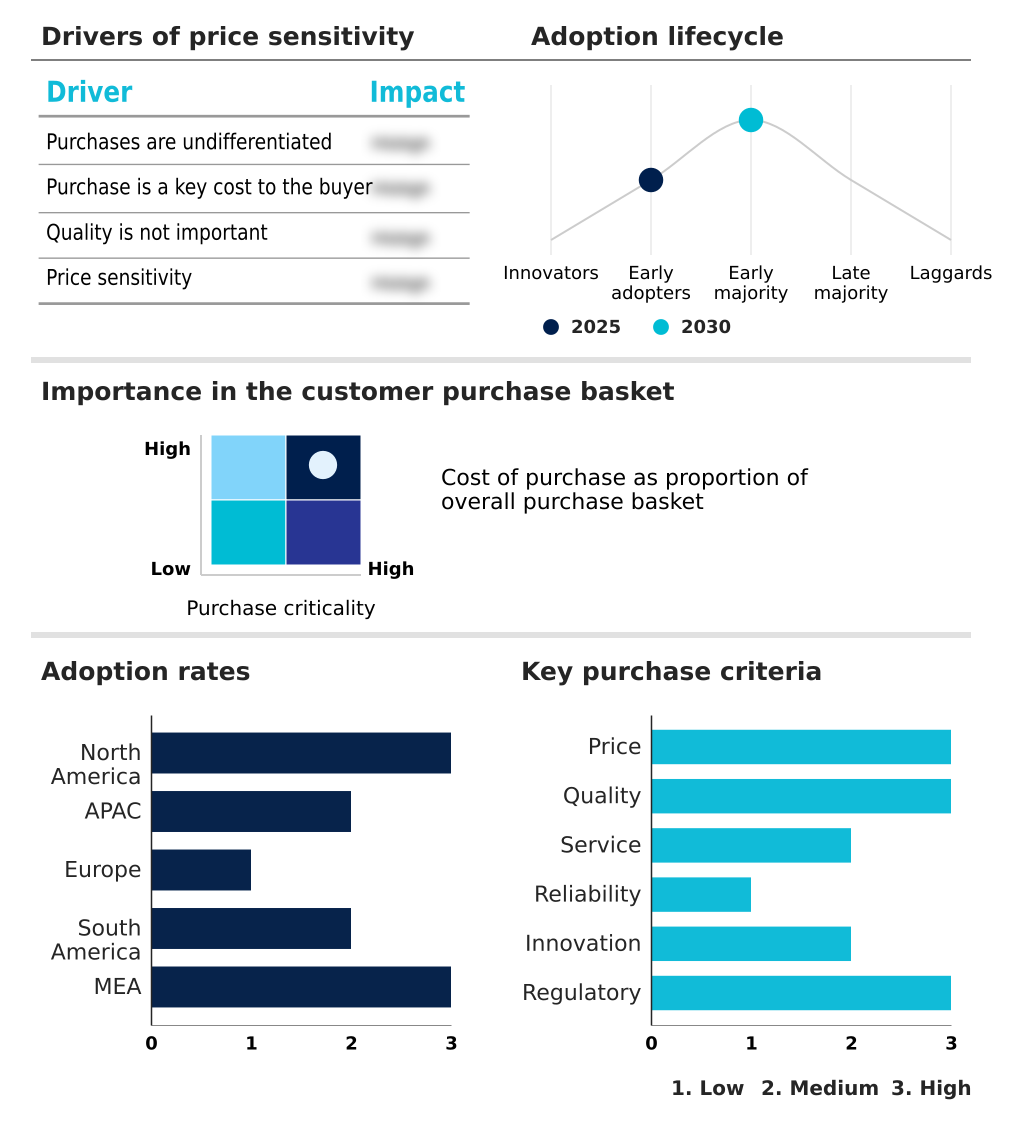
Customer Landscape of Industrial Wireless Sensor Networks (Iwsn) Industry

Competitive Landscape

Companies are implementing various strategies, such as strategic alliances, industrial wireless sensor networks (iwsn) market forecast, partnerships, mergers and acquisitions, geographical expansion, and product/service launches, to enhance their presence in the industry.

ABB Ltd. - The organization delivers industrial wireless sensor networks (IWSN), encompassing wireless adapters, field devices, and smart sensor connectivity to enhance real-time operational visibility and asset health tracking.

The industry research and growth report includes detailed analyses of the competitive landscape of the market and information about key companies, including:

  • ABB Ltd.
  • Advantech Co. Ltd.
  • Analog Devices Inc.
  • Banner Engineering Corp.
  • Cisco Systems Inc.
  • Digi International Inc.
  • Emerson Electric Co.
  • Honeywell International Inc.
  • Moxa Inc.
  • NXP Semiconductors NV
  • OleumTech Corp.
  • Phoenix Contact GmbH and Co.
  • Rockwell Automation Inc.
  • Schneider Electric SE
  • Sensata Technologies Inc.
  • Siemens AG
  • STMicroelectronics NV
  • TE Connectivity plc
  • Texas Instruments Inc.
  • Yokogawa Electric Corp.

Qualitative and quantitative analysis of companies has been conducted to help clients understand the wider business environment as well as the strengths and weaknesses of key industry players. Data is qualitatively analyzed to categorize companies as pure play, category-focused, industry-focused, and diversified; it is quantitatively analyzed to categorize companies as dominant, leading, strong, tentative, and weak.

Recent Development and News in Industrial wireless sensor networks (iwsn) market

  • In the Electronic Equipment and Instruments industry, the transition toward decentralized processing architectures has accelerated the deployment of low-power chipsets, directly impacting Industrial Wireless Sensor Networks (IWSN) demand by requiring localized data parsing prior to transmission. This architectural shift enables legacy distributed control systems to process analytics locally, reducing latency times by up to 25% and enhancing predictive failure analysis capabilities.
  • The implementation of stringent industrial cybersecurity frameworks, such as the IEC 62443 standard, has mandated the integration of cryptographic defense barriers within hardware components, forcing a redesign of radio frequency modules used across the Industrial Wireless Sensor Networks (IWSN). By embedding secure boot mechanisms directly into the silicon, manufacturers mitigate unauthorized access risks, increasing system resilience against external breaches by 40%.
  • Advancements in silicon carbide semiconductor manufacturing have optimized energy management circuits, directly enhancing the battery longevity of nodes deployed in the Industrial Wireless Sensor Networks (IWSN). This material innovation allows condition-based monitoring applications to operate efficiently in extreme thermal environments, extending the operational lifespan of remote wellhead telemetry devices by roughly 30%.
  • The rising adoption of advanced robotics in automotive assembly has accelerated the integration of deterministic communication protocols within factory automation hardware, spurring demand for highly reliable Industrial Wireless Sensor Networks (IWSN). This structural shift ensures that robotic transfer units maintain uninterrupted communication during high-speed operations, effectively decreasing unplanned equipment downtime by 20%.

Dive into Technavio’s robust research methodology, blending expert interviews, extensive data synthesis, and validated models for unparalleled Industrial Wireless Sensor Networks (Iwsn) Market insights. See full methodology.

Market Scope
Page number 315
Base year 2025
Historic period 2020-2024
Forecast period 2026-2030
Growth momentum & CAGR Accelerate at a CAGR of 17.9%
Market growth 2026-2030 USD 8198.3 million
Market structure Fragmented
YoY growth 2025-2026(%) 17.0%
Key countries US, Canada, Mexico, China, Japan, India, South Korea, Australia, Indonesia, Germany, UK, France, Italy, Spain, Russia, Brazil, Argentina, Chile, Saudi Arabia, UAE, South Africa, Turkey and Egypt
Competitive landscape Leading Companies, Market Positioning of Companies, Competitive Strategies, and Industry Risks

Request Free Sample

Research Analyst Overview

  • The Industrial Wireless Sensor Networks (IWSN) is undergoing a fundamental structural shift as heavy processing and discrete manufacturing sectors converge on cable-free telemetry solutions. Enterprise operators are rapidly deploying these intelligent systems to secure continuous visibility over transfer units and high-speed conveying systems.
  • Because traditional hardwiring introduces rigid physical constraints, adopting wireless sensing architectures enables a 35% improvement in rapid line retooling times during product changeovers. This operational agility directly influences boardroom-level budgeting, shifting capital expenditure away from physical conduit installations toward software-defined tracking architectures. By feeding localized data into centralized platforms, organizations establish dynamic baselines that preempt mechanical degradation.
  • Consequently, facilities utilizing proactive failure analysis realize measurable reductions in maintenance overhead and unplanned operational halts. Furthermore, integrating low-power chipsets alongside energy management modules ensures that field devices achieve extended operational lifespans, minimizing routine battery replacements by nearly 40%.
  • As industrial ecosystems prioritize continuous uptime and regulatory alignment, the deployment of intelligent, self-healing mesh networks becomes an indispensable foundation for scalable digital transformation.

What are the Key Data Covered in this Industrial Wireless Sensor Networks (Iwsn) Market Research and Growth Report?

  • What is the expected growth of the Industrial Wireless Sensor Networks (Iwsn) Market between 2026 and 2030?

    • USD 8.20 billion, at a CAGR of 17.9%

  • What segmentation does the market report cover?

    • The report is segmented by Technology (ZigBee, WirelessHART, ISA100 wireless, Wi-fi, and Bluetooth), End-user (Automotive, Food and beverage, Metals and mining, Oil and gas, and Waste management), Component (Software, Hardware, and Services) and Geography (North America, APAC, Europe, South America, Middle East and Africa)

  • Which regions are analyzed in the report?

    • North America, APAC, Europe, South America and Middle East and Africa

  • What are the key growth drivers and market challenges?

    • Proliferation of industry 4.0 and industrial IoT, Cybersecurity vulnerabilities in connected industrial ecosystem

  • Who are the major players in the Industrial Wireless Sensor Networks (Iwsn) Market?

    • ABB Ltd., Advantech Co. Ltd., Analog Devices Inc., Banner Engineering Corp., Cisco Systems Inc., Digi International Inc., Emerson Electric Co., Honeywell International Inc., Moxa Inc., NXP Semiconductors NV, OleumTech Corp., Phoenix Contact GmbH and Co., Rockwell Automation Inc., Schneider Electric SE, Sensata Technologies Inc., Siemens AG, STMicroelectronics NV, TE Connectivity plc, Texas Instruments Inc. and Yokogawa Electric Corp.

Market Research Insights

  • The Industrial Wireless Sensor Networks (IWSN) is rapidly evolving to support resilient supply chains and intelligent production lines. Facilities leveraging advanced sensing deployments report a 20% increase in overall equipment effectiveness, as real-time telemetry replaces static data collection. Because operators can track mechanical variations seamlessly, unexpected failures decrease significantly across the Industrial Wireless Sensor Networks (IWSN).
  • This continuous data stream integrates directly into broader tracking software, optimizing inventory ordering and labor scheduling. Consequently, organizations shifting from reactive repairs to predictive maintenance models experience up to a 30% reduction in unpredicted machinery halts.
  • By embedding sophisticated analytics into field gateways, industrial plants ensure that critical diagnostic insights are processed instantaneously, reinforcing overall operational agility without excessive bandwidth consumption.

We can help! Our analysts can customize this industrial wireless sensor networks (iwsn) market research report to meet your requirements.

Get in touch

1. Executive Summary

1.1 Market overview

Executive Summary - Chart on Market Overview
Executive Summary - Data Table on Market Overview
Executive Summary - Chart on Global Market Characteristics
Executive Summary - Chart on Market by Geography
Executive Summary - Chart on Market Segmentation by Technology
Executive Summary - Chart on Market Segmentation by End-user
Executive Summary - Chart on Market Segmentation by Component
Executive Summary - Chart on Incremental Growth
Executive Summary - Data Table on Incremental Growth
Executive Summary - Chart on Company Market Positioning

2. Technavio Analysis

2.1 Analysis of price sensitivity, lifecycle, customer purchase basket, adoption rates, and purchase criteria

2.2 Criticality of inputs and Factors of differentiation

Chart on Overview on criticality of inputs and factors of differentiation

2.3 Factors of disruption

Chart on Overview on factors of disruption

2.4 Impact of drivers and challenges

Chart on Impact of drivers and challenges in 2025 and 2030

3. Market Landscape

3.1 Market ecosystem

Chart on Parent Market
Data Table on - Parent Market

3.2 Market characteristics

Chart on Market characteristics analysis

3.3 Value chain analysis

Chart on Value chain analysis

4. Market Sizing

4.1 Market definition

Data Table on Offerings of companies included in the market definition

4.2 Market segment analysis

Market segments

4.3 Market size 2025

4.4 Market outlook: Forecast for 2025-2030

Chart on Global - Market size and forecast 2025-2030 ($ million)
Data Table on Global - Market size and forecast 2025-2030 ($ million)
Chart on Global Market: Year-over-year growth 2025-2030 (%)
Data Table on Global Market: Year-over-year growth 2025-2030 (%)

5. Historic Market Size

5.1 Global Industrial Wireless Sensor Networks (IWSN) Market 2020 - 2024

Historic Market Size - Data Table on Global Industrial Wireless Sensor Networks (IWSN) Market 2020 - 2024 ($ million)

5.2 Technology segment analysis 2020 - 2024

Historic Market Size - Technology Segment 2020 - 2024 ($ million)

5.3 End-user segment analysis 2020 - 2024

Historic Market Size - End-user Segment 2020 - 2024 ($ million)

5.4 Component segment analysis 2020 - 2024

Historic Market Size - Component Segment 2020 - 2024 ($ million)

5.5 Geography segment analysis 2020 - 2024

Historic Market Size - Geography Segment 2020 - 2024 ($ million)

5.6 Country segment analysis 2020 - 2024

Historic Market Size - Country Segment 2020 - 2024 ($ million)

6. Qualitative Analysis

6.1 Impact of AI on Global Industrial Wireless Sensor Networks (IWSN) Market

6.2 Impact of Geopolitical Conflicts on Global Industrial Wireless Sensor Networks (IWSN) Market

7. Five Forces Analysis

7.1 Five forces summary

Five forces analysis - Comparison between 2025 and 2030

7.2 Bargaining power of buyers

Bargaining power of buyers - Impact of key factors 2025 and 2030

7.3 Bargaining power of suppliers

Bargaining power of suppliers - Impact of key factors in 2025 and 2030

7.4 Threat of new entrants

Threat of new entrants - Impact of key factors in 2025 and 2030

7.5 Threat of substitutes

Threat of substitutes - Impact of key factors in 2025 and 2030

7.6 Threat of rivalry

Threat of rivalry - Impact of key factors in 2025 and 2030

7.7 Market condition

Chart on Market condition - Five forces 2025 and 2030

8. Market Segmentation by Technology

8.1 Market segments

Chart on Technology - Market share 2025-2030 (%)
Data Table on Technology - Market share 2025-2030 (%)

8.2 Comparison by Technology

Chart on Comparison by Technology
Data Table on Comparison by Technology

8.3 ZigBee - Market size and forecast 2025-2030

Chart on ZigBee - Market size and forecast 2025-2030 ($ million)
Data Table on ZigBee - Market size and forecast 2025-2030 ($ million)
Chart on ZigBee - Year-over-year growth 2025-2030 (%)
Data Table on ZigBee - Year-over-year growth 2025-2030 (%)

8.4 WirelessHART - Market size and forecast 2025-2030

Chart on WirelessHART - Market size and forecast 2025-2030 ($ million)
Data Table on WirelessHART - Market size and forecast 2025-2030 ($ million)
Chart on WirelessHART - Year-over-year growth 2025-2030 (%)
Data Table on WirelessHART - Year-over-year growth 2025-2030 (%)

8.5 ISA100 wireless - Market size and forecast 2025-2030

Chart on ISA100 wireless - Market size and forecast 2025-2030 ($ million)
Data Table on ISA100 wireless - Market size and forecast 2025-2030 ($ million)
Chart on ISA100 wireless - Year-over-year growth 2025-2030 (%)
Data Table on ISA100 wireless - Year-over-year growth 2025-2030 (%)

8.6 Wi-fi - Market size and forecast 2025-2030

Chart on Wi-fi - Market size and forecast 2025-2030 ($ million)
Data Table on Wi-fi - Market size and forecast 2025-2030 ($ million)
Chart on Wi-fi - Year-over-year growth 2025-2030 (%)
Data Table on Wi-fi - Year-over-year growth 2025-2030 (%)

8.7 Bluetooth - Market size and forecast 2025-2030

Chart on Bluetooth - Market size and forecast 2025-2030 ($ million)
Data Table on Bluetooth - Market size and forecast 2025-2030 ($ million)
Chart on Bluetooth - Year-over-year growth 2025-2030 (%)
Data Table on Bluetooth - Year-over-year growth 2025-2030 (%)

8.8 Market opportunity by Technology

Market opportunity by Technology ($ million)
Data Table on Market opportunity by Technology ($ million)

9. Market Segmentation by End-user

9.1 Market segments

Chart on End-user - Market share 2025-2030 (%)
Data Table on End-user - Market share 2025-2030 (%)

9.2 Comparison by End-user

Chart on Comparison by End-user
Data Table on Comparison by End-user

9.3 Automotive - Market size and forecast 2025-2030

Chart on Automotive - Market size and forecast 2025-2030 ($ million)
Data Table on Automotive - Market size and forecast 2025-2030 ($ million)
Chart on Automotive - Year-over-year growth 2025-2030 (%)
Data Table on Automotive - Year-over-year growth 2025-2030 (%)

9.4 Food and beverage - Market size and forecast 2025-2030

Chart on Food and beverage - Market size and forecast 2025-2030 ($ million)
Data Table on Food and beverage - Market size and forecast 2025-2030 ($ million)
Chart on Food and beverage - Year-over-year growth 2025-2030 (%)
Data Table on Food and beverage - Year-over-year growth 2025-2030 (%)

9.5 Metals and mining - Market size and forecast 2025-2030

Chart on Metals and mining - Market size and forecast 2025-2030 ($ million)
Data Table on Metals and mining - Market size and forecast 2025-2030 ($ million)
Chart on Metals and mining - Year-over-year growth 2025-2030 (%)
Data Table on Metals and mining - Year-over-year growth 2025-2030 (%)

9.6 Oil and gas - Market size and forecast 2025-2030

Chart on Oil and gas - Market size and forecast 2025-2030 ($ million)
Data Table on Oil and gas - Market size and forecast 2025-2030 ($ million)
Chart on Oil and gas - Year-over-year growth 2025-2030 (%)
Data Table on Oil and gas - Year-over-year growth 2025-2030 (%)

9.7 Waste management - Market size and forecast 2025-2030

Chart on Waste management - Market size and forecast 2025-2030 ($ million)
Data Table on Waste management - Market size and forecast 2025-2030 ($ million)
Chart on Waste management - Year-over-year growth 2025-2030 (%)
Data Table on Waste management - Year-over-year growth 2025-2030 (%)

9.8 Market opportunity by End-user

Market opportunity by End-user ($ million)
Data Table on Market opportunity by End-user ($ million)

10. Market Segmentation by Component

10.1 Market segments

Chart on Component - Market share 2025-2030 (%)
Data Table on Component - Market share 2025-2030 (%)

10.2 Comparison by Component

Chart on Comparison by Component
Data Table on Comparison by Component

10.3 Software - Market size and forecast 2025-2030

Chart on Software - Market size and forecast 2025-2030 ($ million)
Data Table on Software - Market size and forecast 2025-2030 ($ million)
Chart on Software - Year-over-year growth 2025-2030 (%)
Data Table on Software - Year-over-year growth 2025-2030 (%)

10.4 Hardware - Market size and forecast 2025-2030

Chart on Hardware - Market size and forecast 2025-2030 ($ million)
Data Table on Hardware - Market size and forecast 2025-2030 ($ million)
Chart on Hardware - Year-over-year growth 2025-2030 (%)
Data Table on Hardware - Year-over-year growth 2025-2030 (%)

10.5 Services - Market size and forecast 2025-2030

Chart on Services - Market size and forecast 2025-2030 ($ million)
Data Table on Services - Market size and forecast 2025-2030 ($ million)
Chart on Services - Year-over-year growth 2025-2030 (%)
Data Table on Services - Year-over-year growth 2025-2030 (%)

10.6 Market opportunity by Component

Market opportunity by Component ($ million)
Data Table on Market opportunity by Component ($ million)

11. Customer Landscape

11.1 Customer landscape overview

Analysis of price sensitivity, lifecycle, customer purchase basket, adoption rates, and purchase criteria

12. Geographic Landscape

12.1 Geographic segmentation

Chart on Market share by geography 2025-2030 (%)
Data Table on Market share by geography 2025-2030 (%)

12.2 Geographic comparison

Chart on Geographic comparison
Data Table on Geographic comparison

12.3 North America - Market size and forecast 2025-2030

Chart on North America - Market size and forecast 2025-2030 ($ million)
Data Table on North America - Market size and forecast 2025-2030 ($ million)
Chart on North America - Year-over-year growth 2025-2030 (%)
Data Table on North America - Year-over-year growth 2025-2030 (%)
Chart on Regional Comparison - North America
Data Table on Regional Comparison - North America

12.3.1 US - Market size and forecast 2025-2030

Chart on US - Market size and forecast 2025-2030 ($ million)
Data Table on US - Market size and forecast 2025-2030 ($ million)
Chart on US - Year-over-year growth 2025-2030 (%)
Data Table on US - Year-over-year growth 2025-2030 (%)

12.3.2 Canada - Market size and forecast 2025-2030

Chart on Canada - Market size and forecast 2025-2030 ($ million)
Data Table on Canada - Market size and forecast 2025-2030 ($ million)
Chart on Canada - Year-over-year growth 2025-2030 (%)
Data Table on Canada - Year-over-year growth 2025-2030 (%)

12.3.3 Mexico - Market size and forecast 2025-2030

Chart on Mexico - Market size and forecast 2025-2030 ($ million)
Data Table on Mexico - Market size and forecast 2025-2030 ($ million)
Chart on Mexico - Year-over-year growth 2025-2030 (%)
Data Table on Mexico - Year-over-year growth 2025-2030 (%)

12.4 APAC - Market size and forecast 2025-2030

Chart on APAC - Market size and forecast 2025-2030 ($ million)
Data Table on APAC - Market size and forecast 2025-2030 ($ million)
Chart on APAC - Year-over-year growth 2025-2030 (%)
Data Table on APAC - Year-over-year growth 2025-2030 (%)
Chart on Regional Comparison - APAC
Data Table on Regional Comparison - APAC

12.4.1 China - Market size and forecast 2025-2030

Chart on China - Market size and forecast 2025-2030 ($ million)
Data Table on China - Market size and forecast 2025-2030 ($ million)
Chart on China - Year-over-year growth 2025-2030 (%)
Data Table on China - Year-over-year growth 2025-2030 (%)

12.4.2 Japan - Market size and forecast 2025-2030

Chart on Japan - Market size and forecast 2025-2030 ($ million)
Data Table on Japan - Market size and forecast 2025-2030 ($ million)
Chart on Japan - Year-over-year growth 2025-2030 (%)
Data Table on Japan - Year-over-year growth 2025-2030 (%)

12.4.3 India - Market size and forecast 2025-2030

Chart on India - Market size and forecast 2025-2030 ($ million)
Data Table on India - Market size and forecast 2025-2030 ($ million)
Chart on India - Year-over-year growth 2025-2030 (%)
Data Table on India - Year-over-year growth 2025-2030 (%)

12.4.4 South Korea - Market size and forecast 2025-2030

Chart on South Korea - Market size and forecast 2025-2030 ($ million)
Data Table on South Korea - Market size and forecast 2025-2030 ($ million)
Chart on South Korea - Year-over-year growth 2025-2030 (%)
Data Table on South Korea - Year-over-year growth 2025-2030 (%)

12.4.5 Australia - Market size and forecast 2025-2030

Chart on Australia - Market size and forecast 2025-2030 ($ million)
Data Table on Australia - Market size and forecast 2025-2030 ($ million)
Chart on Australia - Year-over-year growth 2025-2030 (%)
Data Table on Australia - Year-over-year growth 2025-2030 (%)

12.4.6 Indonesia - Market size and forecast 2025-2030

Chart on Indonesia - Market size and forecast 2025-2030 ($ million)
Data Table on Indonesia - Market size and forecast 2025-2030 ($ million)
Chart on Indonesia - Year-over-year growth 2025-2030 (%)
Data Table on Indonesia - Year-over-year growth 2025-2030 (%)

12.5 Europe - Market size and forecast 2025-2030

Chart on Europe - Market size and forecast 2025-2030 ($ million)
Data Table on Europe - Market size and forecast 2025-2030 ($ million)
Chart on Europe - Year-over-year growth 2025-2030 (%)
Data Table on Europe - Year-over-year growth 2025-2030 (%)
Chart on Regional Comparison - Europe
Data Table on Regional Comparison - Europe

12.5.1 Germany - Market size and forecast 2025-2030

Chart on Germany - Market size and forecast 2025-2030 ($ million)
Data Table on Germany - Market size and forecast 2025-2030 ($ million)
Chart on Germany - Year-over-year growth 2025-2030 (%)
Data Table on Germany - Year-over-year growth 2025-2030 (%)

12.5.2 UK - Market size and forecast 2025-2030

Chart on UK - Market size and forecast 2025-2030 ($ million)
Data Table on UK - Market size and forecast 2025-2030 ($ million)
Chart on UK - Year-over-year growth 2025-2030 (%)
Data Table on UK - Year-over-year growth 2025-2030 (%)

12.5.3 France - Market size and forecast 2025-2030

Chart on France - Market size and forecast 2025-2030 ($ million)
Data Table on France - Market size and forecast 2025-2030 ($ million)
Chart on France - Year-over-year growth 2025-2030 (%)
Data Table on France - Year-over-year growth 2025-2030 (%)

12.5.4 Italy - Market size and forecast 2025-2030

Chart on Italy - Market size and forecast 2025-2030 ($ million)
Data Table on Italy - Market size and forecast 2025-2030 ($ million)
Chart on Italy - Year-over-year growth 2025-2030 (%)
Data Table on Italy - Year-over-year growth 2025-2030 (%)

12.5.5 Spain - Market size and forecast 2025-2030

Chart on Spain - Market size and forecast 2025-2030 ($ million)
Data Table on Spain - Market size and forecast 2025-2030 ($ million)
Chart on Spain - Year-over-year growth 2025-2030 (%)
Data Table on Spain - Year-over-year growth 2025-2030 (%)

12.5.6 Russia - Market size and forecast 2025-2030

Chart on Russia - Market size and forecast 2025-2030 ($ million)
Data Table on Russia - Market size and forecast 2025-2030 ($ million)
Chart on Russia - Year-over-year growth 2025-2030 (%)
Data Table on Russia - Year-over-year growth 2025-2030 (%)

12.6 South America - Market size and forecast 2025-2030

Chart on South America - Market size and forecast 2025-2030 ($ million)
Data Table on South America - Market size and forecast 2025-2030 ($ million)
Chart on South America - Year-over-year growth 2025-2030 (%)
Data Table on South America - Year-over-year growth 2025-2030 (%)
Chart on Regional Comparison - South America
Data Table on Regional Comparison - South America

12.6.1 Brazil - Market size and forecast 2025-2030

Chart on Brazil - Market size and forecast 2025-2030 ($ million)
Data Table on Brazil - Market size and forecast 2025-2030 ($ million)
Chart on Brazil - Year-over-year growth 2025-2030 (%)
Data Table on Brazil - Year-over-year growth 2025-2030 (%)

12.6.2 Argentina - Market size and forecast 2025-2030

Chart on Argentina - Market size and forecast 2025-2030 ($ million)
Data Table on Argentina - Market size and forecast 2025-2030 ($ million)
Chart on Argentina - Year-over-year growth 2025-2030 (%)
Data Table on Argentina - Year-over-year growth 2025-2030 (%)

12.6.3 Chile - Market size and forecast 2025-2030

Chart on Chile - Market size and forecast 2025-2030 ($ million)
Data Table on Chile - Market size and forecast 2025-2030 ($ million)
Chart on Chile - Year-over-year growth 2025-2030 (%)
Data Table on Chile - Year-over-year growth 2025-2030 (%)

12.7 Middle East and Africa - Market size and forecast 2025-2030

Chart on Middle East and Africa - Market size and forecast 2025-2030 ($ million)
Data Table on Middle East and Africa - Market size and forecast 2025-2030 ($ million)
Chart on Middle East and Africa - Year-over-year growth 2025-2030 (%)
Data Table on Middle East and Africa - Year-over-year growth 2025-2030 (%)
Chart on Regional Comparison - Middle East and Africa
Data Table on Regional Comparison - Middle East and Africa

12.7.1 Saudi Arabia - Market size and forecast 2025-2030

Chart on Saudi Arabia - Market size and forecast 2025-2030 ($ million)
Data Table on Saudi Arabia - Market size and forecast 2025-2030 ($ million)
Chart on Saudi Arabia - Year-over-year growth 2025-2030 (%)
Data Table on Saudi Arabia - Year-over-year growth 2025-2030 (%)

12.7.2 UAE - Market size and forecast 2025-2030

Chart on UAE - Market size and forecast 2025-2030 ($ million)
Data Table on UAE - Market size and forecast 2025-2030 ($ million)
Chart on UAE - Year-over-year growth 2025-2030 (%)
Data Table on UAE - Year-over-year growth 2025-2030 (%)

12.7.3 South Africa - Market size and forecast 2025-2030

Chart on South Africa - Market size and forecast 2025-2030 ($ million)
Data Table on South Africa - Market size and forecast 2025-2030 ($ million)
Chart on South Africa - Year-over-year growth 2025-2030 (%)
Data Table on South Africa - Year-over-year growth 2025-2030 (%)

12.7.4 Turkey - Market size and forecast 2025-2030

Chart on Turkey - Market size and forecast 2025-2030 ($ million)
Data Table on Turkey - Market size and forecast 2025-2030 ($ million)
Chart on Turkey - Year-over-year growth 2025-2030 (%)
Data Table on Turkey - Year-over-year growth 2025-2030 (%)

12.7.5 Egypt - Market size and forecast 2025-2030

Chart on Egypt - Market size and forecast 2025-2030 ($ million)
Data Table on Egypt - Market size and forecast 2025-2030 ($ million)
Chart on Egypt - Year-over-year growth 2025-2030 (%)
Data Table on Egypt - Year-over-year growth 2025-2030 (%)

12.8 Market opportunity by geography

Market opportunity by geography ($ million)
Data Tables on Market opportunity by geography ($ million)

13. Drivers, Challenges, and Opportunity

13.1 Market drivers

Proliferation of industry 4.0 and industrial IoT
Intensified focus on predictive maintenance and operational efficiency
Advancements in sensor technology and declining implementation costs

13.2 Market challenges

Cybersecurity vulnerabilities in connected industrial ecosystem
Complexity of network architecture and management
Standardization and interoperability issues

13.3 Impact of drivers and challenges

Impact of drivers and challenges in 2025 and 2030

13.4 Market opportunities

Integration of edge computing and AI
Proliferation of low-power, wide-area network technologies
Convergence of information technology and operational technology

14. Competitive Landscape

14.1 Overview

14.2

Overview on criticality of inputs and factors of differentiation

14.3 Landscape disruption

Overview on factors of disruption

14.4 Industry risks

Impact of key risks on business

15. Competitive Analysis

15.1 Companies profiled

Companies covered

15.2 Company ranking index

15.3 Market positioning of companies

Matrix on companies position and classification

15.4 ABB Ltd.

ABB Ltd. - Overview
ABB Ltd. - Business segments
ABB Ltd. - Key news
ABB Ltd. - Key offerings
ABB Ltd. - Segment focus
SWOT

15.5 Analog Devices Inc.

Analog Devices Inc. - Overview
Analog Devices Inc. - Business segments
Analog Devices Inc. - Key offerings
Analog Devices Inc. - Segment focus
SWOT

15.6 Cisco Systems Inc.

Cisco Systems Inc. - Overview
Cisco Systems Inc. - Business segments
Cisco Systems Inc. - Key news
Cisco Systems Inc. - Key offerings
Cisco Systems Inc. - Segment focus
SWOT

15.7 Emerson Electric Co.

Emerson Electric Co. - Overview
Emerson Electric Co. - Business segments
Emerson Electric Co. - Key news
Emerson Electric Co. - Key offerings
Emerson Electric Co. - Segment focus
SWOT

15.8 Honeywell International Inc.

Honeywell International Inc. - Overview
Honeywell International Inc. - Business segments
Honeywell International Inc. - Key news
Honeywell International Inc. - Key offerings
Honeywell International Inc. - Segment focus
SWOT

15.9 NXP Semiconductors NV

NXP Semiconductors NV - Overview
NXP Semiconductors NV - Business segments
NXP Semiconductors NV - Key news
NXP Semiconductors NV - Key offerings
NXP Semiconductors NV - Segment focus
SWOT

15.10 Phoenix Contact GmbH and Co.

Phoenix Contact GmbH and Co. - Overview
Phoenix Contact GmbH and Co. - Product / Service
Phoenix Contact GmbH and Co. - Key offerings
SWOT

15.11 Rockwell Automation Inc.

Rockwell Automation Inc. - Overview
Rockwell Automation Inc. - Business segments
Rockwell Automation Inc. - Key news
Rockwell Automation Inc. - Key offerings
Rockwell Automation Inc. - Segment focus
SWOT

15.12 Schneider Electric SE

Schneider Electric SE - Overview
Schneider Electric SE - Business segments
Schneider Electric SE - Key news
Schneider Electric SE - Key offerings
Schneider Electric SE - Segment focus
SWOT

15.13 Sensata Technologies Inc.

Sensata Technologies Inc. - Overview
Sensata Technologies Inc. - Business segments
Sensata Technologies Inc. - Key offerings
Sensata Technologies Inc. - Segment focus
SWOT

15.14 Siemens AG

Siemens AG - Overview
Siemens AG - Business segments
Siemens AG - Key news
Siemens AG - Key offerings
Siemens AG - Segment focus
SWOT

15.15 STMicroelectronics NV

STMicroelectronics NV - Overview
STMicroelectronics NV - Business segments
STMicroelectronics NV - Key news
STMicroelectronics NV - Key offerings
STMicroelectronics NV - Segment focus
SWOT

15.16 TE Connectivity plc

TE Connectivity plc - Overview
TE Connectivity plc - Business segments
TE Connectivity plc - Key offerings
TE Connectivity plc - Segment focus
SWOT

15.17 Texas Instruments Inc.

Texas Instruments Inc. - Overview
Texas Instruments Inc. - Business segments
Texas Instruments Inc. - Key news
Texas Instruments Inc. - Key offerings
Texas Instruments Inc. - Segment focus
SWOT

15.18 Yokogawa Electric Corp.

Yokogawa Electric Corp. - Overview
Yokogawa Electric Corp. - Business segments
Yokogawa Electric Corp. - Key offerings
Yokogawa Electric Corp. - Segment focus
SWOT

16. Appendix

16.1 Scope of the report

Market definition
Objectives
Notes and caveats

16.2 Inclusions and exclusions checklist

Inclusions checklist
Exclusions checklist

16.3 Currency conversion rates for US$

16.4 Research methodology

16.5 Data procurement

Information sources

16.6 Data validation

16.7 Validation techniques employed for market sizing

16.8 Data synthesis

16.9 360 degree market analysis

16.10 List of abbreviations

Research Methodology

Technavio presents a detailed picture of the market by way of study, synthesis, and summation of data from multiple sources. The analysts have presented the various facets of the market with a particular focus on identifying the key industry influencers. The data thus presented is comprehensive, reliable, and the result of extensive research, both primary and secondary.

INFORMATION SOURCES

Primary sources

  • Manufacturers and suppliers
  • Channel partners
  • Industry experts
  • Strategic decision makers

Secondary sources

  • Industry journals and periodicals
  • Government data
  • Financial reports of key industry players
  • Historical data
  • Press releases

DATA ANALYSIS

Data Synthesis

  • Collation of data
  • Estimation of key figures
  • Analysis of derived insights

Data Validation

  • Triangulation with data models
  • Reference against proprietary databases
  • Corroboration with industry experts

REPORT WRITING

Qualitative

  • Market drivers
  • Market challenges
  • Market trends
  • Five forces analysis

Quantitative

  • Market size and forecast
  • Market segmentation
  • Geographical insights
  • Competitive landscape

Interested in this report?

Get your sample now to see our research methodology and insights!

Download Now

Frequently Asked Questions

Industrial Wireless Sensor Networks (Iwsn) market growth will increase by USD 8198.3 million during 2026-2030.

The Industrial Wireless Sensor Networks (Iwsn) market is expected to grow at a CAGR of 17.9% during 2026-2030.

Industrial Wireless Sensor Networks (Iwsn) market is segmented by Technology (ZigBee, WirelessHART, ISA100 wireless, Wi-fi, Bluetooth) End-user (Automotive, Food and beverage, Metals and mining, Oil and gas, Waste management) Component (Software, Hardware, Services)

ABB Ltd., Advantech Co. Ltd., Analog Devices Inc., Banner Engineering Corp., Cisco Systems Inc., Digi International Inc., Emerson Electric Co., Honeywell International Inc., Moxa Inc., NXP Semiconductors NV, OleumTech Corp., Phoenix Contact GmbH and Co., Rockwell Automation Inc., Schneider Electric SE, Sensata Technologies Inc., Siemens AG, STMicroelectronics NV, TE Connectivity plc, Texas Instruments Inc., Yokogawa Electric Corp. are a few of the key vendors in the Industrial Wireless Sensor Networks (Iwsn) market.

APAC will register the highest growth rate of 31.1% among the other regions. Therefore, the Industrial Wireless Sensor Networks (Iwsn) market in APAC is expected to garner significant business opportunities for the vendors during the forecast period.

US, Canada, Mexico, China, Japan, India, South Korea, Australia, Indonesia, Germany, UK, France, Italy, Spain, Russia, Brazil, Argentina, Chile, Saudi Arabia, UAE, South Africa, Turkey, Egypt

  • Proliferation of industry 4.0 and industrial IoT is the driving factor this market.

The Industrial Wireless Sensor Networks (Iwsn) market vendors should focus on grabbing business opportunities from the Technology segment as it accounted for the largest market share in the base year.
RIA - Research AI Assistant
Ask RIA
