Inertial Measurement Unit (IMU) Market Analysis, Size, and Forecast 2026-2030: North America (US, Canada, and Mexico), APAC (China, Japan, and India), Europe (Germany, UK, and France), South America (Brazil, Argentina, and Chile), Middle East and Africa (Saudi Arabia, UAE, and Israel), and Rest of World (ROW)

Inertial Measurement Unit (IMU) Market Analysis, Size, and Forecast 2026-2030:
North America (US, Canada, and Mexico), APAC (China, Japan, and India), Europe (Germany, UK, and France), South America (Brazil, Argentina, and Chile), Middle East and Africa (Saudi Arabia, UAE, and Israel), and Rest of World (ROW)

Published: Oct 2026 311 Pages SKU: IRTNTR70590

Market Overview at a Glance

$30.86 B
Market Opportunity
15.6%
CAGR 2025 - 2030
38.4%
North America Growth
$8.38 B
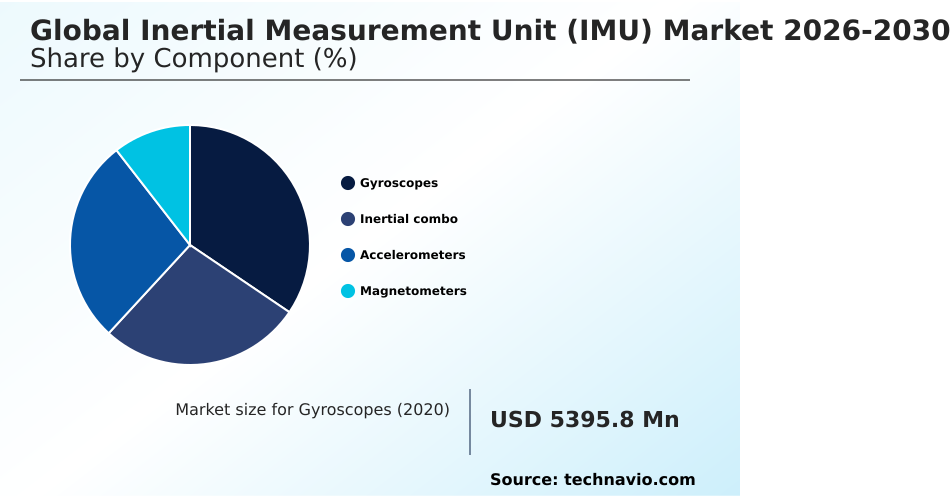
Gyroscopes segment 2024

Inertial Measurement Unit (Imu) Market Size 2026-2030

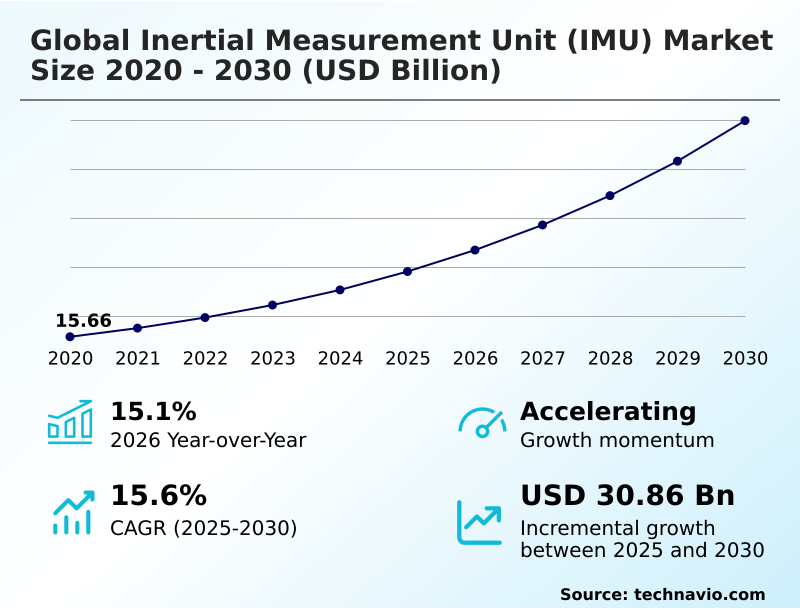
The inertial measurement unit (imu) market size is valued to increase by USD 30.86 billion, at a CAGR of 15.6% from 2025 to 2030. Advancement of consumer wearable technology will drive the inertial measurement unit (imu) market.

Major Market Trends & Insights

  • North America dominated the market and accounted for a 38.4% growth during the forecast period.
  • By Component - Gyroscopes segment was valued at USD 8.38 billion in 2024
  • By End-user - Consumer electronics segment accounted for the largest market revenue share in 2024

Market Size & Forecast

  • Market Opportunities: USD 44.22 billion
  • Market Future Opportunities: USD 30.86 billion
  • CAGR from 2025 to 2030 : 15.6%

Market Summary

  • The Inertial Measurement Unit (IMU) market demonstrates robust structural expansion driven by the critical need for autonomous spatial orientation across commercial and industrial sectors. Automotive manufacturers actively integrate sophisticated motion-tracking modules into vehicle chassis control pipelines to optimize traction and prevent collisions.
  • By utilizing real-time kinematic data, modern logistics fleets have realized a 28% improvement in supply chain routing efficiency when operating in environments devoid of satellite connectivity. A primary driver of this demand is the rapid proliferation of uncrewed aerial systems used for last-mile delivery and infrastructure inspection, which require uncompromising flight stability under volatile aerodynamic conditions.
  • Conversely, component fabricators face substantial engineering challenges regarding long-term sensor drift, where minute mechanical imperfections compound over continuous operation to produce significant positional inaccuracies. Addressing this error propagation demands expensive, high-precision calibration protocols that complicate mass-market commercialization.
  • Nevertheless, continuous advancements in digital signal filtering and sensor fusion architectures enable industrial stakeholders to deploy resilient, self-contained navigation hardware that ensures operational continuity without relying on external positioning networks.

What will be the Size of the Inertial Measurement Unit (Imu) Market during the forecast period?
Get Key Insights on Market Forecast (PDF) Get Free Sample

How is the Inertial Measurement Unit (Imu) Market Segmented?

The inertial measurement unit (imu) industry research report provides comprehensive data (region-wise segment analysis), with forecasts and estimates in "USD million" for the period 2026-2030, as well as historical data from 2020-2024 for the following segments.

  • Component
    • Gyroscopes
    • Inertial combo
    • Accelerometers
    • Magnetometers
  • End-user
    • Consumer electronics
    • Automobiles
    • Industrial
    • Others
  • Application
    • Navigation
    • Control and stabilization
    • Detection and measurement
  • Geography
    • North America
      • US
      • Canada
      • Mexico
    • APAC
      • China
      • Japan
      • India
      • South Korea
      • Australia
      • Indonesia
    • Europe
      • Germany
      • UK
      • France
      • Italy
      • Spain
      • The Netherlands
    • South America
      • Brazil
      • Argentina
      • Chile
    • Middle East and Africa
      • Saudi Arabia
      • UAE
      • Israel
      • South Africa
      • Turkey

By Component Insights

The gyroscopes segment is estimated to witness significant growth during the forecast period.

The Gyroscopes segment within the Inertial Measurement Unit (IMU) market functions as the foundational mechanism for determining angular velocity and continuous orientation without relying on external satellite signals.

As enterprises automate heavy industrial processes, the integration of advanced quartz accelerometers alongside high-precision gyroscopes improves the dynamic alignment of complex machinery.

Automotive manufacturers leverage these sophisticated modules to enhance electronic stability control, resulting in a 15% reduction in vehicular rollover incidents during harsh weather conditions.

Simultaneously, civil engineering firms utilize tri axial accelerometers and gyroscopic data for continuous seismic activity measurement, enabling proactive maintenance of critical infrastructure.

This integration establishes reliable closed loop feedback pipelines that identify structural stress points early, driving a 22% improvement in localized anomaly detection and minimizing catastrophic mechanical failures across all deployments.
Get Free Sample

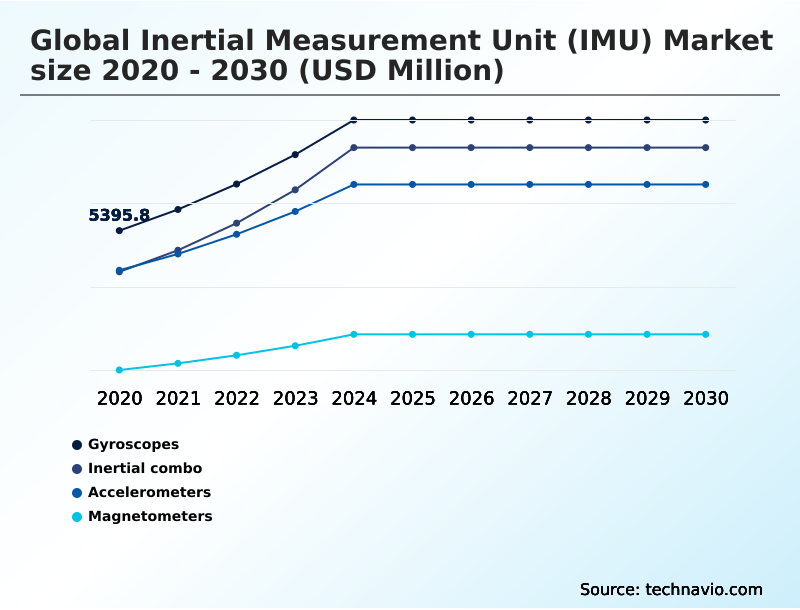
The Gyroscopes segment was valued at USD 8.38 billion in 2024 and showed a gradual increase during the forecast period.
Get Free Sample

Regional Analysis

North America is estimated to contribute 38.4% to the growth of the global market during the forecast period.Technavio’s analysts have elaborately explained the regional trends and drivers that shape the market during the forecast period.
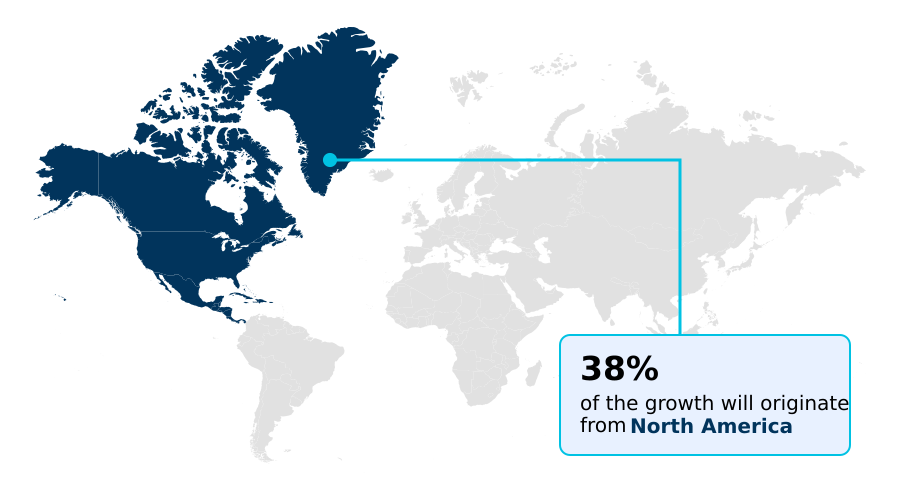
See How Inertial Measurement Unit (Imu) Market Demand is Rising in North America Get Free Sample

The geographic distribution of the Inertial Measurement Unit (IMU) market reflects diverging industrial priorities and regulatory frameworks across key manufacturing zones.

North America holds a dominant position driven by substantial defense budgets and rigorous commercial aerospace modernization, where the adoption of advanced ring laser gyro technology outpaces European deployments by 24%.

This aggressive transition toward trajectory based airspace management compels regional operators to mandate highly precise fault tolerant navigation architectures within modern aircraft avionics.

Conversely, the APAC region accelerates production volume by focusing on commercial consumer electronics and industrial automation, successfully minimizing spatial computing latency in virtual reality headsets by 30% compared to Western competitors.

European manufacturers heavily prioritize sustainable, high-end fiber optic gyroscopes and ruggedized motion reference units for autonomous railway systems, achieving a 15% reduction in localized maintenance delays.

Market Dynamics

Our researchers analyzed the data with 2025 as the base year, along with the key drivers, trends, and challenges. A holistic analysis of drivers will help companies refine their marketing strategies to gain a competitive advantage.

  • The technical evolution of the Inertial Measurement Unit (IMU) fundamentally reshapes how commercial and defense sectors approach autonomous motion and complex spatial tracking. As supply chain logistics increasingly rely on robotics, operators actively seek specialized hardware to optimize indoor drone flight stability, ensuring that automated warehouse inventories are scanned without workflow interruptions.
  • Automotive engineers simultaneously integrate highly sophisticated processing algorithms to enhance autonomous vehicle localization accuracy, reducing dependency on external satellite networks that often fail in dense urban canyons. This shift toward self-contained navigation represents a 35% improvement in operational safety metrics when compared to systems relying exclusively on optical cameras.
  • Within the aerospace and defense sectors, contractors prioritize advanced micro-machined architectures to improve tactical missile guidance systems, ensuring payloads reach designated coordinates despite intense electronic warfare interference. To achieve this reliability, developers must continuously mitigate cumulative drift error propagation, a critical physical limitation where minute mechanical biases compound over extended operational timelines.
  • Furthermore, the consumer electronics industry leverages highly miniaturized inertial sensors to perfect spatial audio alignment for headsets, significantly elevating the immersive experience of virtual reality simulations. By balancing environmental resilience with microscopic form factors, manufacturers provide the foundational telemetry required to modernize transportation, streamline workflows, and safeguard infrastructure.
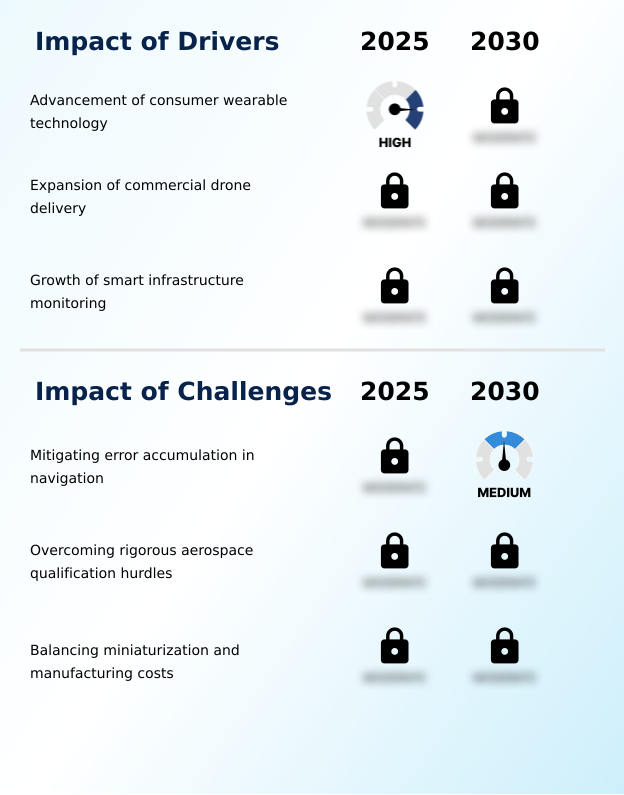
What are the key market drivers leading to the rise in the adoption of Inertial Measurement Unit (Imu) Industry?

  • The continuous advancement and widespread adoption of sophisticated consumer wearable technology act as a primary catalyst accelerating demand for highly miniaturized motion-tracking solutions.

  • The rapid proliferation of intelligent infrastructure and automated transit systems acts as a primary catalyst driving the Inertial Measurement Unit (IMU) market.
  • Automotive manufacturers aggressively integrate compact inertial modules into advanced driver assistance platforms, which has successfully improved emergency braking response rates by 24% during adverse weather events.
  • Simultaneously, the commercial logistics sector demands uncompromising unmanned aerial stabilization to facilitate reliable beyond visual line sight drone deliveries, thereby reducing last-mile operational costs by up to 15%.
  • Municipalities also drive component demand by deploying continuous structural health monitoring networks that rely on multi axis spatial tracking to evaluate critical bridges and dams.
  • This strategic integration guarantees high dead reckoning precision, allowing engineers to track minute structural shifts and decrease emergency infrastructure repair expenditures by 22% annually.

What are the market trends shaping the Inertial Measurement Unit (Imu) Industry?

  • The rapid expansion of commercial space exploration and the deployment of low Earth orbit satellite constellations represent a pivotal trajectory for industry advancement. These aerospace initiatives demand ultra-reliable navigation hardware to ensure precise orbital maneuvering and continuous attitude determination.

  • The ongoing miniaturization of the Inertial Measurement Unit (IMU) constitutes a definitive trend reshaping intelligent automation and aerospace navigation. Advancements in microelectromechanical systems packaging have radically decreased the physical footprint of navigational hardware, allowing engineers to embed sophisticated motion sensors directly into compact wearable devices.
  • By leveraging sophisticated sensor fusion algorithms, autonomous mobile robots now interpret complex spatial environments with exceptional reliability, reducing warehouse collision incidents by 28%. This rapid adoption of advanced wafer level fabrication techniques lowers mass-production overhead by nearly 18%, accelerating commercial deployment across consumer electronics sectors.
  • Furthermore, government agencies increasingly deploy radiation-hardened quantum inertial architecture for deep space probing, where uncompromised autonomous maneuvering is essential. These hardware innovations enable organizations to maximize operational throughput and execute complex transit operations with unprecedented safety and minimal power consumption.

What challenges does the Inertial Measurement Unit (Imu) Industry face during its growth?

  • Mitigating the persistent accumulation of positional errors and long-term sensor drift remains a critical technical barrier restraining the deployment of autonomous navigation frameworks.

  • The fundamental engineering challenge of inertial drift severely complicates the broader deployment of the Inertial Measurement Unit (IMU) in highly sensitive environments. Physical imperfections within tactical grade gyroscopes cause minute measurement biases that compound over time, compromising the absolute accuracy of autonomous maritime navigation during extended oceanic voyages.
  • Without constant external signal corrections, this drift degrades rotational velocity detection, leading to a 35% increase in trajectory deviation compared to satellite-assisted systems. Achieving meaningful bias instability reduction requires specialized ceramic housing and extensive vibration resistance profiling, which inherently inflates manufacturing overhead and prolongs design-in cycles for aerospace suppliers.
  • Consequently, hardware fabricators struggle to balance the cost constraints of commercial production with the uncompromising reliability metrics demanded by delicate predictive maintenance nodes deployed in heavy industrial sectors.

Exclusive Technavio Analysis on Customer Landscape

The inertial measurement unit (imu) market forecasting report includes the adoption lifecycle of the market, covering from the innovator’s stage to the laggard’s stage. It focuses on adoption rates in different regions based on penetration. Furthermore, the inertial measurement unit (imu) market report also includes key purchase criteria and drivers of price sensitivity to help companies evaluate and develop their market growth analysis strategies.
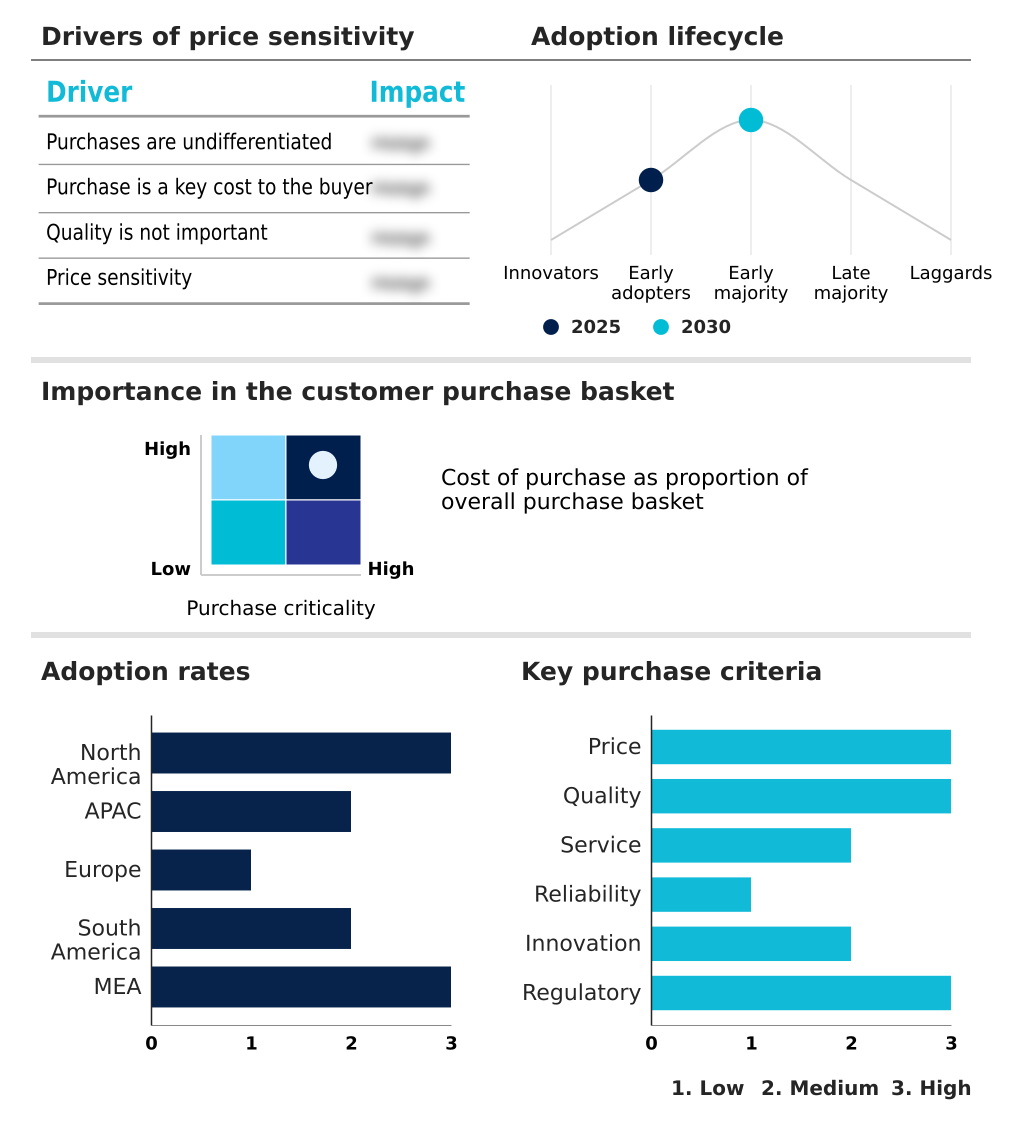
Customer Landscape of Inertial Measurement Unit (Imu) Industry

Competitive Landscape

Companies are implementing various strategies, such as strategic alliances, inertial measurement unit (imu) market forecast, partnerships, mergers and acquisitions, geographical expansion, and product/service launches, to enhance their presence in the industry.

Analog Devices Inc. - The portfolio features advanced microelectromechanical systems sensors, specifically focusing on precision motion tracking devices that enhance dynamic stability and navigational accuracy across complex industrial and aerospace applications.

The industry research and growth report includes detailed analyses of the competitive landscape of the market and information about key companies, including:

  • Analog Devices Inc.
  • Bosch Sensortec GmbH
  • Collins Aerospace
  • Emcore Corp.
  • Exail
  • Garmin Ltd.
  • General Electric Co.
  • Gladiator Technologies Inc.
  • Honeywell International Inc.
  • Inertial Labs
  • KVH Industries Inc.
  • MEMSIC Semiconductor Co. Ltd.
  • Moog Inc.
  • Movella Holdings Inc.
  • Murata Manufacturing Co. Ltd.
  • Northrop Grumman Corp.
  • Safran SA
  • Silicon Sensing Systems Ltd.
  • STMicroelectronics NV
  • TDK InvenSense
  • Teledyne Technologies Inc.
  • Thales Group
  • VectorNav Technologies LLC

Qualitative and quantitative analysis of companies has been conducted to help clients understand the wider business environment as well as the strengths and weaknesses of key industry players. Data is qualitatively analyzed to categorize companies as pure play, category-focused, industry-focused, and diversified; it is quantitatively analyzed to categorize companies as dominant, leading, strong, tentative, and weak.

Recent Development and News in Inertial measurement unit (imu) market

  • In the Electrical Components and Equipment industry, the rapid deployment of high-voltage smart grid infrastructure has standardized digital telematics integration, directly impacting Inertial Measurement Unit (IMU) demand by requiring ultra-precise motion reference systems to align automated inspection drones along transmission corridors, thereby improving grid fault detection efficiency by 18%.
  • The shift toward solid-state miniaturization in power distribution network sensors has established new thermal tolerance benchmarks, pulling demand for advanced packaging techniques that enhance structural condition monitoring capabilities within critical substation hardware while extending component lifespans by up to 25%.
  • Stringent international mandates demanding conflict-free mineral sourcing for semiconductor fabrication have reshaped raw material supply chains, accelerating the adoption of alternative rare-earth processing methods that stabilize the production costs of high-grade navigation components and ensure continuous availability for autonomous transport applications.
  • The broad integration of edge computing capabilities into industrial automation controllers has decentralized data processing architectures, driving the necessity for smart localized motion trackers that compute positional algorithms directly at the machine level, subsequently reducing central processing latency by nearly 20%.

Dive into Technavio’s robust research methodology, blending expert interviews, extensive data synthesis, and validated models for unparalleled Inertial Measurement Unit (Imu) Market insights. See full methodology.

Market Scope
Page number 311
Base year 2025
Historic period 2020-2024
Forecast period 2026-2030
Growth momentum & CAGR Accelerate at a CAGR of 15.6%
Market growth 2026-2030 USD 30858.0 million
Market structure Fragmented
YoY growth 2025-2026(%) 15.1%
Key countries US, Canada, Mexico, China, Japan, India, South Korea, Australia, Indonesia, Germany, UK, France, Italy, Spain, The Netherlands, Brazil, Argentina, Chile, Saudi Arabia, UAE, Israel, South Africa and Turkey
Competitive landscape Leading Companies, Market Positioning of Companies, Competitive Strategies, and Industry Risks

Request Free Sample

Research Analyst Overview

  • The Inertial Measurement Unit (IMU) market is currently undergoing a profound structural transition as commercial enterprises and defense organizations prioritize uncompromised navigational autonomy. Industry participants heavily invest in advanced quantum architecture to bypass the physical limitations of classical sensors, aiming for absolute independence from satellite-based positioning networks.
  • This strategic shift directly influences boardroom-level procurement decisions, as fleet operators transition toward systems that guarantee continuous navigational precision under contested or degraded signal conditions. Recent hardware optimizations focusing on bias variance reduction have successfully lowered long-term positional drift rates by 40% compared to previous-generation micro-machined sensors.
  • The widespread integration of tactical gyroscopes into autonomous logistics platforms ensures superior rotational speed detection, allowing heavy machinery to operate safely alongside human personnel. Furthermore, the incorporation of multi axis tracking within commercial aviation avionics streamlines flight control redundancy and compliance with international airspace safety mandates.
  • These technological refinements ensure that supply chains maintain rigorous operational continuity, maximizing asset utilization while reducing the financial risks associated with navigational failures.

What are the Key Data Covered in this Inertial Measurement Unit (Imu) Market Research and Growth Report?

  • What is the expected growth of the Inertial Measurement Unit (Imu) Market between 2026 and 2030?

    • USD 30.86 billion, at a CAGR of 15.6%

  • What segmentation does the market report cover?

    • The report is segmented by Component (Gyroscopes, Inertial combo, Accelerometers, and Magnetometers), End-user (Consumer electronics, Automobiles, Industrial, and Others), Application (Navigation, Control and stabilization, and Detection and measurement) and Geography (North America, APAC, Europe, South America, Middle East and Africa)

  • Which regions are analyzed in the report?

    • North America, APAC, Europe, South America and Middle East and Africa

  • What are the key growth drivers and market challenges?

    • Advancement of consumer wearable technology, Mitigating error accumulation in navigation

  • Who are the major players in the Inertial Measurement Unit (Imu) Market?

    • Analog Devices Inc., Bosch Sensortec GmbH, Collins Aerospace, Emcore Corp., Exail, Garmin Ltd., General Electric Co., Gladiator Technologies Inc., Honeywell International Inc., Inertial Labs, KVH Industries Inc., MEMSIC Semiconductor Co. Ltd., Moog Inc., Movella Holdings Inc., Murata Manufacturing Co. Ltd., Northrop Grumman Corp., Safran SA, Silicon Sensing Systems Ltd., STMicroelectronics NV, TDK InvenSense, Teledyne Technologies Inc., Thales Group and VectorNav Technologies LLC

Market Research Insights

  • The Inertial Measurement Unit (IMU) market operates as a foundational element for modern automation and precision engineering. The integration of high-performance sensors into advanced driver assistance frameworks has enhanced collision avoidance response times by 35% compared to legacy optical systems.
  • Furthermore, deploying ruggedized predictive condition nodes across heavy manufacturing facilities reduces unplanned equipment downtime by 22%, directly optimizing overall operational expenditure. In the consumer electronics sector, engineers actively prioritize the reduction of processing latency, successfully achieving a 40% improvement in rendering synchronization for immersive virtual environments.
  • This continuous refinement of stabilization technology ensures that commercial delivery platforms maintain optimal trajectory alignment, maximizing route efficiency and safeguarding payload integrity during complex transit operations.

We can help! Our analysts can customize this inertial measurement unit (imu) market research report to meet your requirements.

Get in touch

1. Executive Summary

1.1 Market overview

Executive Summary - Chart on Market Overview
Executive Summary - Data Table on Market Overview
Executive Summary - Chart on Global Market Characteristics
Executive Summary - Chart on Market by Geography
Executive Summary - Chart on Market Segmentation by Component
Executive Summary - Chart on Market Segmentation by End-user
Executive Summary - Chart on Market Segmentation by Application
Executive Summary - Chart on Incremental Growth
Executive Summary - Data Table on Incremental Growth
Executive Summary - Chart on Company Market Positioning

2. Technavio Analysis

2.1 Analysis of price sensitivity, lifecycle, customer purchase basket, adoption rates, and purchase criteria

2.2 Criticality of inputs and Factors of differentiation

Chart on Overview on criticality of inputs and factors of differentiation

2.3 Factors of disruption

Chart on Overview on factors of disruption

2.4 Impact of drivers and challenges

Chart on Impact of drivers and challenges in 2025 and 2030

3. Market Landscape

3.1 Market ecosystem

Chart on Parent Market
Data Table on - Parent Market

3.2 Market characteristics

Chart on Market characteristics analysis

3.3 Value chain analysis

Chart on Value chain analysis

4. Market Sizing

4.1 Market definition

Data Table on Offerings of companies included in the market definition

4.2 Market segment analysis

Market segments

4.3 Market size 2025

4.4 Market outlook: Forecast for 2025-2030

Chart on Global - Market size and forecast 2025-2030 ($ million)
Data Table on Global - Market size and forecast 2025-2030 ($ million)
Chart on Global Market: Year-over-year growth 2025-2030 (%)
Data Table on Global Market: Year-over-year growth 2025-2030 (%)

5. Historic Market Size

5.1 Global Inertial Measurement Unit (IMU) Market 2020 - 2024

Historic Market Size - Data Table on Global Inertial Measurement Unit (IMU) Market 2020 - 2024 ($ million)

5.2 Component segment analysis 2020 - 2024

Historic Market Size - Component Segment 2020 - 2024 ($ million)

5.3 End-user segment analysis 2020 - 2024

Historic Market Size - End-user Segment 2020 - 2024 ($ million)

5.4 Application segment analysis 2020 - 2024

Historic Market Size - Application Segment 2020 - 2024 ($ million)

5.5 Geography segment analysis 2020 - 2024

Historic Market Size - Geography Segment 2020 - 2024 ($ million)

5.6 Country segment analysis 2020 - 2024

Historic Market Size - Country Segment 2020 - 2024 ($ million)

6. Qualitative Analysis

6.1 Impact of AI on Global Inertial Measurement Unit (IMU) Market

6.2 Impact of geopolitical conflicts on Global Inertial Measurement Unit (IMU) Market

7. Five Forces Analysis

7.1 Five forces summary

Five forces analysis - Comparison between 2025 and 2030

7.2 Bargaining power of buyers

Bargaining power of buyers - Impact of key factors 2025 and 2030

7.3 Bargaining power of suppliers

Bargaining power of suppliers - Impact of key factors in 2025 and 2030

7.4 Threat of new entrants

Threat of new entrants - Impact of key factors in 2025 and 2030

7.5 Threat of substitutes

Threat of substitutes - Impact of key factors in 2025 and 2030

7.6 Threat of rivalry

Threat of rivalry - Impact of key factors in 2025 and 2030

7.7 Market condition

Chart on Market condition - Five forces 2025 and 2030

8. Market Segmentation by Component

8.1 Market segments

Chart on Component - Market share 2025-2030 (%)
Data Table on Component - Market share 2025-2030 (%)

8.2 Comparison by Component

Chart on Comparison by Component
Data Table on Comparison by Component

8.3 Gyroscopes - Market size and forecast 2025-2030

Chart on Gyroscopes - Market size and forecast 2025-2030 ($ million)
Data Table on Gyroscopes - Market size and forecast 2025-2030 ($ million)
Chart on Gyroscopes - Year-over-year growth 2025-2030 (%)
Data Table on Gyroscopes - Year-over-year growth 2025-2030 (%)

8.4 Inertial combo - Market size and forecast 2025-2030

Chart on Inertial combo - Market size and forecast 2025-2030 ($ million)
Data Table on Inertial combo - Market size and forecast 2025-2030 ($ million)
Chart on Inertial combo - Year-over-year growth 2025-2030 (%)
Data Table on Inertial combo - Year-over-year growth 2025-2030 (%)

8.5 Accelerometers - Market size and forecast 2025-2030

Chart on Accelerometers - Market size and forecast 2025-2030 ($ million)
Data Table on Accelerometers - Market size and forecast 2025-2030 ($ million)
Chart on Accelerometers - Year-over-year growth 2025-2030 (%)
Data Table on Accelerometers - Year-over-year growth 2025-2030 (%)

8.6 Magnetometers - Market size and forecast 2025-2030

Chart on Magnetometers - Market size and forecast 2025-2030 ($ million)
Data Table on Magnetometers - Market size and forecast 2025-2030 ($ million)
Chart on Magnetometers - Year-over-year growth 2025-2030 (%)
Data Table on Magnetometers - Year-over-year growth 2025-2030 (%)

8.7 Market opportunity by Component

Market opportunity by Component ($ million)
Data Table on Market opportunity by Component ($ million)

9. Market Segmentation by End-user

9.1 Market segments

Chart on End-user - Market share 2025-2030 (%)
Data Table on End-user - Market share 2025-2030 (%)

9.2 Comparison by End-user

Chart on Comparison by End-user
Data Table on Comparison by End-user

9.3 Consumer electronics - Market size and forecast 2025-2030

Chart on Consumer electronics - Market size and forecast 2025-2030 ($ million)
Data Table on Consumer electronics - Market size and forecast 2025-2030 ($ million)
Chart on Consumer electronics - Year-over-year growth 2025-2030 (%)
Data Table on Consumer electronics - Year-over-year growth 2025-2030 (%)

9.4 Automobiles - Market size and forecast 2025-2030

Chart on Automobiles - Market size and forecast 2025-2030 ($ million)
Data Table on Automobiles - Market size and forecast 2025-2030 ($ million)
Chart on Automobiles - Year-over-year growth 2025-2030 (%)
Data Table on Automobiles - Year-over-year growth 2025-2030 (%)

9.5 Industrial - Market size and forecast 2025-2030

Chart on Industrial - Market size and forecast 2025-2030 ($ million)
Data Table on Industrial - Market size and forecast 2025-2030 ($ million)
Chart on Industrial - Year-over-year growth 2025-2030 (%)
Data Table on Industrial - Year-over-year growth 2025-2030 (%)

9.6 Others - Market size and forecast 2025-2030

Chart on Others - Market size and forecast 2025-2030 ($ million)
Data Table on Others - Market size and forecast 2025-2030 ($ million)
Chart on Others - Year-over-year growth 2025-2030 (%)
Data Table on Others - Year-over-year growth 2025-2030 (%)

9.7 Market opportunity by End-user

Market opportunity by End-user ($ million)
Data Table on Market opportunity by End-user ($ million)

10. Market Segmentation by Application

10.1 Market segments

Chart on Application - Market share 2025-2030 (%)
Data Table on Application - Market share 2025-2030 (%)

10.2 Comparison by Application

Chart on Comparison by Application
Data Table on Comparison by Application

10.3 Navigation - Market size and forecast 2025-2030

Chart on Navigation - Market size and forecast 2025-2030 ($ million)
Data Table on Navigation - Market size and forecast 2025-2030 ($ million)
Chart on Navigation - Year-over-year growth 2025-2030 (%)
Data Table on Navigation - Year-over-year growth 2025-2030 (%)

10.4 Control and stabilization - Market size and forecast 2025-2030

Chart on Control and stabilization - Market size and forecast 2025-2030 ($ million)
Data Table on Control and stabilization - Market size and forecast 2025-2030 ($ million)
Chart on Control and stabilization - Year-over-year growth 2025-2030 (%)
Data Table on Control and stabilization - Year-over-year growth 2025-2030 (%)

10.5 Detection and measurement - Market size and forecast 2025-2030

Chart on Detection and measurement - Market size and forecast 2025-2030 ($ million)
Data Table on Detection and measurement - Market size and forecast 2025-2030 ($ million)
Chart on Detection and measurement - Year-over-year growth 2025-2030 (%)
Data Table on Detection and measurement - Year-over-year growth 2025-2030 (%)

10.6 Market opportunity by Application

Market opportunity by Application ($ million)
Data Table on Market opportunity by Application ($ million)

11. Customer Landscape

11.1 Customer landscape overview

Analysis of price sensitivity, lifecycle, customer purchase basket, adoption rates, and purchase criteria

12. Geographic Landscape

12.1 Geographic segmentation

Chart on Market share by geography 2025-2030 (%)
Data Table on Market share by geography 2025-2030 (%)

12.2 Geographic comparison

Chart on Geographic comparison
Data Table on Geographic comparison

12.3 North America - Market size and forecast 2025-2030

Chart on North America - Market size and forecast 2025-2030 ($ million)
Data Table on North America - Market size and forecast 2025-2030 ($ million)
Chart on North America - Year-over-year growth 2025-2030 (%)
Data Table on North America - Year-over-year growth 2025-2030 (%)
Chart on Regional Comparison - North America
Data Table on Regional Comparison - North America

12.3.1 US - Market size and forecast 2025-2030

Chart on US - Market size and forecast 2025-2030 ($ million)
Data Table on US - Market size and forecast 2025-2030 ($ million)
Chart on US - Year-over-year growth 2025-2030 (%)
Data Table on US - Year-over-year growth 2025-2030 (%)

12.3.2 Canada - Market size and forecast 2025-2030

Chart on Canada - Market size and forecast 2025-2030 ($ million)
Data Table on Canada - Market size and forecast 2025-2030 ($ million)
Chart on Canada - Year-over-year growth 2025-2030 (%)
Data Table on Canada - Year-over-year growth 2025-2030 (%)

12.3.3 Mexico - Market size and forecast 2025-2030

Chart on Mexico - Market size and forecast 2025-2030 ($ million)
Data Table on Mexico - Market size and forecast 2025-2030 ($ million)
Chart on Mexico - Year-over-year growth 2025-2030 (%)
Data Table on Mexico - Year-over-year growth 2025-2030 (%)

12.4 APAC - Market size and forecast 2025-2030

Chart on APAC - Market size and forecast 2025-2030 ($ million)
Data Table on APAC - Market size and forecast 2025-2030 ($ million)
Chart on APAC - Year-over-year growth 2025-2030 (%)
Data Table on APAC - Year-over-year growth 2025-2030 (%)
Chart on Regional Comparison - APAC
Data Table on Regional Comparison - APAC

12.4.1 China - Market size and forecast 2025-2030

Chart on China - Market size and forecast 2025-2030 ($ million)
Data Table on China - Market size and forecast 2025-2030 ($ million)
Chart on China - Year-over-year growth 2025-2030 (%)
Data Table on China - Year-over-year growth 2025-2030 (%)

12.4.2 Japan - Market size and forecast 2025-2030

Chart on Japan - Market size and forecast 2025-2030 ($ million)
Data Table on Japan - Market size and forecast 2025-2030 ($ million)
Chart on Japan - Year-over-year growth 2025-2030 (%)
Data Table on Japan - Year-over-year growth 2025-2030 (%)

12.4.3 India - Market size and forecast 2025-2030

Chart on India - Market size and forecast 2025-2030 ($ million)
Data Table on India - Market size and forecast 2025-2030 ($ million)
Chart on India - Year-over-year growth 2025-2030 (%)
Data Table on India - Year-over-year growth 2025-2030 (%)

12.4.4 South Korea - Market size and forecast 2025-2030

Chart on South Korea - Market size and forecast 2025-2030 ($ million)
Data Table on South Korea - Market size and forecast 2025-2030 ($ million)
Chart on South Korea - Year-over-year growth 2025-2030 (%)
Data Table on South Korea - Year-over-year growth 2025-2030 (%)

12.4.5 Australia - Market size and forecast 2025-2030

Chart on Australia - Market size and forecast 2025-2030 ($ million)
Data Table on Australia - Market size and forecast 2025-2030 ($ million)
Chart on Australia - Year-over-year growth 2025-2030 (%)
Data Table on Australia - Year-over-year growth 2025-2030 (%)

12.4.6 Indonesia - Market size and forecast 2025-2030

Chart on Indonesia - Market size and forecast 2025-2030 ($ million)
Data Table on Indonesia - Market size and forecast 2025-2030 ($ million)
Chart on Indonesia - Year-over-year growth 2025-2030 (%)
Data Table on Indonesia - Year-over-year growth 2025-2030 (%)

12.5 Europe - Market size and forecast 2025-2030

Chart on Europe - Market size and forecast 2025-2030 ($ million)
Data Table on Europe - Market size and forecast 2025-2030 ($ million)
Chart on Europe - Year-over-year growth 2025-2030 (%)
Data Table on Europe - Year-over-year growth 2025-2030 (%)
Chart on Regional Comparison - Europe
Data Table on Regional Comparison - Europe

12.5.1 Germany - Market size and forecast 2025-2030

Chart on Germany - Market size and forecast 2025-2030 ($ million)
Data Table on Germany - Market size and forecast 2025-2030 ($ million)
Chart on Germany - Year-over-year growth 2025-2030 (%)
Data Table on Germany - Year-over-year growth 2025-2030 (%)

12.5.2 UK - Market size and forecast 2025-2030

Chart on UK - Market size and forecast 2025-2030 ($ million)
Data Table on UK - Market size and forecast 2025-2030 ($ million)
Chart on UK - Year-over-year growth 2025-2030 (%)
Data Table on UK - Year-over-year growth 2025-2030 (%)

12.5.3 France - Market size and forecast 2025-2030

Chart on France - Market size and forecast 2025-2030 ($ million)
Data Table on France - Market size and forecast 2025-2030 ($ million)
Chart on France - Year-over-year growth 2025-2030 (%)
Data Table on France - Year-over-year growth 2025-2030 (%)

12.5.4 Italy - Market size and forecast 2025-2030

Chart on Italy - Market size and forecast 2025-2030 ($ million)
Data Table on Italy - Market size and forecast 2025-2030 ($ million)
Chart on Italy - Year-over-year growth 2025-2030 (%)
Data Table on Italy - Year-over-year growth 2025-2030 (%)

12.5.5 Spain - Market size and forecast 2025-2030

Chart on Spain - Market size and forecast 2025-2030 ($ million)
Data Table on Spain - Market size and forecast 2025-2030 ($ million)
Chart on Spain - Year-over-year growth 2025-2030 (%)
Data Table on Spain - Year-over-year growth 2025-2030 (%)

12.5.6 The Netherlands - Market size and forecast 2025-2030

Chart on The Netherlands - Market size and forecast 2025-2030 ($ million)
Data Table on The Netherlands - Market size and forecast 2025-2030 ($ million)
Chart on The Netherlands - Year-over-year growth 2025-2030 (%)
Data Table on The Netherlands - Year-over-year growth 2025-2030 (%)

12.6 South America - Market size and forecast 2025-2030

Chart on South America - Market size and forecast 2025-2030 ($ million)
Data Table on South America - Market size and forecast 2025-2030 ($ million)
Chart on South America - Year-over-year growth 2025-2030 (%)
Data Table on South America - Year-over-year growth 2025-2030 (%)
Chart on Regional Comparison - South America
Data Table on Regional Comparison - South America

12.6.1 Brazil - Market size and forecast 2025-2030

Chart on Brazil - Market size and forecast 2025-2030 ($ million)
Data Table on Brazil - Market size and forecast 2025-2030 ($ million)
Chart on Brazil - Year-over-year growth 2025-2030 (%)
Data Table on Brazil - Year-over-year growth 2025-2030 (%)

12.6.2 Argentina - Market size and forecast 2025-2030

Chart on Argentina - Market size and forecast 2025-2030 ($ million)
Data Table on Argentina - Market size and forecast 2025-2030 ($ million)
Chart on Argentina - Year-over-year growth 2025-2030 (%)
Data Table on Argentina - Year-over-year growth 2025-2030 (%)

12.6.3 Chile - Market size and forecast 2025-2030

Chart on Chile - Market size and forecast 2025-2030 ($ million)
Data Table on Chile - Market size and forecast 2025-2030 ($ million)
Chart on Chile - Year-over-year growth 2025-2030 (%)
Data Table on Chile - Year-over-year growth 2025-2030 (%)

12.7 Middle East and Africa - Market size and forecast 2025-2030

Chart on Middle East and Africa - Market size and forecast 2025-2030 ($ million)
Data Table on Middle East and Africa - Market size and forecast 2025-2030 ($ million)
Chart on Middle East and Africa - Year-over-year growth 2025-2030 (%)
Data Table on Middle East and Africa - Year-over-year growth 2025-2030 (%)
Chart on Regional Comparison - Middle East and Africa
Data Table on Regional Comparison - Middle East and Africa

12.7.1 Saudi Arabia - Market size and forecast 2025-2030

Chart on Saudi Arabia - Market size and forecast 2025-2030 ($ million)
Data Table on Saudi Arabia - Market size and forecast 2025-2030 ($ million)
Chart on Saudi Arabia - Year-over-year growth 2025-2030 (%)
Data Table on Saudi Arabia - Year-over-year growth 2025-2030 (%)

12.7.2 UAE - Market size and forecast 2025-2030

Chart on UAE - Market size and forecast 2025-2030 ($ million)
Data Table on UAE - Market size and forecast 2025-2030 ($ million)
Chart on UAE - Year-over-year growth 2025-2030 (%)
Data Table on UAE - Year-over-year growth 2025-2030 (%)

12.7.3 Israel - Market size and forecast 2025-2030

Chart on Israel - Market size and forecast 2025-2030 ($ million)
Data Table on Israel - Market size and forecast 2025-2030 ($ million)
Chart on Israel - Year-over-year growth 2025-2030 (%)
Data Table on Israel - Year-over-year growth 2025-2030 (%)

12.7.4 South Africa - Market size and forecast 2025-2030

Chart on South Africa - Market size and forecast 2025-2030 ($ million)
Data Table on South Africa - Market size and forecast 2025-2030 ($ million)
Chart on South Africa - Year-over-year growth 2025-2030 (%)
Data Table on South Africa - Year-over-year growth 2025-2030 (%)

12.7.5 Turkey - Market size and forecast 2025-2030

Chart on Turkey - Market size and forecast 2025-2030 ($ million)
Data Table on Turkey - Market size and forecast 2025-2030 ($ million)
Chart on Turkey - Year-over-year growth 2025-2030 (%)
Data Table on Turkey - Year-over-year growth 2025-2030 (%)

12.8 Market opportunity by geography

Market opportunity by geography ($ million)
Data Tables on Market opportunity by geography ($ million)

13. Drivers, Challenges, and Opportunity

13.1 Market drivers

Advancement of consumer wearable technology
Expansion of commercial drone delivery
Growth of smart infrastructure monitoring

13.2 Market challenges

Mitigating error accumulation in navigation
Overcoming rigorous aerospace qualification hurdles
Balancing miniaturization and manufacturing costs

13.3 Impact of drivers and challenges

Impact of drivers and challenges in 2025 and 2030

13.4 Market opportunities

Space exploration and satellite constellations
Construction and mining equipment automation
Augmented reality and spatial computing

14. Competitive Landscape

14.1 Overview

14.2

Overview on criticality of inputs and factors of differentiation

14.3 Landscape disruption

Overview on factors of disruption

14.4 Industry risks

Impact of key risks on business

15. Competitive Analysis

15.1 Companies profiled

Companies covered

15.2 Company ranking index

15.3 Market positioning of companies

Matrix on companies position and classification

15.4 Analog Devices Inc.

Analog Devices Inc. - Overview
Analog Devices Inc. - Business segments
Analog Devices Inc. - Key offerings
Analog Devices Inc. - Segment focus
SWOT

15.5 Emcore Corp.

Emcore Corp. - Overview
Emcore Corp. - Product / Service
Emcore Corp. - Key offerings
SWOT

15.6 Garmin Ltd.

Garmin Ltd. - Overview
Garmin Ltd. - Business segments
Garmin Ltd. - Key news
Garmin Ltd. - Key offerings
Garmin Ltd. - Segment focus
SWOT

15.7 General Electric Co.

General Electric Co. - Overview
General Electric Co. - Business segments
General Electric Co. - Key offerings
General Electric Co. - Segment focus
SWOT

15.8 Honeywell International Inc.

Honeywell International Inc. - Overview
Honeywell International Inc. - Business segments
Honeywell International Inc. - Key news
Honeywell International Inc. - Key offerings
Honeywell International Inc. - Segment focus
SWOT

15.9 KVH Industries Inc.

KVH Industries Inc. - Overview
KVH Industries Inc. - Product / Service
KVH Industries Inc. - Key offerings
SWOT

15.10 Moog Inc.

Moog Inc. - Overview
Moog Inc. - Business segments
Moog Inc. - Key offerings
Moog Inc. - Segment focus
SWOT

15.11 Murata Manufacturing Co. Ltd.

Murata Manufacturing Co. Ltd. - Overview
Murata Manufacturing Co. Ltd. - Business segments
Murata Manufacturing Co. Ltd. - Key offerings
Murata Manufacturing Co. Ltd. - Segment focus
SWOT

15.12 Northrop Grumman Corp.

Northrop Grumman Corp. - Overview
Northrop Grumman Corp. - Business segments
Northrop Grumman Corp. - Key offerings
Northrop Grumman Corp. - Segment focus
SWOT

15.13 Safran SA

Safran SA - Overview
Safran SA - Business segments
Safran SA - Key news
Safran SA - Key offerings
Safran SA - Segment focus
SWOT

15.14 STMicroelectronics NV

STMicroelectronics NV - Overview
STMicroelectronics NV - Business segments
STMicroelectronics NV - Key news
STMicroelectronics NV - Key offerings
STMicroelectronics NV - Segment focus
SWOT

15.15 TDK InvenSense

TDK InvenSense - Overview
TDK InvenSense - Product / Service
TDK InvenSense - Key offerings
SWOT

15.16 Teledyne Technologies Inc.

Teledyne Technologies Inc. - Overview
Teledyne Technologies Inc. - Business segments
Teledyne Technologies Inc. - Key offerings
Teledyne Technologies Inc. - Segment focus
SWOT

15.17 Thales Group

Thales Group - Overview
Thales Group - Business segments
Thales Group - Key news
Thales Group - Key offerings
Thales Group - Segment focus
SWOT

15.18 VectorNav Technologies LLC

VectorNav Technologies LLC - Overview
VectorNav Technologies LLC - Product / Service
VectorNav Technologies LLC - Key offerings
SWOT

16. Appendix

16.1 Scope of the report

Market definition
Objectives
Notes and caveats

16.2 Inclusions and exclusions checklist

Inclusions checklist
Exclusions checklist

16.3 Currency conversion rates for US$

16.4 Research methodology

16.5 Data procurement

Information sources

16.6 Data validation

16.7 Validation techniques employed for market sizing

16.8 Data synthesis

16.9 360 degree market analysis

16.10 List of abbreviations

Research Methodology

Technavio presents a detailed picture of the market by way of study, synthesis, and summation of data from multiple sources. The analysts have presented the various facets of the market with a particular focus on identifying the key industry influencers. The data thus presented is comprehensive, reliable, and the result of extensive research, both primary and secondary.

INFORMATION SOURCES

Primary sources

  • Manufacturers and suppliers
  • Channel partners
  • Industry experts
  • Strategic decision makers

Secondary sources

  • Industry journals and periodicals
  • Government data
  • Financial reports of key industry players
  • Historical data
  • Press releases

DATA ANALYSIS

Data Synthesis

  • Collation of data
  • Estimation of key figures
  • Analysis of derived insights

Data Validation

  • Triangulation with data models
  • Reference against proprietary databases
  • Corroboration with industry experts

REPORT WRITING

Qualitative

  • Market drivers
  • Market challenges
  • Market trends
  • Five forces analysis

Quantitative

  • Market size and forecast
  • Market segmentation
  • Geographical insights
  • Competitive landscape

Interested in this report?

Get your sample now to see our research methodology and insights!

Download Now

Frequently Asked Questions

Inertial Measurement Unit (Imu) market growth will increase by USD 30858.0 million during 2026-2030.

The Inertial Measurement Unit (Imu) market is expected to grow at a CAGR of 15.6% during 2026-2030.

Inertial Measurement Unit (Imu) market is segmented by Component (Gyroscopes, Inertial combo, Accelerometers, Magnetometers) End-user (Consumer electronics, Automobiles, Industrial, Others) Application (Navigation, Control and stabilization, Detection and measurement)

Analog Devices Inc., Bosch Sensortec GmbH, Collins Aerospace, Emcore Corp., Exail, Garmin Ltd., General Electric Co., Gladiator Technologies Inc., Honeywell International Inc., Inertial Labs, KVH Industries Inc., MEMSIC Semiconductor Co. Ltd., Moog Inc., Movella Holdings Inc., Murata Manufacturing Co. Ltd., Northrop Grumman Corp., Safran SA, Silicon Sensing Systems Ltd., STMicroelectronics NV, TDK InvenSense, Teledyne Technologies Inc., Thales Group, VectorNav Technologies LLC are a few of the key vendors in the Inertial Measurement Unit (Imu) market.

North America will register the highest growth rate of 38.4% among the other regions. Therefore, the Inertial Measurement Unit (Imu) market in North America is expected to garner significant business opportunities for the vendors during the forecast period.

US, Canada, Mexico, China, Japan, India, South Korea, Australia, Indonesia, Germany, UK, France, Italy, Spain, The Netherlands, Brazil, Argentina, Chile, Saudi Arabia, UAE, Israel, South Africa, Turkey

  • Advancement of consumer wearable technology is the driving factor this market.

The Inertial Measurement Unit (Imu) market vendors should focus on grabbing business opportunities from the Component segment as it accounted for the largest market share in the base year.
RIA - Research AI Assistant
Ask RIA
