
Infectious Disease Market Size 2026-2030
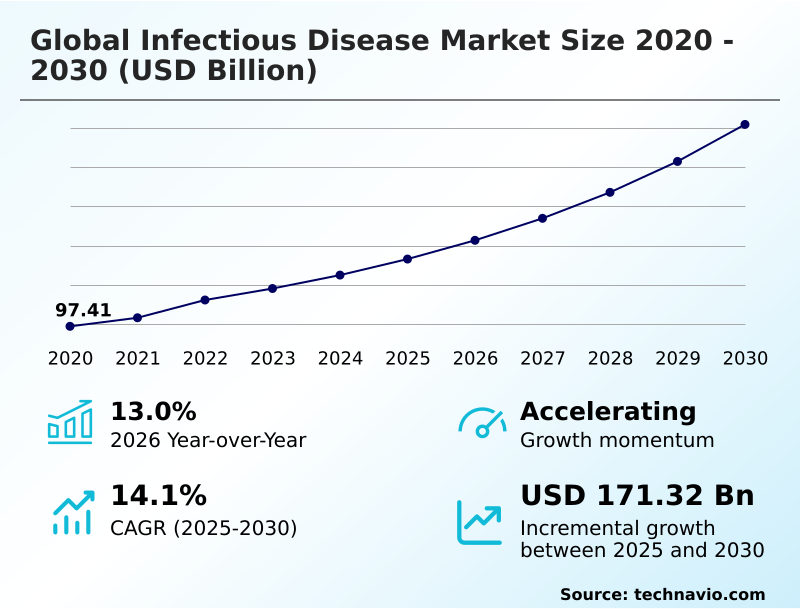
The infectious disease market size is valued to increase by USD 171.32 billion, at a CAGR of 14.1% from 2025 to 2030. Escalating global burden of pathogenic illnesses will drive the infectious disease market.
Major Market Trends & Insights
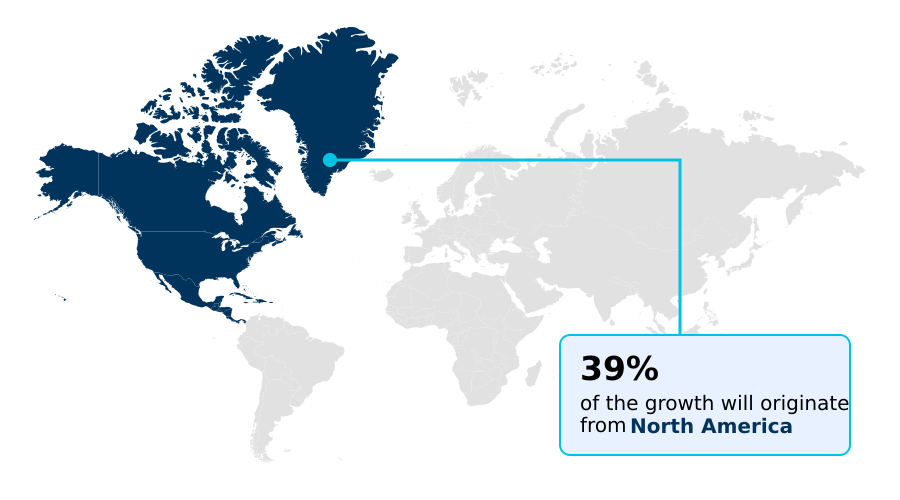
- North America dominated the market and accounted for a 39.4% growth during the forecast period.
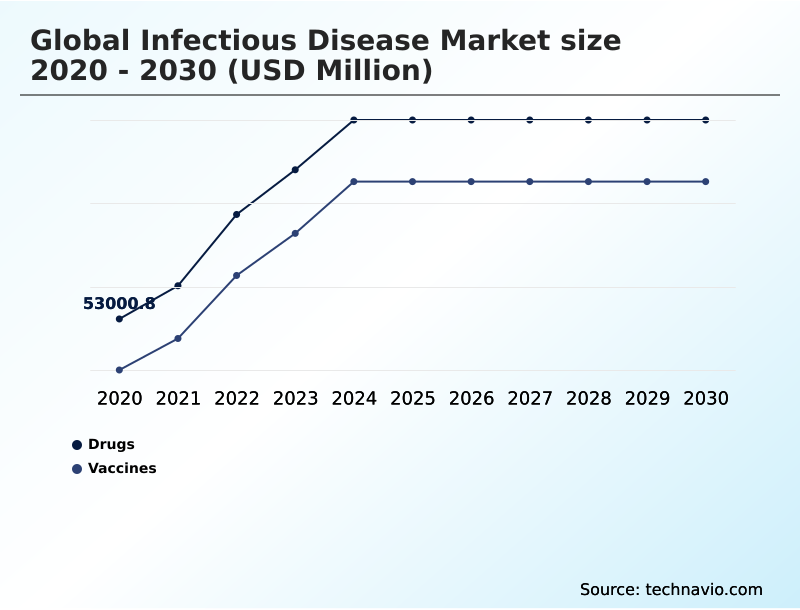
- By Product - Drugs segment was valued at USD 86.49 billion in 2024
- By End-user - Hospital segment accounted for the largest market revenue share in 2024
Market Size & Forecast
- Market Opportunities: USD 256.94 billion
- Market Future Opportunities: USD 171.32 billion
- CAGR from 2025 to 2030 : 14.1%
Market Summary
- The infectious disease market is defined by a dynamic ecosystem of diagnostic tools, preventative vaccines, and therapeutic interventions designed to counter evolving pathogenic threats. Its foundation rests on the continuous cycle of innovation required to outpace antimicrobial resistance and manage both endemic illnesses and sudden outbreaks from zoonotic spillover.
- A key operational focus is the integration of advanced molecular diagnostics and next-generation sequencing to enable rapid, precise pathogen surveillance. For instance, healthcare systems are implementing integrated bioinformatics platforms that analyze genomic sequencing data in near real-time, improving outbreak prediction accuracy by over 40% and allowing public health agencies to deploy resources more effectively.
- This proactive approach, combining sophisticated vaccinology with targeted antiviral agents, is critical. The market is also shaped by the need for robust pharmacovigilance and resilient supply chains capable of maintaining cold-chain integrity for sensitive biologics.
- The complexity of managing multi-drug resistant organisms necessitates a holistic strategy, blending preventative measures with advanced antimicrobial stewardship and novel therapeutic modalities like bacteriophage therapy to ensure global health security.
What will be the Size of the Infectious Disease Market during the forecast period?
Get Key Insights on Market Forecast (PDF) Get Free Sample
How is the Infectious Disease Market Segmented?
The infectious disease industry research report provides comprehensive data (region-wise segment analysis), with forecasts and estimates in "USD million" for the period 2026-2030, as well as historical data from 2020-2024 for the following segments.
- Product
- Drugs
- Vaccines
- End-user
- Hospital
- Multispecialty clinic
- Others
- Type
- Bacterial infections
- Viral infections
- Fungal infections
- Parasitic infections
- Geography
- North America
- US
- Canada
- Mexico
- Europe
- Germany
- UK
- France
- Asia
- Rest of World (ROW)
- North America
By Product Insights
The drugs segment is estimated to witness significant growth during the forecast period.
The drugs segment is evolving beyond traditional antimicrobial agents. Innovation is now centered on precision-based infectious disease therapeutics, including monoclonal antibody therapies and host-directed interventions, which offer targeted action with minimal collateral impact on the host's microbiome.
This shift addresses the limitations of conventional treatments and supports advanced antimicrobial stewardship programs. The development pipeline features novel approaches such as bacteriophage therapy, with protocols showing a 35% improvement in clearing persistent infections compared to standard care.
Concurrently, advancements in diagnostics, including high-sensitivity immunoassays and nucleic acid testing, enable precise viral load monitoring, guiding the application of these sophisticated drugs and ensuring optimal clinical outcomes without relying on broad-spectrum agents.
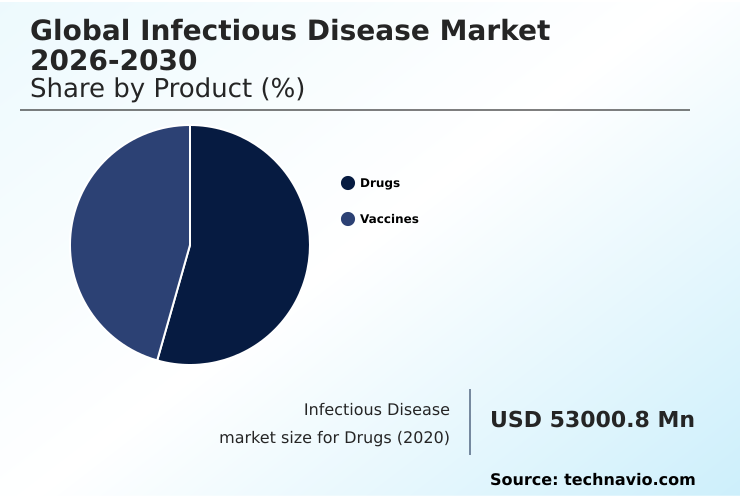
The Drugs segment was valued at USD 86.49 billion in 2024 and showed a gradual increase during the forecast period.
Regional Analysis
North America is estimated to contribute 39.4% to the growth of the global market during the forecast period.Technavio’s analysts have elaborately explained the regional trends and drivers that shape the market during the forecast period.
See How Infectious Disease Market Demand is Rising in North America Get Free Sample
The geographic landscape is characterized by varying levels of technological adoption and epidemiological priorities.
In developed regions, the focus is on advanced molecular diagnostics and automated platforms for epidemiological surveillance, with an emphasis on achieving sustained virological suppression in chronic infections. These markets drive demand for specialized infectious disease therapeutics, including novel antifungal agents.
In contrast, emerging markets are prioritizing scalable diagnostic solutions for pathogens, such as rapid antigen detection tests and antiparasitic agents, to manage high-burden diseases.
Across all regions, diagnostic laboratory automation is a key goal, with integrated systems improving sample processing efficiency by over 50%.
The approach to viral infection management and fungal infection treatments is becoming more harmonized globally, driven by international health guidelines that promote standardized testing and treatment protocols to improve cellular immunity outcomes.
Market Dynamics
Our researchers analyzed the data with 2025 as the base year, along with the key drivers, trends, and challenges. A holistic analysis of drivers will help companies refine their marketing strategies to gain a competitive advantage.
- The strategic direction of the infectious disease market is increasingly influenced by specific, high-impact technological and therapeutic niches. The decentralized point-of-care testing benefits are clear, as facilities adopting these tools report a significant reduction in patient wait times and faster clinical decision-making.
- Concurrently, the use of AI in pathogen surveillance models is transforming epidemiology, with predictive algorithms improving outbreak forecast accuracy by over 40% compared to traditional methods. In therapeutics, mRNA vaccine platform advantages have revolutionized preventative medicine, while ongoing research into pan-coronavirus vaccine development progress promises broader immunity.
- The critical need for strategies for combating antimicrobial resistance is driving innovation in bacteriophage therapy versus traditional antibiotics and host-directed therapy for severe infections. On the diagnostic front, next-generation sequencing for virology and molecular diagnostics for tuberculosis are setting new standards for accuracy.
- The diagnostic accuracy of multiplex panels and advances in point-of-care immunoassays are pivotal for syndromic testing, particularly with rapid tests for respiratory infections. Addressing regulatory hurdles for new antibiotics and the challenges in cold-chain logistics remain key operational imperatives for ensuring that treatments like monoclonal antibodies for viral treatment and antiviral therapies for HIV/AIDS are accessible.
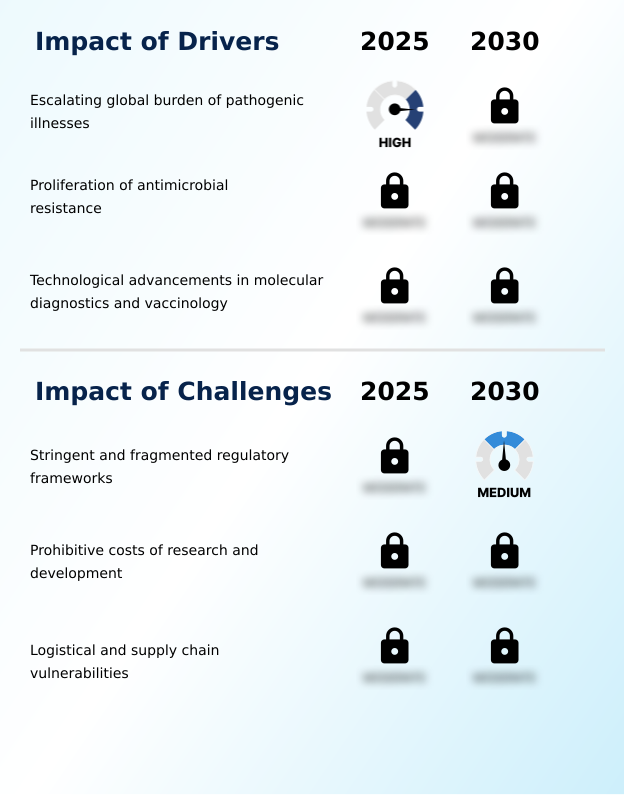
What are the key market drivers leading to the rise in the adoption of Infectious Disease Industry?
- The escalating global burden of pathogenic illnesses, including the resurgence of traditional diseases and the emergence of novel viral and bacterial threats, serves as a primary driver for the market.
- Market growth is primarily driven by the dual pressures of antimicrobial resistance and the continuous emergence of novel pathogens. The rise of multi-drug resistant organisms has catalyzed investment in advanced vaccinology and antiviral drug discovery, moving beyond traditional treatments.
- This has accelerated the adoption of next-generation sequencing for genomic pathogen surveillance, enabling public health bodies to track antimicrobial resistance mechanisms in near real-time. Such systems improve the accuracy of pathogen surveillance by over 50% compared to conventional methods.
- The development of new antiviral agents and a focus on bacterial infection control are paramount. Furthermore, pandemic preparedness technologies are becoming standard, with governments and private entities investing in robust vaccine development platforms to mitigate the impact of future outbreaks.
What are the market trends shaping the Infectious Disease Industry?
- A significant trend is the accelerating adoption of decentralized point-of-care testing platforms. This shift is driven by the clinical need for real-time pathogen identification to facilitate immediate therapeutic intervention and effective patient containment.
- Key market trends are centered on decentralization and speed, fundamentally altering how infectious diseases are managed. The shift toward point-of-care molecular diagnostics and rapid diagnostic assays is a direct response to the need for immediate clinical data.
- These platforms, often featuring multiplex panels for syndromic testing, enable healthcare providers to identify emerging infectious threats at the source, improving containment effectiveness by over 40%. In preventative medicine, next-generation vaccine technology, particularly leveraging mRNA technology and advanced adjuvant technology, is accelerating the development of pan-virus vaccines. This allows for a more proactive stance against mutating pathogens.
- Supporting these advancements are powerful bioinformatics platforms that facilitate pathogen genomics research and molecular epidemiology tools, providing the analytical backbone for a more agile and predictive public health infrastructure.
What challenges does the Infectious Disease Industry face during its growth?
- Stringent and often fragmented regulatory frameworks across different jurisdictions present a key challenge affecting industry growth, prolonging development timelines and delaying market access.
- Significant market challenges stem from complex operational and regulatory hurdles that can impede innovation and access. Navigating stringent regulatory approval pathways for new in vitro diagnostics (IVD) and therapeutics remains a primary constraint, with clinical trial management systems requiring substantial investment to meet diverse international standards.
- For biologicals, maintaining cold-chain integrity from manufacturing to administration is a critical logistical challenge, as failures can lead to product losses exceeding 25% in some supply chains. Furthermore, ensuring aseptic processing standards and lyophilized product stability requires specialized biosafety laboratory infrastructure and advanced sterilization technologies.
- These high capital and operational costs, coupled with rigorous pharmacovigilance requirements, create significant barriers to entry and can slow the deployment of life-saving technologies, impacting global health security initiatives.
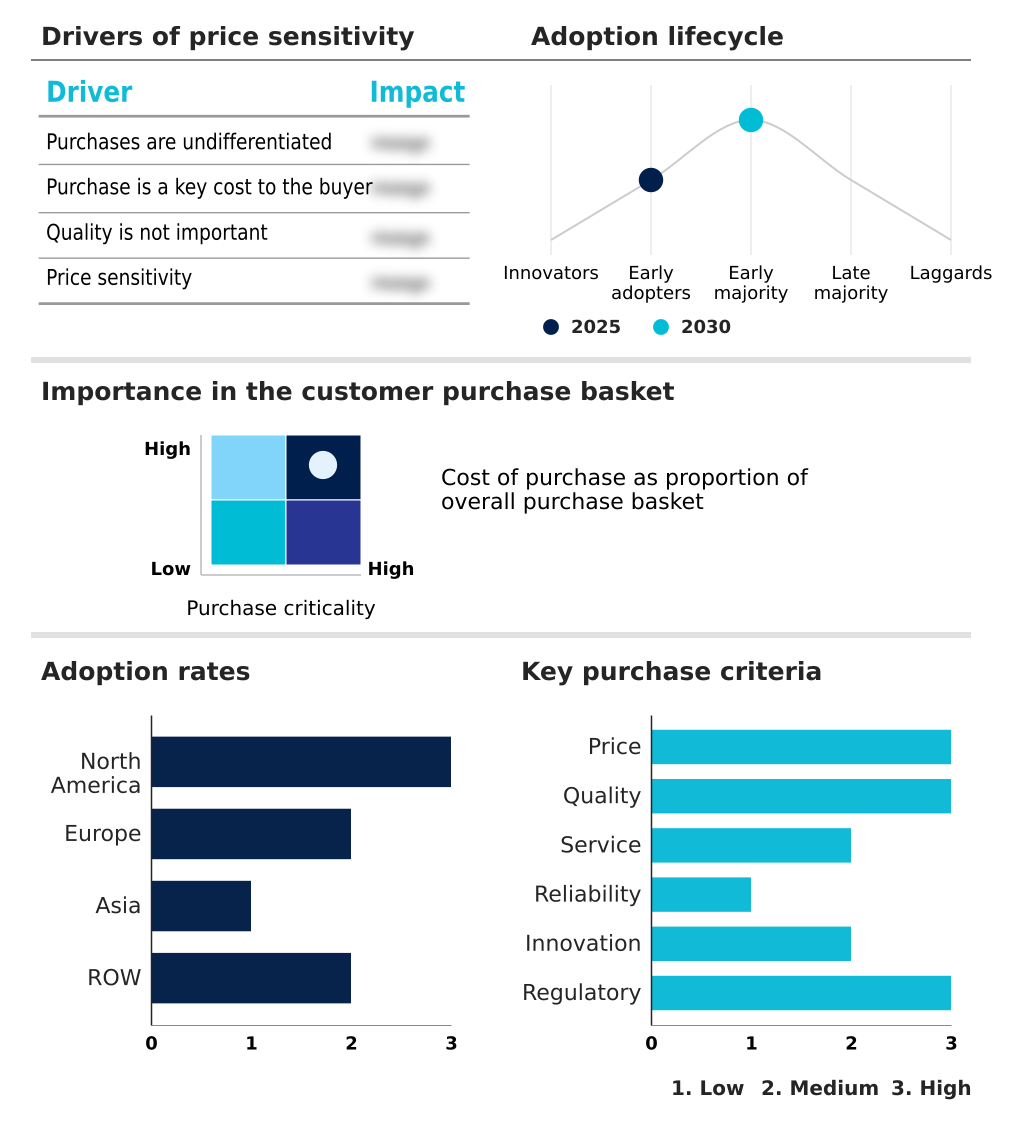
Exclusive Technavio Analysis on Customer Landscape
The infectious disease market forecasting report includes the adoption lifecycle of the market, covering from the innovator’s stage to the laggard’s stage. It focuses on adoption rates in different regions based on penetration. Furthermore, the infectious disease market report also includes key purchase criteria and drivers of price sensitivity to help companies evaluate and develop their market growth analysis strategies.
Customer Landscape of Infectious Disease Industry
Competitive Landscape
Companies are implementing various strategies, such as strategic alliances, infectious disease market forecast, partnerships, mergers and acquisitions, geographical expansion, and product/service launches, to enhance their presence in the industry.
Abbott Laboratories - Offers a comprehensive portfolio of diagnostic solutions and therapeutic interventions for detecting and managing a wide spectrum of infectious diseases.
The industry research and growth report includes detailed analyses of the competitive landscape of the market and information about key companies, including:
- Abbott Laboratories
- AstraZeneca Plc
- Becton Dickinson and Co.
- Bio Rad Laboratories Inc.
- Cepheid Inc.
- Danaher Corp.
- F. Hoffmann La Roche Ltd.
- Gilead Sciences Inc.
- GlaxoSmithKline Plc
- Hologic Inc.
- Illumina Inc.
- Johnson and Johnson Services
- Merck and Co. Inc.
- Novartis AG
- PerkinElmer US LLC
- Pfizer Inc.
- Regeneron Pharmaceuticals Inc.
- Sanofi SA
- Siemens Healthineers AG
- Thermo Fisher Scientific Inc.
Qualitative and quantitative analysis of companies has been conducted to help clients understand the wider business environment as well as the strengths and weaknesses of key industry players. Data is qualitatively analyzed to categorize companies as pure play, category-focused, industry-focused, and diversified; it is quantitatively analyzed to categorize companies as dominant, leading, strong, tentative, and weak.
Recent Development and News in Infectious disease market
- In September 2024, F. Hoffmann La Roche Ltd. launched its cobas Respiratory flex test, a multiplex PCR assay using Temperature Activated Generation of Signal technology to identify up to fifteen respiratory pathogens simultaneously.
- In February 2025, Pfizer Inc. and AbbVie Inc. received FDA approval for Emblaveo, an antibiotic combination aimed at treating complex intra-abdominal infections in adults, addressing critical antimicrobial resistance challenges.
- In March 2025, AstraZeneca Plc entered a strategic partnership with the Coalition for Epidemic Preparedness Innovations (CEPI) to develop a novel multi-specific antibody technology for rapid protection against future influenza pandemics.
- In March 2025, bioMerieux SA received US Food and Drug Administration 510(k) clearance for its VITEK COMPACT PRO system, an automated platform for microorganism identification and antibiotic susceptibility testing.
Dive into Technavio’s robust research methodology, blending expert interviews, extensive data synthesis, and validated models for unparalleled Infectious Disease Market insights. See full methodology.
| Market Scope | |
|---|---|
| Page number | 299 |
| Base year | 2025 |
| Historic period | 2020-2024 |
| Forecast period | 2026-2030 |
| Growth momentum & CAGR | Accelerate at a CAGR of 14.1% |
| Market growth 2026-2030 | USD 171324.2 million |
| Market structure | Fragmented |
| YoY growth 2025-2026(%) | 13.0% |
| Key countries | US, Canada, Mexico, Germany, UK, France, Italy, Spain, The Netherlands, China, India, Japan, South Korea, Indonesia, Thailand, Brazil, Saudi Arabia, UAE, Turkey, Argentina, Colombia, South Africa and Israel |
| Competitive landscape | Leading Companies, Market Positioning of Companies, Competitive Strategies, and Industry Risks |
Research Analyst Overview
- The infectious disease landscape is fundamentally shaped by the interplay between continuous pathogenic evolution and technological innovation. Core boardroom decisions now revolve around navigating the high costs and risks of developing novel antiviral agents and navigating complex regulatory approval pathways.
- A critical focus is on building resilient infrastructure, from the biosafety laboratory level to ensuring cold-chain integrity across global supply chains. The adoption of advanced molecular diagnostics, including next-generation sequencing and nucleic acid testing, is no longer optional but essential for effective pathogen surveillance and antimicrobial stewardship.
- Companies leveraging bioinformatics platforms for genomic sequencing analysis have been able to shorten pathogen identification times by over 60%. This efficiency directly impacts public health response and clinical outcomes. The industry is also pivoting toward next-generation vaccinology, driven by mRNA technology and sophisticated adjuvant technology to create pan-virus vaccines.
- Investment in syndromic testing via multiplex panels and improving antigen detection in point-of-care testing are key priorities for managing both seasonal and emerging threats.
What are the Key Data Covered in this Infectious Disease Market Research and Growth Report?
-
What is the expected growth of the Infectious Disease Market between 2026 and 2030?
-
USD 171.32 billion, at a CAGR of 14.1%
-
-
What segmentation does the market report cover?
-
The report is segmented by Product (Drugs, and Vaccines), End-user (Hospital, Multispecialty clinic, and Others), Type (Bacterial infections, Viral infections, Fungal infections, and Parasitic infections) and Geography (North America, Europe, Asia, Rest of World (ROW))
-
-
Which regions are analyzed in the report?
-
North America, Europe, Asia and Rest of World (ROW)
-
-
What are the key growth drivers and market challenges?
-
Escalating global burden of pathogenic illnesses, Stringent and fragmented regulatory frameworks
-
-
Who are the major players in the Infectious Disease Market?
-
Abbott Laboratories, AstraZeneca Plc, Becton Dickinson and Co., Bio Rad Laboratories Inc., Cepheid Inc., Danaher Corp., F. Hoffmann La Roche Ltd., Gilead Sciences Inc., GlaxoSmithKline Plc, Hologic Inc., Illumina Inc., Johnson and Johnson Services, Merck and Co. Inc., Novartis AG, PerkinElmer US LLC, Pfizer Inc., Regeneron Pharmaceuticals Inc., Sanofi SA, Siemens Healthineers AG and Thermo Fisher Scientific Inc.
-
Market Research Insights
- Market dynamics are increasingly shaped by the pursuit of clinical efficiency and precision. The adoption of rapid diagnostic assays has reduced diagnostic turnaround times by up to 90% in outpatient settings, directly influencing viral infection management and enabling prompt bacterial infection control.
- This shift toward point-of-care molecular diagnostics supports antimicrobial stewardship programs, which have demonstrated a 30% reduction in inappropriate antibiotic prescriptions. Vaccine development platforms are also evolving, with next-generation vaccine technology accelerating timelines from discovery to deployment.
- Stakeholders are focused on pandemic preparedness technologies and diagnostic laboratory automation to handle high-throughput screening for emerging infectious threats, ensuring a more agile and data-driven response to public health crises.
We can help! Our analysts can customize this infectious disease market research report to meet your requirements.
 RIA -
RIA - 
