Infrared Aerial Camera Market Analysis North America, APAC, Europe, Middle East and Africa, South America - US, Canada, China, Japan, Germany - Size and Forecast 2024-2028

Infrared Aerial Camera Market Analysis North America, APAC, Europe, Middle East and Africa, South America - US, Canada, China, Japan, Germany - Size and Forecast 2024-2028

Published: Oct 2023 157 Pages SKU: IRTNTR43022

Market Overview at a Glance

$237.3 Mn
Market Opportunity
5.65%
CAGR
4.87
YoY growth 2023-2024(%)

Infrared Aerial Camera Market Size 2024-2028 

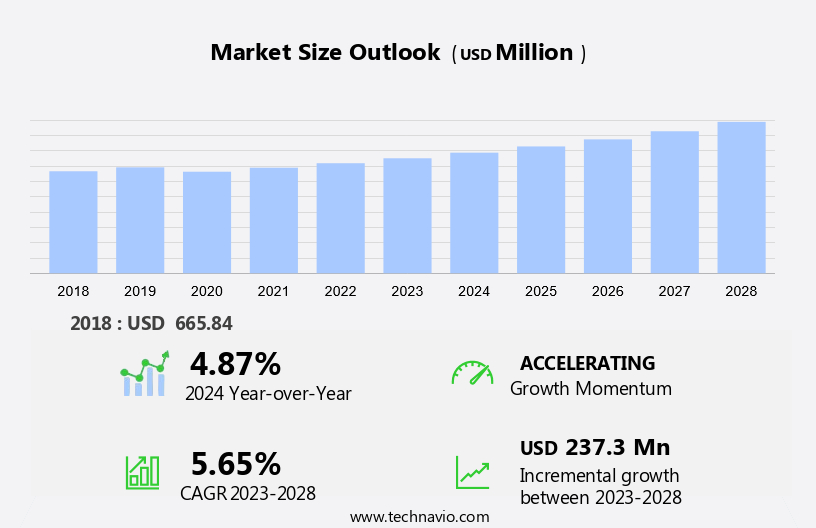
The infrared aerial camera market size is forecast to increase by USD 237.3 million at a CAGR of 5.65% between 2023 and 2028. The market is experiencing significant growth due to the increasing use of these cameras in Unmanned Aerial Vehicles (UAVs) for various applications such as surveillance, agriculture monitoring, and search and rescue operations. Additionally, the adoption of infrared aerial cameras in solar farms for thermal imaging and efficiency analysis is another major growth factor. However, the high cost of Research and Development (R&D) in infrared aerial camera technology remains a significant challenge for market growth. Manufacturers are investing heavily in R&D to reduce costs and improve the performance and functionality of these cameras, which is expected to drive innovation and market expansion. Overall, the market is poised for strong growth due to these trends and the increasing demand for advanced imaging solutions in various industries.

Infrared Aerial Camera Market Size

 Request Free Sample

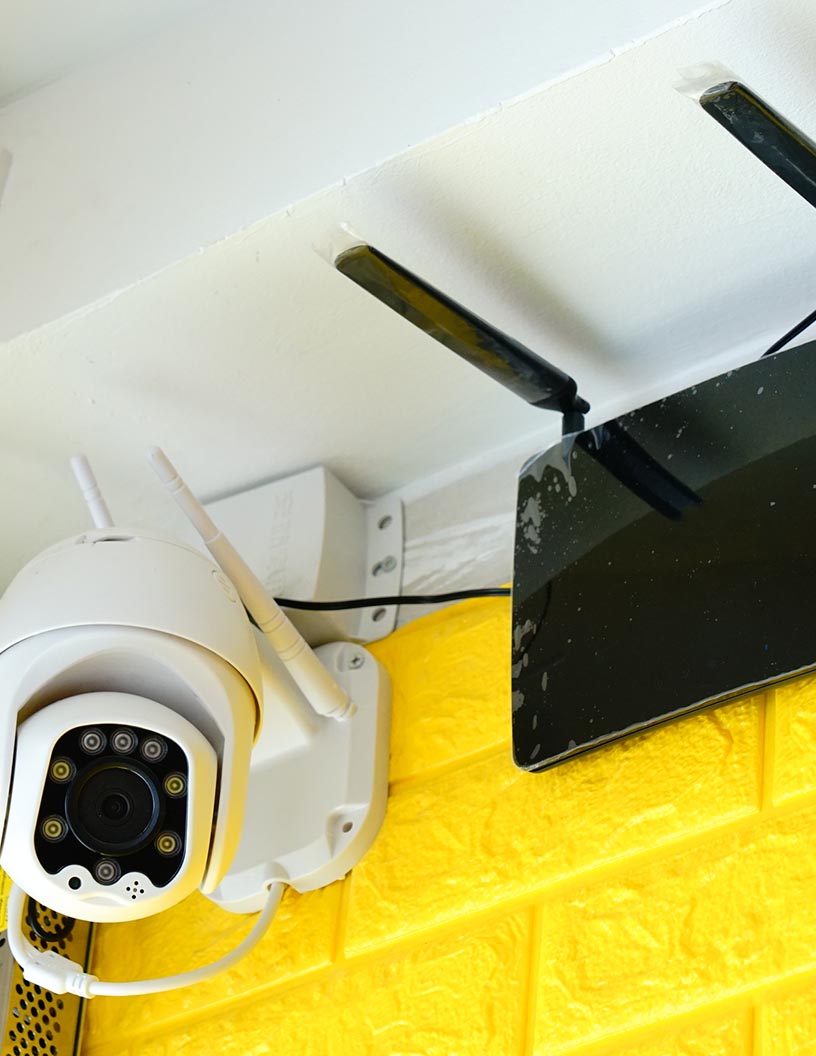
The market is experiencing significant growth due to the increasing adoption of UAVs for various applications such as mining, construction, surveillance, search and rescue, and railways. These UAVs are equipped with thermal cameras that capture radiometric data streams, converting infrared radiation into electrical signals to produce thermal images. Thermal performance is a crucial factor in the selection of these cameras, as they need to function optimally in various environmental conditions. External infrared cameras can be linked to UAVs via USB for real-time data transmission to the ground station. IR flash software is used to enhance the quality of thermal images, while autonomous capability and infrared software development are essential for advanced thermal analysis solutions.

Thermal imaging is also finding applications in smart devices, embedded systems, power infrastructure, healthcare, and security and surveillance. Radiometric technology, temperature sensing products, and FLIR systems are key players in the market, offering advanced features and solutions for diverse industries.

Market Segmentation

The market research report provides comprehensive data (region-wise segment analysis), with forecasts and estimates in "USD million" for the period 2024-2028, as well as historical data from 2018 - 2022 for the following segments.

  • Distribution Channel
    • Offline
    • Online
  • Application
    • Commercial
    • Military
  • Geography
    • North America
      • Canada
      • US
    • APAC
      • China
      • Japan
    • Europe
      • Germany
    • Middle East and Africa
    • South America

By Distribution Channel Insights

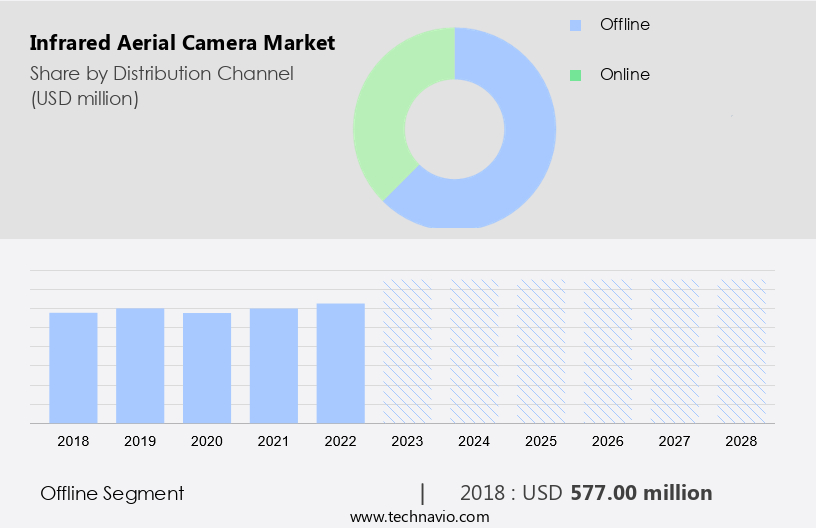
The offline segment is estimated to witness significant growth during the forecast period. Infrared aerial imaging cameras, utilizing radiometric data streams and USB link for seamless data transfer, are gaining significant traction in various industries. Thermal cameras, equipped with advanced IR Flash software, enable temperature sensing products to capture thermal images with high thermal performance. These cameras are integrated into drones, UAVs, and ground stations for applications in mining, construction, surveillance, search, firefighting, rescue, and more. FLIR Systems and other leading manufacturers provide radiometric technology and thermal analysis solutions for commercial and military applications. Infrared cameras convert infrared radiation into electrical signals, generating thermal images for visual imaging and autonomous capability. The market for these smart devices and embedded systems extends to power infrastructure, security and surveillance, healthcare, and more. Infrared software development continues to advance, enhancing the capabilities of these thermal performance solutions.

Infrared Aerial Camera Market Size

Get a glance at the market share of various segments Request Free Sample

The offline segment was valued at USD 577.00 million in 2018 and showed a gradual increase during the forecast period.

Regional Insights

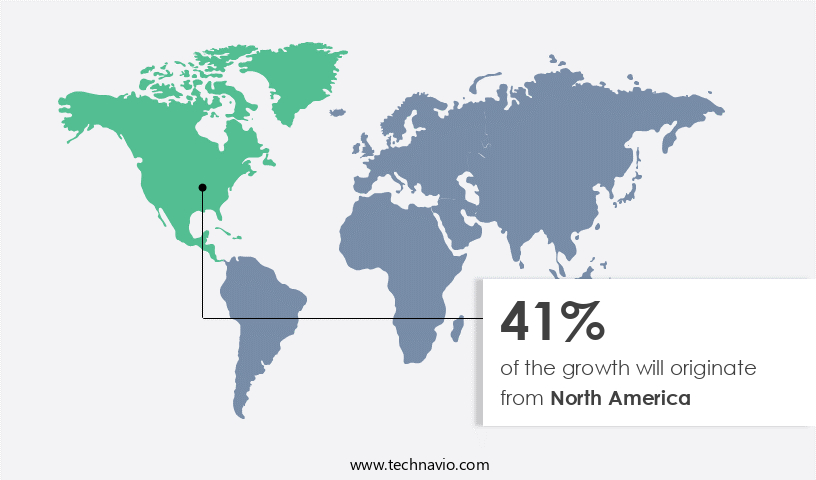
North America is estimated to contribute 41% to the growth of the global market during the forecast period. Technavio's analysts have elaborately explained the regional trends and drivers that shape the market during the forecast period.

Infrared Aerial Camera Market Share by Geography

For more insights on the market share of various regions Request Free Sample

The market is experiencing significant growth in North America, driven by expanding applications in both civil and military sectors. In the civil domain, industries such as chemical, agriculture, public safety, and law enforcement are witnessing increased demand for these cameras. The chemical industry's growth in this region is a key factor, as enterprises benefit from the availability of more abundant and cost-effective feedstock, leading to increased capital investments for expanding production capacity in countries like the US and Mexico. In the military sector, infrared aerial cameras find extensive use in border monitoring, army camps, and defense applications. Additionally, commercial surveillance and automotive applications are also contributing to the market growth. Short-wavelength IR, medium-wavelength IR, and long-wavelength IR technologies cater to various use cases, with image data playing a crucial role in ensuring effective monitoring and analysis.

Our researchers analyzed the data with 2023 as the base year, along with the key drivers, trends, and challenges. A holistic analysis of drivers will help companies refine their marketing strategies to gain a competitive advantage.

Infrared Aerial Camera Market Driver

The increasing use of infrared aerial cameras in UAVs is the key driver of the market. The integration of infrared aerial cameras into drones is gaining significant traction in various industries due to their ability to provide radiometric data streams in real-time. These cameras, which are also known as thermal cameras, have become essential tools for drones in sectors such as mining, construction, surveillance, search, firefighting, and rescue. Infrared radiation is the foundation of these cameras, converting electrical signals into thermal images. The thermal performance of these cameras is crucial, as they are used to detect heat and provide visual imaging in the absence of visible light. USB link connectivity allows for seamless data transfer from the drone to a ground station, where IR Flash software can be used for thermal analysis solutions.

External infrared cameras can also be attached to visible cameras for enhanced capabilities. UAVs equipped with infrared aerial cameras offer autonomous capability, making them indispensable in sectors like power infrastructure, security and surveillance, and healthcare. Companies like FLIR Systems lead the market in radiometric technology and temperature sensing products, providing high-quality sensors, lenses, and signal generators. The use of infrared aerial cameras in drones is transforming industries, from military applications to commercial uses, making them smart devices and embedded systems for efficient and effective operations.

Infrared Aerial Camera Market Trends

The increasing use of infrared aerial cameras in solar farms is the upcoming trend in the market. The market has witnessed significant growth due to the increasing demand for thermal imaging cameras technology in various sectors. USB link-enabled IR cameras offer radiometric data streams for superior thermal performance, making them ideal for applications such as mining, construction, surveillance, search, firefighting, rescue, and UAVs. Companies like FLIR Systems lead the market with advanced radiometric technology and thermal camera solutions, providing high-resolution thermal images for temperature sensing products. These cameras are integrated with IR Flash software, lens, sensor, signal generator, display, and are compatible with both commercial and military applications. The autonomous capability of UAVs equipped with infrared cameras enhances their usage in power infrastructure monitoring, security and surveillance, healthcare, and smart devices.

Infrared software development and thermal analysis solutions cater to the growing demand for embedded systems and power-efficient electrical signals. Infrared radiation plays a crucial role in visual imaging, and the market is expected to grow further with advancements in technology.

Infrared Aerial Camera Market Challenge

The high cost of R&D in infrared aerial camera development is a key challenge affecting the market growth. Infrared aerial cameras are gaining significant traction in various industries and military applications due to their ability to capture thermal images in complete darkness or under adverse weather conditions. These cameras use radiometric data streams and IR Flash software to convert infrared radiation into electrical signals, which are then processed to generate thermal images. Thermal cameras come with advanced features like a USB link, lens, sensor, signal generator, display, and thermal performance for enhanced thermal analysis solutions. External infrared cameras can be integrated with drones, visible cameras, ground stations, UAVs, and smart devices for commercial and military applications. The customization of infrared cameras is on the rise to cater to specific requirements in sectors like mining, construction, surveillance, search, firefighting, rescue, power infrastructure, security and surveillance, healthcare, and more.

Despite the high development cost, the increasing demand for infrared technology in various applications warrants continuous research and development efforts. companies are investing in infrared software development and thermal analysis solutions to meet the evolving needs of customers. Infrared technology is being adopted by various industries and militaries for its autonomous capability and ability to sense temperature, making it an essential tool for various applications.

Exclusive Customer Landscape

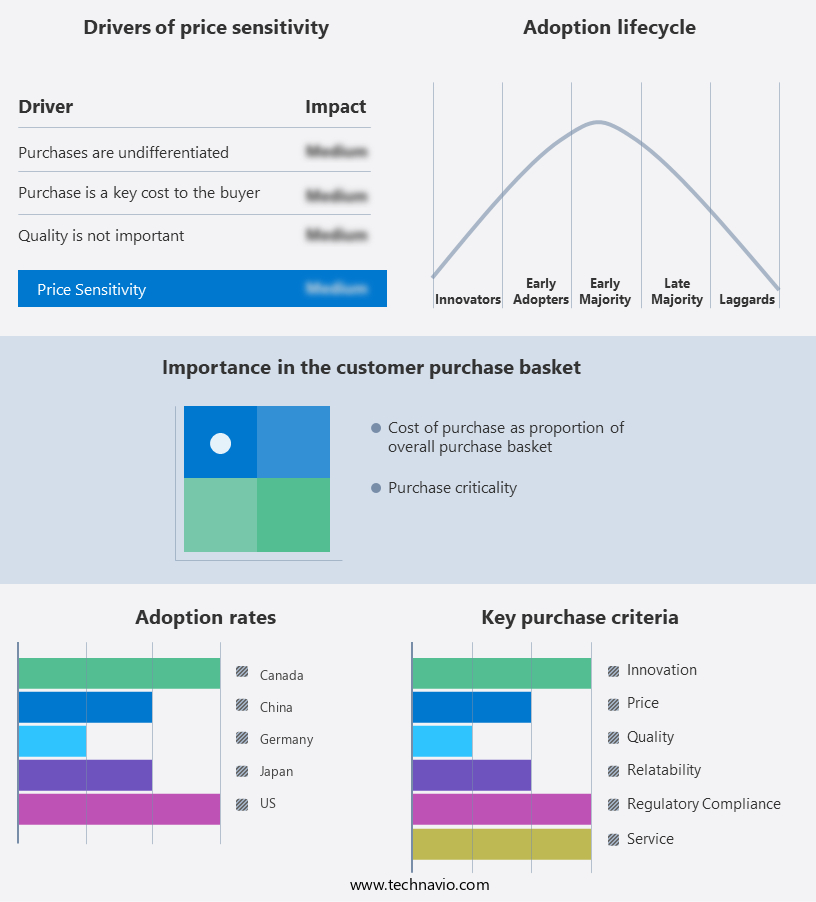
The market forecasting report includes the adoption lifecycle of the market, covering from the innovator's stage to the laggard's stage. It focuses on adoption rates in different regions based on penetration. Furthermore, the report also includes key purchase criteria and drivers of price sensitivity to help companies evaluate and develop their market growth analysis strategies.

Infrared Aerial Camera Market Share by Geography

 Customer Landscape

Key Companies & Market Insights

Companies are implementing various strategies, such as strategic alliances, partnerships, mergers and acquisitions, geographical expansion, and product/service launches, to enhance their presence in the market.

CONTROP Precision Technologies Ltd. - The company offers infrared aerial camera such as T stamp XD, M stamp, and T stamp XR.

The market research and growth report includes detailed analyses of the competitive landscape of the market and information about key companies, including:

  • DIAS Infrared GmbH
  • EchoBlue Ltd
  • HGH Systemes Infrarouges SAS
  • Infrared Cameras Inc.
  • InfraTec GmbH
  • Jenoptik AG
  • L3Harris Technologies Inc.
  • Leonardo Spa
  • Seek Thermal Inc.
  • Teledyne Technologies Inc.
  • Workswell Sro
  • Yuneec International Co. Ltd.

Qualitative and quantitative analysis of companies has been conducted to help clients understand the wider business environment as well as the strengths and weaknesses of key market players. Data is qualitatively analyzed to categorize companies as pure play, category-focused, industry-focused, and diversified; it is quantitatively analyzed to categorize companies as dominant, leading, strong, tentative, and weak.

Research Analyst Overview

The market is witnessing significant growth due to the increasing demand for thermal imaging in various industries such as mining, construction, surveillance, search, firefighting, and rescue. Infrared cameras convert infrared radiation into electrical signals, generating thermal images that provide valuable information on temperature sensing products. These cameras are integrated with USB link for easy data transfer and can be mounted on drones or UAVs for aerial surveillance. Radiometric data streams and IR flash software enable advanced thermal performance, while the integration of visible cameras enhances visual imaging. The market for infrared cameras includes both external and integrated solutions, with the latter gaining popularity due to their autonomous capability and compact design.

The market caters to both commercial and military applications, with FLIR Systems being a key player in the radiometric technology domain. The market also includes thermal analysis solutions, smart devices, and embedded systems for power infrastructure and healthcare sectors. Lens, sensor, signal generator, display, and battery are essential components of an infrared camera system.

Market Scope

Report Coverage

Details

Page number

157

Base year

2023

Historic period

2018-2022

Forecast period

2024-2028

Growth momentum & CAGR

Accelerate at a CAGR of 5.65%

Market growth 2024-2028

USD 237.3 million

Market structure

Concentrated

YoY growth 2023-2024(%)

4.87

Regional analysis

North America, APAC, Europe, Middle East and Africa, and South America

Performing market contribution

North America at 41%

Key countries

US, Canada, China, Japan, and Germany

Competitive landscape

Leading Companies, Market Positioning of Companies, Competitive Strategies, and Industry Risks

Key companies profiled

CONTROP Precision Technologies Ltd., DIAS Infrared GmbH, EchoBlue Ltd, HGH Systemes Infrarouges SAS, Infrared Cameras Inc., InfraTec GmbH, Jenoptik AG, L3Harris Technologies Inc., Leonardo Spa, Seek Thermal Inc., Teledyne Technologies Inc., Workswell Sro, and Yuneec International Co. Ltd.

Market dynamics

Parent market analysis, market growth inducers and obstacles, market forecast, fast-growing and slow-growing segment analysis, COVID-19 impact and recovery analysis and future consumer dynamics, market condition analysis for the forecast period

Customization purview

If our market report has not included the data that you are looking for, you can reach out to our analysts and get segments customized.

Request Free Sample

What are the Key Data Covered in this Market Research and Growth Report?

  • CAGR of the market during the forecast period
  • Detailed information on factors that will drive the market growth and forecasting between 2024 and 2028
  • Precise estimation of the size of the market  and its contribution of the market in focus to the parent market
  • Accurate predictions about upcoming market growth and trends and changes in consumer behaviour
  • Growth of the market across North America, APAC, Europe, Middle East and Africa, and South America
  • Thorough analysis of the market's competitive landscape and detailed information about companies
  • Comprehensive analysis of factors that will challenge the growth of market companies

We can help! Our analysts can customize this market research report to meet your requirements. Get in touch

1 Executive Summary

  • 1.1 Market overview
    • Exhibit 01: Executive Summary – Chart on Market Overview
    • Exhibit 02: Executive Summary – Data Table on Market Overview
    • Exhibit 03: Executive Summary – Chart on Global Market Characteristics
    • Exhibit 04: Executive Summary – Chart on Market by Geography
    • Exhibit 05: Executive Summary – Chart on Market Segmentation by Distribution Channel
    • Exhibit 06: Executive Summary – Chart on Market Segmentation by Application
    • Exhibit 07: Executive Summary – Chart on Incremental Growth
    • Exhibit 08: Executive Summary – Data Table on Incremental Growth
    • Exhibit 09: Executive Summary – Chart on Vendor Market Positioning

2 Market Landscape

  • 2.1 Market ecosystem
    • Exhibit 10: Parent market
    • Exhibit 11: Market Characteristics

3 Market Sizing

  • 3.1 Market definition
    • Exhibit 12: Offerings of vendors included in the market definition
  • 3.2 Market segment analysis
    • Exhibit 13: Market segments
  • 3.3 Market size 2023
    • 3.4 Market outlook: Forecast for 2023-2028
      • Exhibit 14: Chart on Global - Market size and forecast 2023-2028 ($ million)
      • Exhibit 15: Data Table on Global - Market size and forecast 2023-2028 ($ million)
      • Exhibit 16: Chart on Global Market: Year-over-year growth 2023-2028 (%)
      • Exhibit 17: Data Table on Global Market: Year-over-year growth 2023-2028 (%)

    4 Historic Market Size

    • 4.1 Global infrared aerial camera market 2018 - 2022
      • Exhibit 18: Historic Market Size – Data Table on global infrared aerial camera market 2018 - 2022 ($ million)
    • 4.2 Distribution channel Segment Analysis 2018 - 2022
      • Exhibit 19: Historic Market Size – Distribution channel Segment 2018 - 2022 ($ million)
    • 4.3 Application Segment Analysis 2018 - 2022
      • Exhibit 20: Historic Market Size – Application Segment 2018 - 2022 ($ million)
    • 4.4 Geography Segment Analysis 2018 - 2022
      • Exhibit 21: Historic Market Size – Geography Segment 2018 - 2022 ($ million)
    • 4.5 Country Segment Analysis 2018 - 2022
      • Exhibit 22: Historic Market Size – Country Segment 2018 - 2022 ($ million)

    5 Five Forces Analysis

    • 5.1 Five forces summary
      • Exhibit 23: Five forces analysis - Comparison between 2023 and 2028
    • 5.2 Bargaining power of buyers
      • Exhibit 24: Chart on Bargaining power of buyers – Impact of key factors 2023 and 2028
    • 5.3 Bargaining power of suppliers
      • Exhibit 25: Bargaining power of suppliers – Impact of key factors in 2023 and 2028
    • 5.4 Threat of new entrants
      • Exhibit 26: Threat of new entrants – Impact of key factors in 2023 and 2028
    • 5.5 Threat of substitutes
      • Exhibit 27: Threat of substitutes – Impact of key factors in 2023 and 2028
    • 5.6 Threat of rivalry
      • Exhibit 28: Threat of rivalry – Impact of key factors in 2023 and 2028
    • 5.7 Market condition
      • Exhibit 29: Chart on Market condition - Five forces 2023 and 2028

    6 Market Segmentation by Distribution Channel

    • 6.1 Market segments
      • Exhibit 30: Chart on Distribution Channel - Market share 2023-2028 (%)
      • Exhibit 31: Data Table on Distribution Channel - Market share 2023-2028 (%)
    • 6.2 Comparison by Distribution Channel
      • Exhibit 32: Chart on Comparison by Distribution Channel
      • Exhibit 33: Data Table on Comparison by Distribution Channel
    • 6.3 Offline - Market size and forecast 2023-2028
      • Exhibit 34: Chart on Offline - Market size and forecast 2023-2028 ($ million)
      • Exhibit 35: Data Table on Offline - Market size and forecast 2023-2028 ($ million)
      • Exhibit 36: Chart on Offline - Year-over-year growth 2023-2028 (%)
      • Exhibit 37: Data Table on Offline - Year-over-year growth 2023-2028 (%)
    • 6.4 Online - Market size and forecast 2023-2028
      • Exhibit 38: Chart on Online - Market size and forecast 2023-2028 ($ million)
      • Exhibit 39: Data Table on Online - Market size and forecast 2023-2028 ($ million)
      • Exhibit 40: Chart on Online - Year-over-year growth 2023-2028 (%)
      • Exhibit 41: Data Table on Online - Year-over-year growth 2023-2028 (%)
    • 6.5 Market opportunity by Distribution Channel
      • Exhibit 42: Market opportunity by Distribution Channel ($ million)
      • Exhibit 43: Data Table on Market opportunity by Distribution Channel ($ million)

    7 Market Segmentation by Application

    • 7.1 Market segments
      • Exhibit 44: Chart on Application - Market share 2023-2028 (%)
      • Exhibit 45: Data Table on Application - Market share 2023-2028 (%)
    • 7.2 Comparison by Application
      • Exhibit 46: Chart on Comparison by Application
      • Exhibit 47: Data Table on Comparison by Application
    • 7.3 Commercial - Market size and forecast 2023-2028
      • Exhibit 48: Chart on Commercial - Market size and forecast 2023-2028 ($ million)
      • Exhibit 49: Data Table on Commercial - Market size and forecast 2023-2028 ($ million)
      • Exhibit 50: Chart on Commercial - Year-over-year growth 2023-2028 (%)
      • Exhibit 51: Data Table on Commercial - Year-over-year growth 2023-2028 (%)
    • 7.4 Military - Market size and forecast 2023-2028
      • Exhibit 52: Chart on Military - Market size and forecast 2023-2028 ($ million)
      • Exhibit 53: Data Table on Military - Market size and forecast 2023-2028 ($ million)
      • Exhibit 54: Chart on Military - Year-over-year growth 2023-2028 (%)
      • Exhibit 55: Data Table on Military - Year-over-year growth 2023-2028 (%)
    • 7.5 Market opportunity by Application
      • Exhibit 56: Market opportunity by Application ($ million)
      • Exhibit 57: Data Table on Market opportunity by Application ($ million)

    8 Customer Landscape

    • 8.1 Customer landscape overview
      • Exhibit 58: Analysis of price sensitivity, lifecycle, customer purchase basket, adoption rates, and purchase criteria

    9 Geographic Landscape

    • 9.1 Geographic segmentation
      • Exhibit 59: Chart on Market share by geography 2023-2028 (%)
      • Exhibit 60: Data Table on Market share by geography 2023-2028 (%)
    • 9.2 Geographic comparison
      • Exhibit 61: Chart on Geographic comparison
      • Exhibit 62: Data Table on Geographic comparison
    • 9.3 North America - Market size and forecast 2023-2028
      • Exhibit 63: Chart on North America - Market size and forecast 2023-2028 ($ million)
      • Exhibit 64: Data Table on North America - Market size and forecast 2023-2028 ($ million)
      • Exhibit 65: Chart on North America - Year-over-year growth 2023-2028 (%)
      • Exhibit 66: Data Table on North America - Year-over-year growth 2023-2028 (%)
    • 9.4 APAC - Market size and forecast 2023-2028
      • Exhibit 67: Chart on APAC - Market size and forecast 2023-2028 ($ million)
      • Exhibit 68: Data Table on APAC - Market size and forecast 2023-2028 ($ million)
      • Exhibit 69: Chart on APAC - Year-over-year growth 2023-2028 (%)
      • Exhibit 70: Data Table on APAC - Year-over-year growth 2023-2028 (%)
    • 9.5 Europe - Market size and forecast 2023-2028
      • Exhibit 71: Chart on Europe - Market size and forecast 2023-2028 ($ million)
      • Exhibit 72: Data Table on Europe - Market size and forecast 2023-2028 ($ million)
      • Exhibit 73: Chart on Europe - Year-over-year growth 2023-2028 (%)
      • Exhibit 74: Data Table on Europe - Year-over-year growth 2023-2028 (%)
    • 9.6 Middle East and Africa - Market size and forecast 2023-2028
      • Exhibit 75: Chart on Middle East and Africa - Market size and forecast 2023-2028 ($ million)
      • Exhibit 76: Data Table on Middle East and Africa - Market size and forecast 2023-2028 ($ million)
      • Exhibit 77: Chart on Middle East and Africa - Year-over-year growth 2023-2028 (%)
      • Exhibit 78: Data Table on Middle East and Africa - Year-over-year growth 2023-2028 (%)
    • 9.7 South America - Market size and forecast 2023-2028
      • Exhibit 79: Chart on South America - Market size and forecast 2023-2028 ($ million)
      • Exhibit 80: Data Table on South America - Market size and forecast 2023-2028 ($ million)
      • Exhibit 81: Chart on South America - Year-over-year growth 2023-2028 (%)
      • Exhibit 82: Data Table on South America - Year-over-year growth 2023-2028 (%)
    • 9.8 US - Market size and forecast 2023-2028
      • Exhibit 83: Chart on US - Market size and forecast 2023-2028 ($ million)
      • Exhibit 84: Data Table on US - Market size and forecast 2023-2028 ($ million)
      • Exhibit 85: Chart on US - Year-over-year growth 2023-2028 (%)
      • Exhibit 86: Data Table on US - Year-over-year growth 2023-2028 (%)
    • 9.9 China - Market size and forecast 2023-2028
      • Exhibit 87: Chart on China - Market size and forecast 2023-2028 ($ million)
      • Exhibit 88: Data Table on China - Market size and forecast 2023-2028 ($ million)
      • Exhibit 89: Chart on China - Year-over-year growth 2023-2028 (%)
      • Exhibit 90: Data Table on China - Year-over-year growth 2023-2028 (%)
    • 9.10 Canada - Market size and forecast 2023-2028
      • Exhibit 91: Chart on Canada - Market size and forecast 2023-2028 ($ million)
      • Exhibit 92: Data Table on Canada - Market size and forecast 2023-2028 ($ million)
      • Exhibit 93: Chart on Canada - Year-over-year growth 2023-2028 (%)
      • Exhibit 94: Data Table on Canada - Year-over-year growth 2023-2028 (%)
    • 9.11 Germany - Market size and forecast 2023-2028
      • Exhibit 95: Chart on Germany - Market size and forecast 2023-2028 ($ million)
      • Exhibit 96: Data Table on Germany - Market size and forecast 2023-2028 ($ million)
      • Exhibit 97: Chart on Germany - Year-over-year growth 2023-2028 (%)
      • Exhibit 98: Data Table on Germany - Year-over-year growth 2023-2028 (%)
    • 9.12 Japan - Market size and forecast 2023-2028
      • Exhibit 99: Chart on Japan - Market size and forecast 2023-2028 ($ million)
      • Exhibit 100: Data Table on Japan - Market size and forecast 2023-2028 ($ million)
      • Exhibit 101: Chart on Japan - Year-over-year growth 2023-2028 (%)
      • Exhibit 102: Data Table on Japan - Year-over-year growth 2023-2028 (%)
    • 9.13 Market opportunity by geography
      • Exhibit 103: Market opportunity by geography ($ million)
      • Exhibit 104: Data Tables on Market opportunity by geography ($ million)

    10 Drivers, Challenges, and Trends

    • 10.1 Market drivers
      • 10.2 Market challenges
        • 10.3 Impact of drivers and challenges
          • Exhibit 105: Impact of drivers and challenges in 2023 and 2028
        • 10.4 Market trends

          11 Vendor Landscape

          • 11.1 Overview
            • 11.2 Vendor landscape
              • Exhibit 106: Overview on Criticality of inputs and Factors of differentiation
            • 11.3 Landscape disruption
              • Exhibit 107: Overview on factors of disruption
            • 11.4 Industry risks
              • Exhibit 108: Impact of key risks on business

            12 Vendor Analysis

            • 12.1 Vendors covered
              • Exhibit 109: Vendors covered
            • 12.2 Market positioning of vendors
              • Exhibit 110: Matrix on vendor position and classification
            • 12.3 CONTROP Precision Technologies Ltd.
              • Exhibit 111: CONTROP Precision Technologies Ltd. - Overview
              • Exhibit 112: CONTROP Precision Technologies Ltd. - Product / Service
              • Exhibit 113: CONTROP Precision Technologies Ltd. - Key offerings
            • 12.4 DIAS Infrared GmbH
              • Exhibit 114: DIAS Infrared GmbH - Overview
              • Exhibit 115: DIAS Infrared GmbH - Product / Service
              • Exhibit 116: DIAS Infrared GmbH - Key offerings
            • 12.5 EchoBlue Ltd
              • Exhibit 117: EchoBlue Ltd - Overview
              • Exhibit 118: EchoBlue Ltd - Product / Service
              • Exhibit 119: EchoBlue Ltd - Key offerings
            • 12.6 HGH Systemes Infrarouges SAS
              • Exhibit 120: HGH Systemes Infrarouges SAS - Overview
              • Exhibit 121: HGH Systemes Infrarouges SAS - Product / Service
              • Exhibit 122: HGH Systemes Infrarouges SAS - Key offerings
            • 12.7 Infrared Cameras Inc.
              • Exhibit 123: Infrared Cameras Inc. - Overview
              • Exhibit 124: Infrared Cameras Inc. - Product / Service
              • Exhibit 125: Infrared Cameras Inc. - Key offerings
            • 12.8 InfraTec GmbH
              • Exhibit 126: InfraTec GmbH - Overview
              • Exhibit 127: InfraTec GmbH - Product / Service
              • Exhibit 128: InfraTec GmbH - Key offerings
            • 12.9 Jenoptik AG
              • Exhibit 129: Jenoptik AG - Overview
              • Exhibit 130: Jenoptik AG - Business segments
              • Exhibit 131: Jenoptik AG - Key news
              • Exhibit 132: Jenoptik AG - Key offerings
              • Exhibit 133: Jenoptik AG - Segment focus
            • 12.10 L3Harris Technologies Inc.
              • Exhibit 134: L3Harris Technologies Inc. - Overview
              • Exhibit 135: L3Harris Technologies Inc. - Business segments
              • Exhibit 136: L3Harris Technologies Inc. - Key news
              • Exhibit 137: L3Harris Technologies Inc. - Key offerings
              • Exhibit 138: L3Harris Technologies Inc. - Segment focus
            • 12.11 Leonardo Spa
              • Exhibit 139: Leonardo Spa - Overview
              • Exhibit 140: Leonardo Spa - Business segments
              • Exhibit 141: Leonardo Spa - Key news
              • Exhibit 142: Leonardo Spa - Key offerings
              • Exhibit 143: Leonardo Spa - Segment focus
            • 12.12 Seek Thermal Inc.
              • Exhibit 144: Seek Thermal Inc. - Overview
              • Exhibit 145: Seek Thermal Inc. - Product / Service
              • Exhibit 146: Seek Thermal Inc. - Key offerings
            • 12.13 Teledyne Technologies Inc.
              • Exhibit 147: Teledyne Technologies Inc. - Overview
              • Exhibit 148: Teledyne Technologies Inc. - Business segments
              • Exhibit 149: Teledyne Technologies Inc. - Key news
              • Exhibit 150: Teledyne Technologies Inc. - Key offerings
              • Exhibit 151: Teledyne Technologies Inc. - Segment focus
            • 12.14 Workswell Sro
              • Exhibit 152: Workswell Sro - Overview
              • Exhibit 153: Workswell Sro - Product / Service
              • Exhibit 154: Workswell Sro - Key offerings
            • 12.15 Yuneec International Co. Ltd.
              • Exhibit 155: Yuneec International Co. Ltd. - Overview
              • Exhibit 156: Yuneec International Co. Ltd. - Product / Service
              • Exhibit 157: Yuneec International Co. Ltd. - Key offerings

            13 Appendix

            • 13.1 Scope of the report
              • 13.2 Inclusions and exclusions checklist
                • Exhibit 158: Inclusions checklist
                • Exhibit 159: Exclusions checklist
              • 13.3 Currency conversion rates for US$
                • Exhibit 160: Currency conversion rates for US$
              • 13.4 Research methodology
                • Exhibit 161: Research methodology
                • Exhibit 162: Validation techniques employed for market sizing
                • Exhibit 163: Information sources
              • 13.5 List of abbreviations
                • Exhibit 164: List of abbreviations

              Research Methodology

              Technavio presents a detailed picture of the market by way of study, synthesis, and summation of data from multiple sources. The analysts have presented the various facets of the market with a particular focus on identifying the key industry influencers. The data thus presented is comprehensive, reliable, and the result of extensive research, both primary and secondary.

              INFORMATION SOURCES

              Primary sources

              • Manufacturers and suppliers
              • Channel partners
              • Industry experts
              • Strategic decision makers

              Secondary sources

              • Industry journals and periodicals
              • Government data
              • Financial reports of key industry players
              • Historical data
              • Press releases

              DATA ANALYSIS

              Data Synthesis

              • Collation of data
              • Estimation of key figures
              • Analysis of derived insights

              Data Validation

              • Triangulation with data models
              • Reference against proprietary databases
              • Corroboration with industry experts

              REPORT WRITING

              Qualitative

              • Market drivers
              • Market challenges
              • Market trends
              • Five forces analysis

              Quantitative

              • Market size and forecast
              • Market segmentation
              • Geographical insights
              • Competitive landscape

              Interested in this report?

              Get your sample now to see our research methodology and insights!

              Download Now

              Frequently Asked Questions

              Infrared Aerial Camera market growth will increase by $ 237.3 mn during 2024-2028.

              The Infrared Aerial Camera market is expected to grow at a CAGR of 5.65% during 2024-2028.

              Infrared Aerial Camera market is segmented by Distribution Channel( Offline, Online) Application( Commercial, Military, Europe, South America)

              CONTROP Precision Technologies Ltd., DIAS Infrared GmbH, EchoBlue Ltd, HGH Systemes Infrarouges SAS, Infrared Cameras Inc., InfraTec GmbH, Jenoptik AG, L3Harris Technologies Inc., Leonardo Spa, Seek Thermal Inc., Teledyne Technologies Inc., Workswell Sro, Yuneec International Co. Ltd. are a few of the key vendors in the Infrared Aerial Camera market.

              North America will register the highest growth rate of 41% among the other regions. Therefore, the Infrared Aerial Camera market in North America is expected to garner significant business opportunities for the vendors during the forecast period.

              US, Canada, China, Japan, Germany

              • Increasing use of infrared aerial cameras in UAVsThe demand for small UAVs or drones is growing continuously as they are evolving beyond their military origin to become powerful business tools. The use of UAVs is increasing in civil government and commercial applications such as agriculture and firefighting. Also is the driving factor this market.
              • the overall spending on robotics and drones across the globe is increasing significantly. The integration of infrared aerial cameras into drones is also increasing as these drones help in rescue and search operations by law enforcement. Drones with infrared aerial cameras are used in various sectors such as mining is the driving factor this market.
              • construction is the driving factor this market.
              • surveillance is the driving factor this market.
              • electrical is the driving factor this market.
              • search is the driving factor this market.
              • firefighting is the driving factor this market.
              • and rescue. For instance is the driving factor this market.
              • during firefighting is the driving factor this market.
              • the use of infrared aerial cameras with UAVs can enable firefighters to view the live stream of structure fires is the driving factor this market.
              • forest fires is the driving factor this market.
              • or wildfires aerially as these cameras have the capability to see through smoke is the driving factor this market.
              • which helps them to carry out the rescue operation effectively and efficiently. These advantages are leading to an increase in demand for UAVs with infrared aerial cameras is the driving factor this market.
              • which is the driving factor this market.
              • in turn is the driving factor this market.
              • is encouraging vendors in the market to offer infrared aerial cameras that can be incorporated into UAVs. For instance is the driving factor this market.
              • FLIR Systems offers products such as FLIR Vue Pro 640 19MM for temperature sensing. Hence is the driving factor this market.
              • the increasing use of infrared aerial cameras with UAVs will increase the demand for infrared aerial cameras is the driving factor this market.
              • which in turn will fuel the growth of the global infrared aerial camera market during the forecast period. is the driving factor this market.

              The Infrared Aerial Camera market vendors should focus on grabbing business opportunities from the Offline segment as it accounted for the largest market share in the base year.