Injectable Drug Delivery Devices Market Size 2024-2028
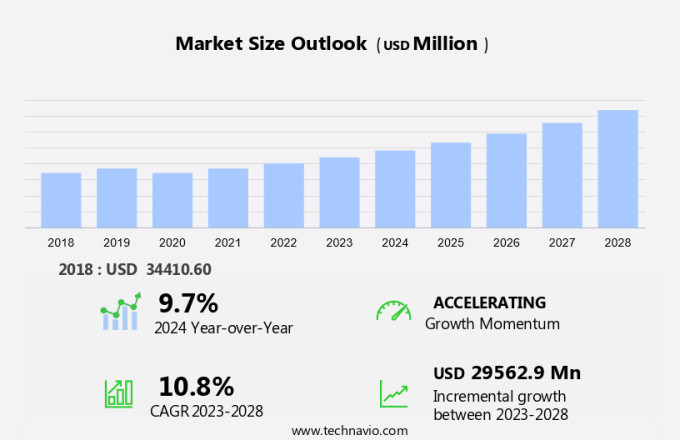
The injectable drug delivery devices market size is forecast to increase by USD 29.56 billion, at a CAGR of 10.8% between 2023 and 2028.
- The market is characterized by the rising prevalence of chronic diseases and the high growth potential in emerging countries. The increasing burden of chronic conditions, such as diabetes and cancer, necessitates the use of advanced drug delivery systems to ensure effective treatment and patient compliance. These devices offer several advantages, including improved dosage accuracy, reduced side effects, and enhanced patient convenience. However, the market faces significant challenges, including stringent regulations associated with injectable drug delivery devices. Regulatory agencies worldwide enforce rigorous standards to ensure the safety and efficacy of these devices. Compliance with these regulations can be time-consuming and costly, posing a significant challenge for market entrants.
- Additionally, the high cost of development and manufacturing can hinder market penetration, particularly in emerging countries with limited healthcare budgets. Companies seeking to capitalize on market opportunities must navigate these challenges effectively by investing in research and development, collaborating with regulatory agencies, and adopting cost-effective manufacturing strategies.
What will be the Size of the Injectable Drug Delivery Devices Market during the forecast period?
Explore in-depth regional segment analysis with market size data - historical 2018-2022 and forecasts 2024-2028 - in the full report.
Request Free Sample
The injectable drug delivery market continues to evolve, driven by advancements in drug solubility, injection devices, and formulation development. Drug stability and bioavailability remain key considerations, with pre-filled syringes and depot formulations gaining popularity for their ability to ensure consistent dosing and improve patient safety. The ongoing development of painless injection technologies, such as microneedle patches and needle-free injection devices, is also reshaping the market. Device manufacturing processes, including controlled release systems and pharmaceutical packaging, are continually improving to enhance drug formulation stability and patient compliance. The integration of ergonomic design and quality control measures into injection devices is essential for ensuring patient safety and satisfaction.
Injectable implants, bolus injections, and wearable injectors offer new opportunities for targeted drug delivery, with continuous infusion systems and pen injectors gaining traction in various therapeutic areas. However, challenges persist, including injection site reactions, material compatibility, and dose accuracy. The market's dynamics are influenced by various factors, including drug viscosity, patient compliance, and regulatory requirements. The ongoing development of advanced delivery mechanisms and biocompatible materials is expected to drive growth in the injectable drug delivery market. As the market continues to unfold, the focus on improving drug efficacy, patient safety, and overall quality will remain paramount.
The integration of these advancements into various sectors, from pharmaceuticals to healthcare, will shape the future of injectable drug delivery systems.
How is this Injectable Drug Delivery Devices Industry segmented?
The injectable drug delivery devices industry research report provides comprehensive data (region-wise segment analysis), with forecasts and estimates in "USD million" for the period 2024-2028, as well as historical data from 2018-2022 for the following segments.
- Product
- Advanced injectable drug delivery devices
- Conventional injectable drug delivery devices
- Geography
- North America
- US
- Canada
- Europe
- France
- Germany
- The Netherlands
- UK
- APAC
- China
- India
- Japan
- South Korea
- Rest of World (ROW)
- North America
By Product Insights
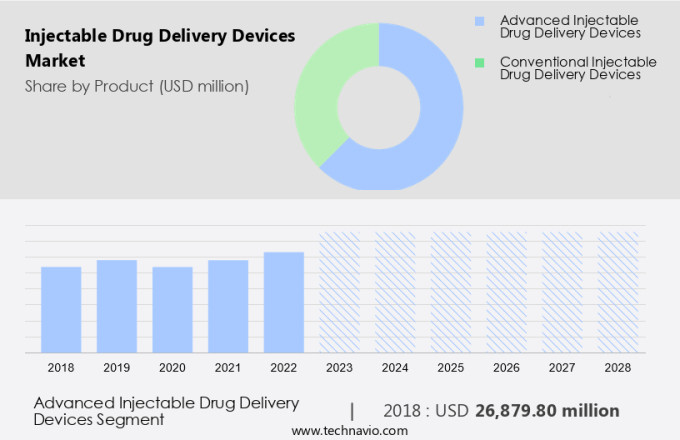
The advanced injectable drug delivery devices segment is estimated to witness significant growth during the forecast period.
The self-injectable devices market is experiencing significant growth due to the increasing number of biopharmaceuticals in clinical trials. Approximately 60% of these drugs are biologics, which require parenteral administration. Over 900 biologics and medicines are currently in development for various diseases, with the self-injectable devices segment being the preferred choice for delivery. Self-injectable devices, including pre-filled syringes, injectable pens, auto-injectors, and needle-free injectors, offer efficiency, reliability, and convenience for patients. These devices address challenges related to drug solubility, stability, and bioavailability. Advanced technologies such as microneedle patches, controlled release systems, and targeted drug delivery systems ensure drug efficacy and patient safety.
Device manufacturing processes prioritize quality control, material compatibility, and dose accuracy. Wearable injectors, continuous infusion systems, and syringe pumps cater to diverse patient needs and preferences. Injection site reactions, injection volume, and drug formulation stability are critical factors influencing device design and development. The market trends reflect a focus on painless injection, patient compliance, and ergonomic design to enhance the patient experience.
The Advanced injectable drug delivery devices segment was valued at USD 26.88 billion in 2018 and showed a gradual increase during the forecast period.
Regional Analysis
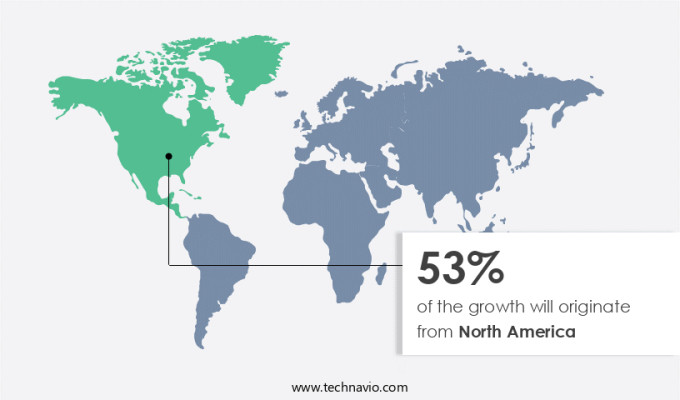
North America is estimated to contribute 53% to the growth of the global market during the forecast period. Technavio's analysts have elaborately explained the regional trends and drivers that shape the market during the forecast period.
Injectable drug delivery devices have gained significant traction in the healthcare industry due to the increasing prevalence of chronic diseases and the need for efficient drug administration. The North American market holds the largest share in this sector, primarily due to the region's high investment in research and development of new drugs and the presence of major pharmaceutical and biotechnical companies. The rise in lifestyle-related health disorders, such as diabetes and cancer, is driving the demand for these devices in the US and Canada. The prevalence of diseases like breast cancer in Canada is fueling the demand for new, efficient drugs and their delivery systems.
Drug solubility and stability, injection volume, patient safety, and drug bioavailability are crucial factors influencing the design and manufacturing of injection devices. Pre-filled syringes and pen injectors are popular choices due to their ease of use and accuracy. Depot formulations, controlled release systems, and bolus injections offer various advantages, including extended drug efficacy and improved patient compliance. Wearable injectors and syringe pumps provide continuous infusion, making them suitable for long-term treatments. Material compatibility, dose accuracy, and implant delivery are essential considerations for biocompatible materials used in these devices. Patient safety and comfort are critical aspects of injectable drug delivery systems.
Painless injection technologies, such as microneedle patches and needle-free injection, are gaining popularity. Targeted drug delivery and drug formulation stability are essential for enhancing drug efficacy and minimizing injection site reactions. Quality control and regulatory compliance are crucial for ensuring the safety and efficacy of these devices. In conclusion, the market is evolving with advancements in drug formulation stability, controlled release systems, and patient comfort. The focus on improving drug absorption, dose accuracy, and material compatibility is driving innovation in this sector. The increasing prevalence of chronic diseases and the need for efficient drug administration are expected to further fuel the market's growth.
Market Dynamics
Our researchers analyzed the data with 2023 as the base year, along with the key drivers, trends, and challenges. A holistic analysis of drivers will help companies refine their marketing strategies to gain a competitive advantage.
The market is witnessing significant growth due to the advancements in automated injection systems, minimally invasive drug delivery, and sustained release drug delivery systems. Biocompatible polymer drug encapsulation is a key technology in the development of personalized drug delivery solutions, enabling improved patient self-administration and reducing injection pain. Novel drug delivery methods, such as advanced microneedle technology and pre-filled syringe manufacturing processes, are revolutionizing the industry by enhancing injection site comfort and reliability. Research and development in improving injection site comfort and reducing injection pain are top priorities for market players. The design of efficient injection devices and the development of new injectables are crucial to addressing patient needs and preferences. Controlled drug delivery technology and drug stability and delivery are essential factors in ensuring drug efficacy and safety. Moreover, reducing injection complications is a major focus area for market participants. The market is expected to witness robust growth due to the increasing demand for advanced injectable drug delivery systems that offer improved drug delivery efficiency and reduced injection pain. The market is also driven by the development of new injectables and the reliability of drug delivery devices. Overall, the market is poised for significant growth, driven by technological advancements and evolving patient needs.
What are the key market drivers leading to the rise in the adoption of Injectable Drug Delivery Devices Industry?
- The escalating incidence of chronic diseases serves as the primary catalyst for market growth.
- The global market for injectable drug delivery devices is experiencing significant growth due to the increasing prevalence of chronic diseases and an aging population. Chronic conditions such as diabetes, cardiovascular diseases, arthritis, and cancer necessitate frequent medication administration for effective treatment and management. Injectable drug delivery devices, including syringes, auto-injectors, and pen injectors, offer a convenient and precise solution for administering medications that require rapid therapeutic effects. With the increasing incidence of diabetes, there is a growing demand for user-friendly insulin delivery systems.
- Material compatibility and dose accuracy are crucial factors in the selection of injectable drug delivery devices. Biocompatible materials and advanced technologies, such as syringe pumps and implant delivery systems, ensure optimal drug absorption and patient compliance. As the global population ages and lifestyle-related health issues increase, the need for effective and easy-to-use drug delivery systems is becoming increasingly important.
What are the market trends shaping the Injectable Drug Delivery Devices Industry?
- Emerging countries exhibit significant growth potential, making them an increasingly attractive market trend for businesses. This upward trajectory presents professionals with ample opportunities to expand their reach and increase profitability.
- The market is experiencing significant growth due to several factors. In emerging economies, the expanding middle class and increased healthcare spending are leading to improved healthcare infrastructure and greater access to medical facilities. This, in turn, is fueling demand for advanced healthcare solutions, including injectable drug delivery devices. In regions such as APAC, South America, and parts of Africa, the prevalence of chronic diseases like diabetes, cardiovascular disorders, and cancer is on the rise. These conditions often require frequent or precise dosing, making injectable devices an attractive option for patients. Moreover, drug solubility, stability, and bioavailability are crucial considerations for effective drug delivery.
- Pre-filled syringes, injection devices, depot formulations, and injectable implants are all contributing to the market's growth. Patient safety is a top priority, and advancements in these areas are driving innovation in injectable drug delivery devices. Overall, the market's growth is underpinned by the increasing need for user-friendly, precise, and effective drug delivery solutions.
What challenges does the Injectable Drug Delivery Devices Industry face during its growth?
- The stringent regulations governing the use of injectable drug delivery devices pose a significant challenge to the industry's growth, requiring rigorous compliance and substantial investments in research and development to ensure safety and efficacy.
- The injectable drug delivery device market faces stringent regulatory requirements, with regulatory bodies such as the U.S. FDA and the European Medicines Agency (EMA) imposing rigorous standards to ensure product safety, efficacy, and quality. These regulations cover various aspects of device design, testing, and materials, particularly for devices that directly impact patient health. Manufacturers must navigate extensive approval processes, which can be time-consuming and costly, often delaying market entry and increasing production costs. Injectable devices face specific regulations regarding sterility, precision in dosing, and materials compatibility to minimize risks of contamination and adverse reactions. As technology advances, regulatory requirements continue to evolve, pushing companies to consistently update their products and processes.
- For instance, painless injection technologies, such as microneedle patches and controlled release systems, require careful formulation stability management and precise drug viscosity control. Pharmaceutical packaging plays a crucial role in maintaining drug efficacy and patient safety, necessitating rigorous testing and validation. Targeted drug delivery systems, which aim to deliver drugs directly to specific areas of the body, present additional challenges due to the complexity of the technology and the need for precise drug targeting. Device ergonomics also play a significant role in patient acceptance and adherence to treatment regimens, requiring manufacturers to prioritize user-friendly designs and ease of use.
- Despite these challenges, the market for injectable drug delivery devices continues to grow, driven by the increasing demand for minimally invasive drug delivery methods and the development of advanced technologies that address the regulatory and technical hurdles.
Exclusive Customer Landscape
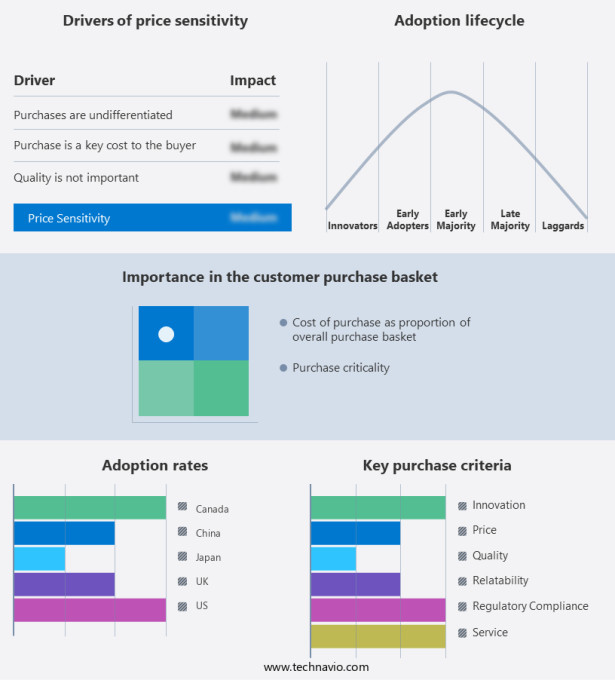
The injectable drug delivery devices market forecasting report includes the adoption lifecycle of the market, covering from the innovator's stage to the laggard's stage. It focuses on adoption rates in different regions based on penetration. Furthermore, the injectable drug delivery devices market report also includes key purchase criteria and drivers of price sensitivity to help companies evaluate and develop their market growth analysis strategies.
Customer Landscape
Key Companies & Market Insights
Companies are implementing various strategies, such as strategic alliances, injectable drug delivery devices market forecast, partnerships, mergers and acquisitions, geographical expansion, and product/service launches, to enhance their presence in the industry.
Antares Pharma Inc. - This company specializes in the development and commercialization of advanced injectable drug delivery systems for mRNA therapies, leveraging cutting-edge technology to enhance treatment efficacy and patient experience.
The industry research and growth report includes detailed analyses of the competitive landscape of the market and information about key companies, including:
- Antares Pharma Inc.
- AstraZeneca Plc
- B.Braun SE
- Baxter International Inc.
- Becton Dickinson and Co.
- Bespak Europe Ltd.
- Credence MedSystems Inc.
- E3D Elcam Drug Delivery Devices
- Eli Lilly and Co.
- F. Hoffmann La Roche Ltd.
- Gerresheimer AG
- Insulet Corp.
- Owen Mumford Ltd.
- Sanofi SA
- SCHOTT AG
- SHL Medical AG
- Terumo Corp.
- Teva Pharmaceutical Industries Ltd.
- Viatris Inc.
- West Pharmaceutical Services Inc.
Qualitative and quantitative analysis of companies has been conducted to help clients understand the wider business environment as well as the strengths and weaknesses of key industry players. Data is qualitatively analyzed to categorize companies as pure play, category-focused, industry-focused, and diversified; it is quantitatively analyzed to categorize companies as dominant, leading, strong, tentative, and weak.
Recent Development and News in Injectable Drug Delivery Devices Market
- In January 2024, F. Hoffmann-La Roche Ltd. Announced the launch of its new injectable drug delivery device, the Roche Pen Inhalcare, for insulin administration. This innovative pen features a built-in insulin cartridge and a reusable injector, aiming to improve patient convenience and adherence (Roche Press Release, 2024).
- In March 2024, Merck KGaA and Versameb S.A.S entered into a strategic partnership to co-develop and commercialize a novel, wearable injector system for the delivery of Merck's investigational multiple sclerosis therapy, cladribine tablets. This collaboration is expected to enhance patient experience and treatment outcomes (Merck KGaA Press Release, 2024).
- In April 2025, Pfizer Inc. completed the acquisition of Biohaven Pharma's commercial business, gaining access to its FDA-approved injectable drug, Nurtec ODT (rimegepant) for the prevention and treatment of migraine. This acquisition strengthens Pfizer's presence in the neurology market and expands its portfolio of injectable drugs (Pfizer Press Release, 2025).
- In May 2025, the European Medicines Agency granted marketing authorization to Eli Lilly and Company for its new, pre-filled, disposable pen, the Fulfill Pen, for the administration of insulin lispro injection. This approval marks a significant milestone in the company's efforts to provide more convenient and accessible insulin therapy options for patients (EMA Press Release, 2025).
Research Analyst Overview
- The market is experiencing significant advancements driven by patient preferences for convenient and effective treatment options. Drug delivery pathways, including intravenous infusion and pulmonary delivery, are undergoing optimization using biodegradable polymers to enhance drug transport and dosage regimen. Clinical trials are ongoing for lyophilized drugs and powder formulations to expand the range of administered treatments. Device cost and design are crucial factors influencing market trends, with safety features, device sterilization, and injection training becoming increasingly important. Regulatory approval processes are rigorous, ensuring device validation, release kinetics, and device lifespan meet stringent safety standards. In healthcare settings, device maintenance and tissue distribution are critical considerations for efficient and effective drug administration.
- Drug interactions, safety features, and drug partitioning are essential aspects of injection technology development. Subcutaneous and muscular injections are common methods, with polymer degradation and device sterilization impacting drug metabolism and therapeutic index. Device validation, liquid formulation, and injection technology advancements are shaping the future of injectable drug delivery devices.
Dive into Technavio's robust research methodology, blending expert interviews, extensive data synthesis, and validated models for unparalleled Injectable Drug Delivery Devices Market insights. See full methodology.
|
Market Scope |
|
|
Report Coverage |
Details |
|
Page number |
159 |
|
Base year |
2023 |
|
Historic period |
2018-2022 |
|
Forecast period |
2024-2028 |
|
Growth momentum & CAGR |
Accelerate at a CAGR of 10.8% |
|
Market growth 2024-2028 |
USD 29562.9 million |
|
Market structure |
Fragmented |
|
YoY growth 2023-2024(%) |
9.7 |
|
Key countries |
US, China, UK, Canada, Japan, Germany, India, South Korea, France, and The Netherlands |
|
Competitive landscape |
Leading Companies, Market Positioning of Companies, Competitive Strategies, and Industry Risks |
What are the Key Data Covered in this Injectable Drug Delivery Devices Market Research and Growth Report?
- CAGR of the Injectable Drug Delivery Devices industry during the forecast period
- Detailed information on factors that will drive the growth and forecasting between 2024 and 2028
- Precise estimation of the size of the market and its contribution of the industry in focus to the parent market
- Accurate predictions about upcoming growth and trends and changes in consumer behaviour
- Growth of the market across North America, Europe, Asia, and Rest of World (ROW)
- Thorough analysis of the market's competitive landscape and detailed information about companies
- Comprehensive analysis of factors that will challenge the injectable drug delivery devices market growth of industry companies
We can help! Our analysts can customize this injectable drug delivery devices market research report to meet your requirements.


