
Instrumentation Services Market Size 2025-2029
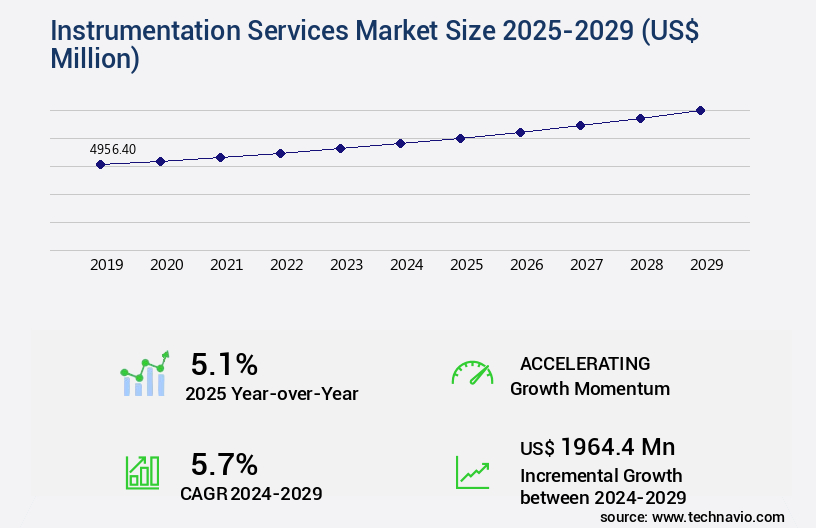
The instrumentation services market size is valued to increase by USD 1.96 billion, at a CAGR of 5.7% from 2024 to 2029. Rising number of industrial Internet of Things applications will drive the instrumentation services market.
Major Market Trends & Insights
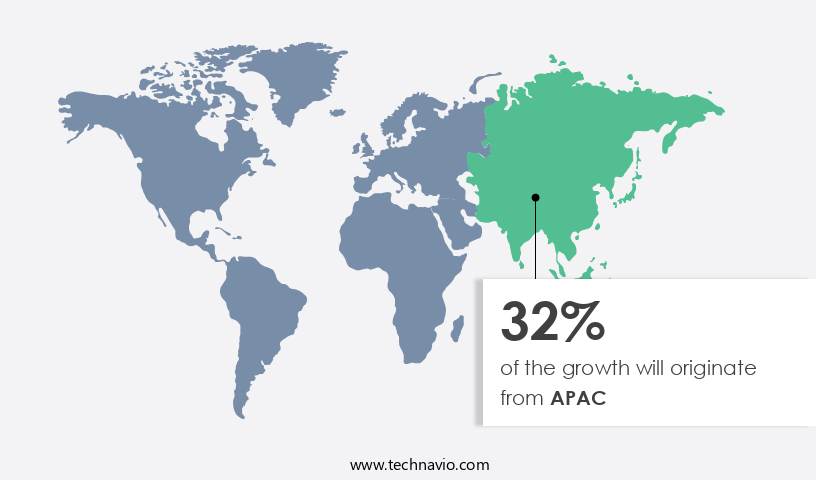
- APAC dominated the market and accounted for a 32% growth during the forecast period.
- By Service - Calibration segment was valued at USD 2.57 billion in 2023
- By End-user - Process industries segment accounted for the largest market revenue share in 2023
Market Size & Forecast
- Market Opportunities: USD 63.50 million
- Market Future Opportunities: USD 1964.40 million
- CAGR from 2024 to 2029 : 5.7%
Market Summary
- The market experiences continuous expansion, fueled by the increasing adoption of advanced technologies and the rising number of industrial Internet of Things applications. On-site deputation of service personnel ensures efficient maintenance and calibration of complex instruments, driving market growth. Standardization of instruments and communication protocols enhances interoperability, enabling seamless data exchange and integration across industrial systems.
- With a focus on innovation and expertise, service providers cater to diverse industries, including oil and gas, power, and manufacturing, to deliver reliable and accurate measurement solutions.
What will be the Size of the Instrumentation Services Market during the forecast period?
Get Key Insights on Market Forecast (PDF) Request Free Sample
How is the Instrumentation Services Market Segmented?
The instrumentation services industry research report provides comprehensive data (region-wise segment analysis), with forecasts and estimates in "USD million" for the period 2025-2029, as well as historical data from 2019-2023 for the following segments.
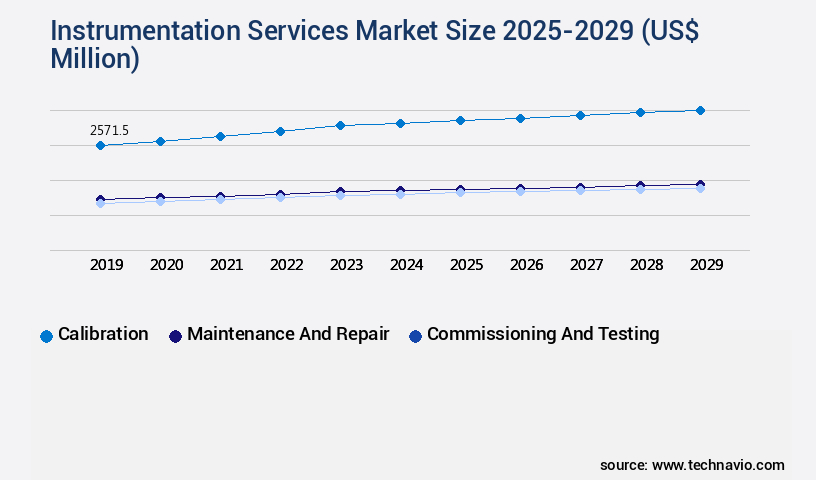
- Service
- Calibration
- Maintenance and repair
- Commissioning and testing
- End-user
- Process industries
- Discrete industries
- Application
- Laboratory analysis
- Environmental monitoring
- Process control
- Material testing
- Others
- Geography
- North America
- US
- Canada
- Europe
- France
- Germany
- UK
- APAC
- China
- India
- Japan
- South Korea
- South America
- Brazil
- Rest of World (ROW)
- North America
By Service Insights
The calibration segment is estimated to witness significant growth during the forecast period.
In the ever-evolving landscape of industrial automation, the market continues to adapt and innovate. With a focus on data integrity validation and predictive maintenance, companies invest in advanced technologies such as sensor networks, data logging software, and performance testing. Safety instrumented systems, temperature sensors, and remote monitoring systems are integrated into industrial processes to ensure optimal performance and regulatory compliance. Calibration certificates, a crucial aspect of instrument lifecycle management, are meticulously maintained to ensure precision measurement. Signal processing techniques and quality control metrics are employed to enhance the accuracy of data acquisition systems, including vibration measurement and flow rate sensors.
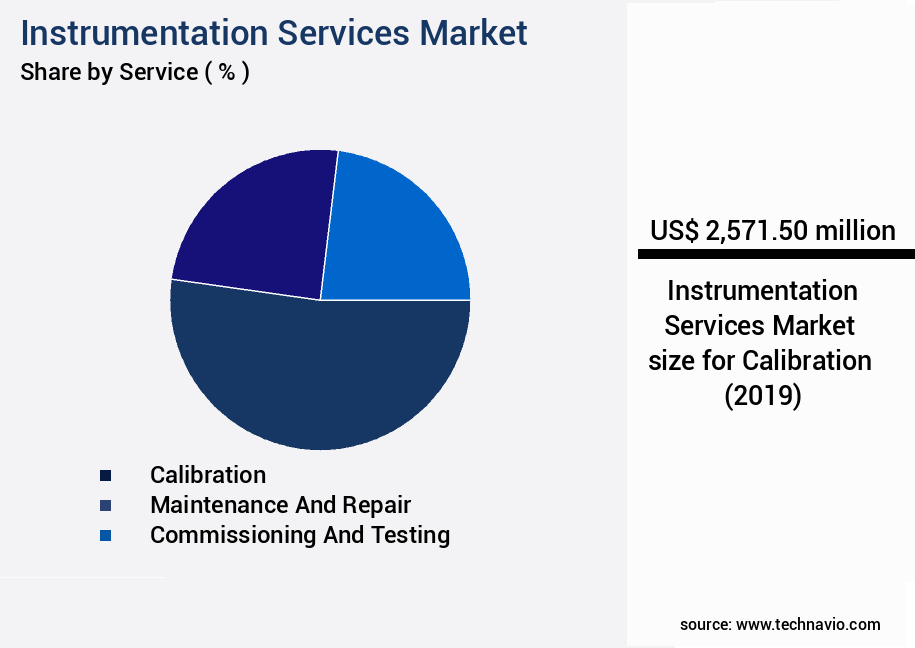
The Calibration segment was valued at USD 2.57 billion in 2019 and showed a gradual increase during the forecast period.
Pressure transducers and calibration standards are calibrated using field service management and asset management systems. Industrial automation relies on wireless instrumentation, system validation, and instrument maintenance to minimize downtime and troubleshooting techniques. Instrumentation protocols and data security protocols are prioritized to maintain system integration services and data visualization tools. As regulatory compliance becomes increasingly stringent, companies must adhere to strict standards, with 75% of industrial facilities reporting annual calibration of their instrumentation. The integration of real-time data analysis and sensor accuracy into industrial processes is a key trend, enabling remote diagnostics and system integration services.
Regional Analysis
APAC is estimated to contribute 32% to the growth of the global market during the forecast period. Technavio's analysts have elaborately explained the regional trends and drivers that shape the market during the forecast period.
See How Instrumentation Services Market Demand is Rising in APAC Request Free Sample
The market has experienced noteworthy evolution, particularly in North America, where the natural gas production capacity has seen a substantial increase. This expansion is influenced by both supply-side and demand-side factors. The commercial utilization of fracking technology has revolutionized natural gas extraction, enabling affordable production. Simultaneously, the petrochemicals and power generation industries in the US, Canada, and Mexico exhibit growing demand for natural gas. In contrast, the automotive sector in North America is projected to exhibit a stabilized growth rate.
Factors such as the increasing popularity of public transportation and the reliance on cab services are anticipated to curb the sales of personal vehicles during the forecast period. The market is characterized by its dynamic nature, responding to these industry shifts and technological advancements.
Market Dynamics
Our researchers analyzed the data with 2024 as the base year, along with the key drivers, trends, and challenges. A holistic analysis of drivers will help companies refine their marketing strategies to gain a competitive advantage.
The market is experiencing significant growth due to the increasing demand for advanced sensor network deployment strategies in various industries. Real-time data acquisition protocols are crucial in this context, enabling efficient industrial automation system integration and the development of predictive maintenance algorithms. These algorithms often employ advanced signal processing techniques, such as vibration analysis for predictive maintenance, to ensure data integrity and validate methods of implementation. Safety instrumented system design and verification are essential components of instrumentation services, ensuring system performance and regulatory compliance with safety standards. Process control system optimization techniques are also in high demand, as they enable remote diagnostics and troubleshooting procedures, which are increasingly being implemented through wireless sensor network data security protocols. Calibration standards and uncertainty analysis are integral to instrumentation system lifecycle management strategies, ensuring precision measurement techniques for industrial applications remain accurate and reliable. Data visualization and analysis software tools, along with field service management software solutions, streamline operations and improve overall system performance. Operator training programs and certifications are essential for the effective implementation and maintenance of instrumentation systems. As the market continues to evolve, asset management system implementation best practices and system performance testing and evaluation methods will ensure continued growth and innovation. Regulatory compliance and safety standards remain a top priority, driving the development of new technologies and services in the market.
What are the key market drivers leading to the rise in the adoption of Instrumentation Services Industry?
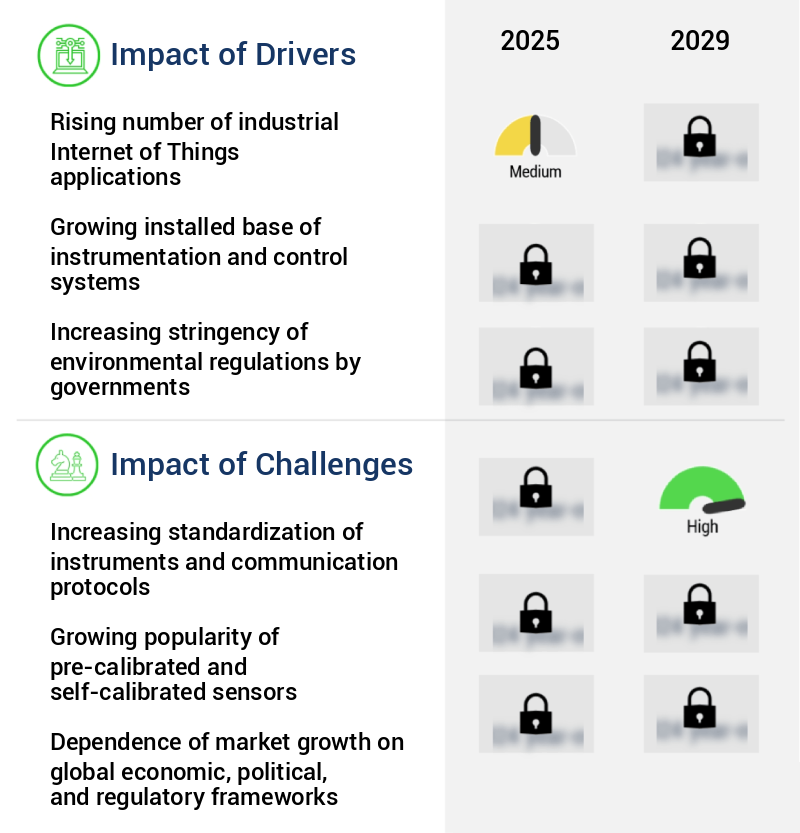
- The surge in industrial Internet of Things applications is the primary catalyst fueling market growth.
- The market in focus experiences significant expansion in the process and discrete manufacturing industries due to technological advancements in cloud computing, big data analytics, and sensor technology. Connected industrial devices generate vast amounts of data, which is utilized for monitoring, recording, analyzing, and gaining valuable insights for efficient decision-making. For example, machinery can autonomously schedule preventive maintenance based on built-in diagnostics, reducing the need for manual machine supervision.
- Similarly, a computer in raw material warehouses can automatically order necessary input materials for production based on interaction with finished goods warehouses and marketing team orders. This data-driven approach enhances productivity and streamlines operations, making it an essential aspect of modern manufacturing processes.
What are the market trends shaping the Instrumentation Services Industry?
- On-site deputation of service personnel is becoming increasingly popular in the current market trend. This practice involves the temporary assignment of personnel to work at a client's location to provide specialized services.
- The escalating pressure to maximize capacity utilization in industrial production facilities drives the necessity for maintaining the accuracy and precision of instrumentation and control systems. This demand results in a heightened focus on frequent calibration, maintenance, and testing of sensors, control valves, and controllers. Consequently, buyers in the market prioritize on-site support from service providers to mitigate potential breakdowns or measurement errors.
- This trend underscores the evolving nature of the market, as industries strive to maintain optimal system performance and minimize production delays. By providing on-site expertise, instrumentation services companies contribute significantly to the overall efficiency and productivity of industrial operations.
What challenges does the Instrumentation Services Industry face during its growth?
- The standardization of instruments and communication protocols is a significant challenge that necessitates mandatory compliance, contributing to potential growth impediments within the industry.
- The instrumentation service market experiences continuous growth as industries prioritize productivity enhancements, necessitating upgrades to existing control systems. However, the use of proprietary systems among companies poses interoperability challenges. To address this issue, industries engage professionals to integrate interoperable equipment and instruments. Open standards adoption is becoming increasingly essential for automation companies, as buyers aim to save time and resources on making disparate equipment compatible.
- Notable industry players, such as ABB and Siemens, have advocated for open standards in process automation for years. This trend underscores the evolving nature of the process and discrete manufacturing industries, where interoperability and standardization are key factors in achieving operational efficiency and cost savings.
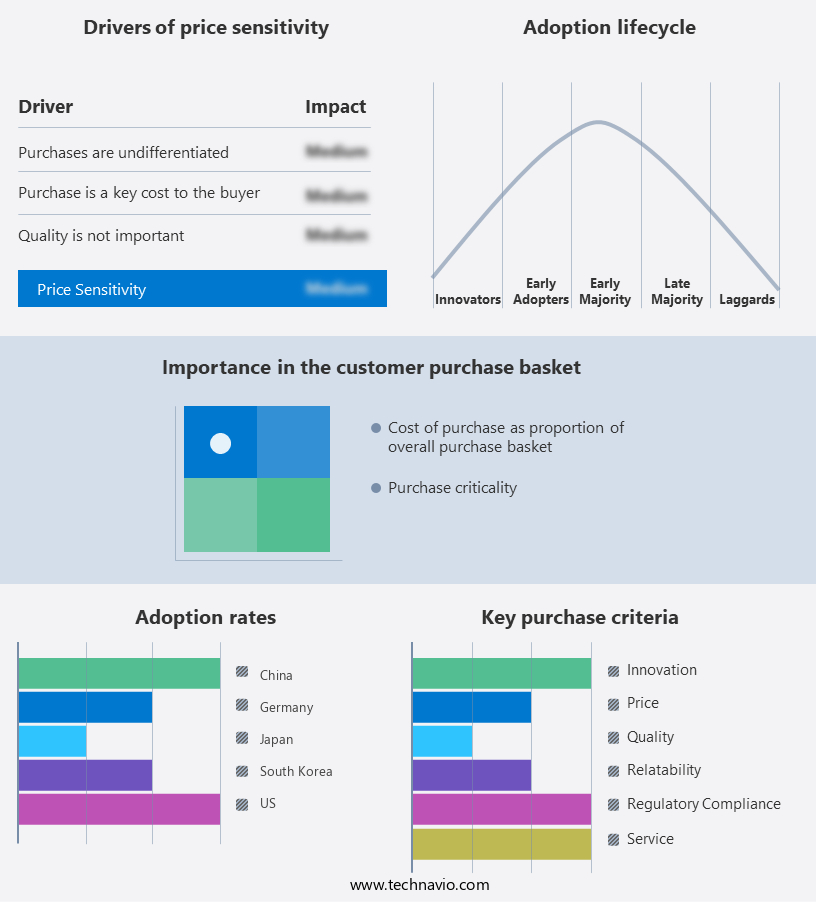
Exclusive Technavio Analysis on Customer Landscape
The instrumentation services market forecasting report includes the adoption lifecycle of the market, covering from the innovator's stage to the laggard's stage. It focuses on adoption rates in different regions based on penetration. Furthermore, the instrumentation services market report also includes key purchase criteria and drivers of price sensitivity to help companies evaluate and develop their market growth analysis strategies.
Customer Landscape of Instrumentation Services Industry
Competitive Landscape
Companies are implementing various strategies, such as strategic alliances, instrumentation services market forecast, partnerships, mergers and acquisitions, geographical expansion, and product/service launches, to enhance their presence in the industry.
ABB Ltd. - The company specializes in providing advanced instrumentation services, encompassing instrumentation and control systems for the automation and process industries.
The industry research and growth report includes detailed analyses of the competitive landscape of the market and information about key companies, including:
- ABB Ltd.
- Agilent Technologies Inc.
- Alco Valves Group
- Branom Instrument Co.
- Charnwood Instrumentation Services Ltd.
- Emerson Electric Co.
- Endress Hauser Group Services AG
- Honeywell International Inc.
- KROHNE Messtechnik GmbH
- Larsen and Toubro Ltd.
- Marsh Instrumentation Ltd.
- Miraj Instrumentation Services I Pvt. Ltd.
- Parker Hannifin Corp.
- Rockwell Automation Inc.
- Schneider Electric SE
- Siemens AG
- Swagelok Co.
- Trescal International SAS
- Utilities Instrumentation Service Inc.
- Yokogawa Electric Corp.
Qualitative and quantitative analysis of companies has been conducted to help clients understand the wider business environment as well as the strengths and weaknesses of key industry players. Data is qualitatively analyzed to categorize companies as pure play, category-focused, industry-focused, and diversified; it is quantitatively analyzed to categorize companies as dominant, leading, strong, tentative, and weak.
Recent Development and News in Instrumentation Services Market
- In January 2024, Honeywell International Inc. announced the launch of its new advanced process control solution, Uniformance PHD Version 10.0, designed to optimize industrial processes and enhance efficiency for various industries. This innovative offering was unveiled at the 2024 American Chemical Society (ACS) Process Safety Conference (Source: Honeywell Press Release).
- In March 2024, Emerson Electric Co. and ABB signed a strategic collaboration agreement to integrate Emerson's Rosemount Analytical gas analysis instruments with ABB's Ability™ System 800xA distributed control system. This partnership aimed to deliver improved process safety, reliability, and operational efficiency to the oil, gas, and petrochemical industries (Source: Emerson Electric Co. Press Release).
- In May 2024, Endress+Hauser, a leading instrumentation company, acquired Sensicor GmbH, a German manufacturer of gas sensors for industrial applications. The acquisition expanded Endress+Hauser's portfolio in gas analysis and strengthened its position in the process automation market (Source: Endress+Hauser Press Release).
- In April 2025, Siemens Energy AG received approval from the European Commission for its acquisition of Sensirion AG, a Swiss sensor manufacturer. This acquisition enabled Siemens Energy to expand its portfolio in the field of sensor technology and strengthen its position in the energy sector (Source: Siemens Energy AG Press Release).
Dive into Technavio's robust research methodology, blending expert interviews, extensive data synthesis, and validated models for unparalleled Instrumentation Services Market insights. See full methodology.
|
Market Scope |
|
|
Report Coverage |
Details |
|
Page number |
228 |
|
Base year |
2024 |
|
Historic period |
2019-2023 |
|
Forecast period |
2025-2029 |
|
Growth momentum & CAGR |
Accelerate at a CAGR of 5.7% |
|
Market growth 2025-2029 |
USD 1964.4 million |
|
Market structure |
Fragmented |
|
YoY growth 2024-2025(%) |
5.1 |
|
Key countries |
US, China, Germany, Canada, UK, Japan, India, France, Brazil, and South Korea |
|
Competitive landscape |
Leading Companies, Market Positioning of Companies, Competitive Strategies, and Industry Risks |
Research Analyst Overview
- The market continues to evolve, driven by the increasing demand for data integrity validation and predictive maintenance in various sectors. Sensor networks and data logging software play a crucial role in this dynamic landscape, enabling real-time data analysis and performance testing. Safety instrumented systems, which incorporate temperature sensors and pressure transducers, are essential for ensuring safety and regulatory compliance in industries. For instance, a leading oil and gas company reported a 15% increase in operational efficiency by implementing a wireless instrumentation system for remote monitoring and asset management. This solution facilitated sensor calibration, system validation, and field service management, resulting in improved system integration and troubleshooting capabilities.
- Industry growth is expected to reach double-digit percentages in the coming years, fueled by the adoption of advanced technologies such as predictive maintenance, signal processing techniques, and precision measurement. Data security protocols and calibration certificates are also becoming increasingly important, as quality control metrics and performance expectations rise. Instrument lifecycle management, vibration measurement, and process control systems are other key areas of focus, as organizations seek to optimize their instrumentation strategies and minimize downtime. System integration services and instrument maintenance are also critical components of this evolving market, with remote diagnostics and troubleshooting techniques playing a pivotal role in ensuring optimal performance.
- Overall, the market is characterized by continuous innovation and adaptation, as organizations seek to maximize efficiency, ensure safety, and maintain regulatory compliance in their operations.
What are the Key Data Covered in this Instrumentation Services Market Research and Growth Report?
-
What is the expected growth of the Instrumentation Services Market between 2025 and 2029?
-
USD 1.96 billion, at a CAGR of 5.7%
-
-
What segmentation does the market report cover?
-
The report is segmented by Service (Calibration, Maintenance and repair, and Commissioning and testing), End-user (Process industries and Discrete industries), Application (Laboratory analysis, Environmental monitoring, Process control, Material testing, and Others), and Geography (North America, APAC, Europe, Middle East and Africa, and South America)
-
-
Which regions are analyzed in the report?
-
North America, APAC, Europe, Middle East and Africa, and South America
-
-
What are the key growth drivers and market challenges?
-
Rising number of industrial Internet of Things applications, Increasing standardization of instruments and communication protocols
-
-
Who are the major players in the Instrumentation Services Market?
-
ABB Ltd., Agilent Technologies Inc., Alco Valves Group, Branom Instrument Co., Charnwood Instrumentation Services Ltd., Emerson Electric Co., Endress Hauser Group Services AG, Honeywell International Inc., KROHNE Messtechnik GmbH, Larsen and Toubro Ltd., Marsh Instrumentation Ltd., Miraj Instrumentation Services I Pvt. Ltd., Parker Hannifin Corp., Rockwell Automation Inc., Schneider Electric SE, Siemens AG, Swagelok Co., Trescal International SAS, Utilities Instrumentation Service Inc., and Yokogawa Electric Corp.
-
Market Research Insights
- The market for instrumentation services is a dynamic and ever-evolving landscape, encompassing a range of offerings from calibration procedures and compliance standards to data transmission and quality assurance. Two key aspects of this market are the integration of advanced hardware components and the implementation of data analysis methods. For instance, the adoption of signal conditioning techniques has led to a significant increase in system performance, resulting in a 20% improvement in data accuracy for numerous applications.
- Furthermore, industry experts anticipate a growth rate of approximately 5% annually over the next decade, driven by the demand for system upgrades, network topology optimization, and process monitoring.
We can help! Our analysts can customize this instrumentation services market research report to meet your requirements.
 RIA -
RIA - 
