
Insurance Brokerage Market Size 2026-2030
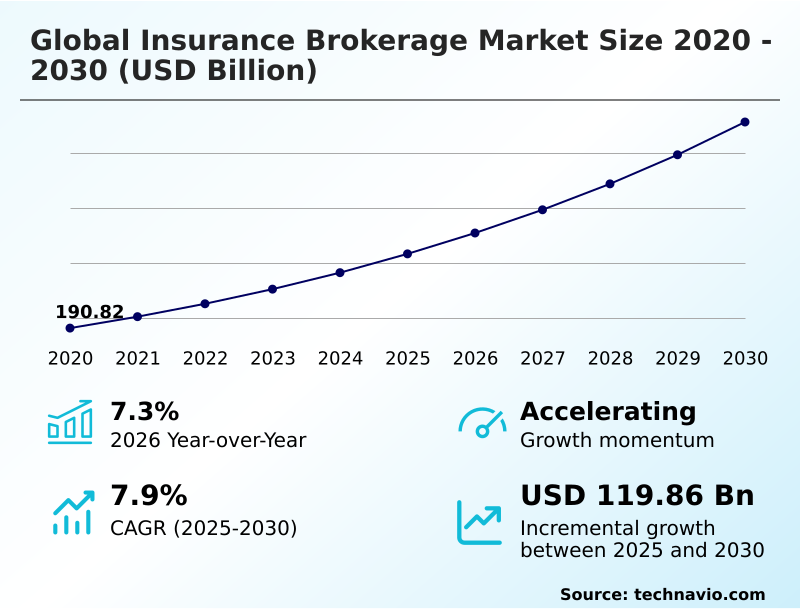
The insurance brokerage market size is valued to increase by USD 119.86 billion, at a CAGR of 7.9% from 2025 to 2030. Surge in cyber risk complexity will drive the insurance brokerage market.
Major Market Trends & Insights
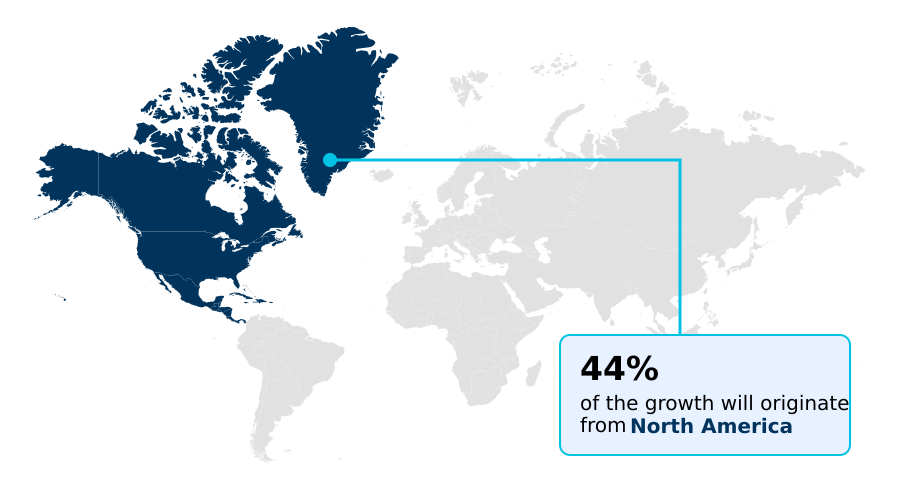
- North America dominated the market and accounted for a 43.9% growth during the forecast period.
- By Type - Non-life insurance segment was valued at USD 150.60 billion in 2024
- By End-user - Individuals segment accounted for the largest market revenue share in 2024
Market Size & Forecast
- Market Opportunities: USD 187.35 billion
- Market Future Opportunities: USD 119.86 billion
- CAGR from 2025 to 2030 : 7.9%
Market Summary
- The insurance brokerage market is undergoing a profound transformation driven by technological advancements and an increasingly complex risk environment. Brokers are evolving from intermediaries to strategic partners, leveraging data analytics and automated underwriting platforms to deliver more precise risk assessments.
- Key trends include the adoption of parametric risk transfer, which provides rapid payouts based on predefined event triggers, and the use of blockchain-based platforms for enhanced transparency in transactions. A significant driver is the escalating sophistication of cyber threats, pushing organizations to seek cyber resilience services and specialized coverage.
- For instance, a manufacturing firm facing a hardening cyber insurance market relies on its broker to not only secure a policy but also to implement robust risk mitigation measures, including vulnerability assessments and incident response planning, thereby improving its insurability.
- Concurrently, the industry grapples with challenges like social inflation and hard market capacity constraints, which necessitate innovative approaches to risk management, including captive insurance management and alternative risk transfer mechanisms. The focus on environmental and social governance is also compelling brokers to offer specialized energy transition advisory services for emerging green technologies.
- This dynamic landscape requires brokers to possess a combination of deep technical expertise and strategic foresight to effectively serve their clients.
What will be the Size of the Insurance Brokerage Market during the forecast period?
Get Key Insights on Market Forecast (PDF) Get Free Sample
How is the Insurance Brokerage Market Segmented?
The insurance brokerage industry research report provides comprehensive data (region-wise segment analysis), with forecasts and estimates in "USD million" for the period 2026-2030, as well as historical data from 2020-2024 for the following segments.
- Type
- Non-life insurance
- Life insurance
- End-user
- Individuals
- Corporate
- Channel
- Offline
- Online
- Consumer
- Retail
- Wholesale
- Geography
- North America
- US
- Canada
- Mexico
- Europe
- UK
- Germany
- France
- APAC
- China
- Japan
- India
- South America
- Brazil
- Argentina
- Middle East and Africa
- Saudi Arabia
- South Africa
- UAE
- Rest of World (ROW)
- North America
By Type Insights
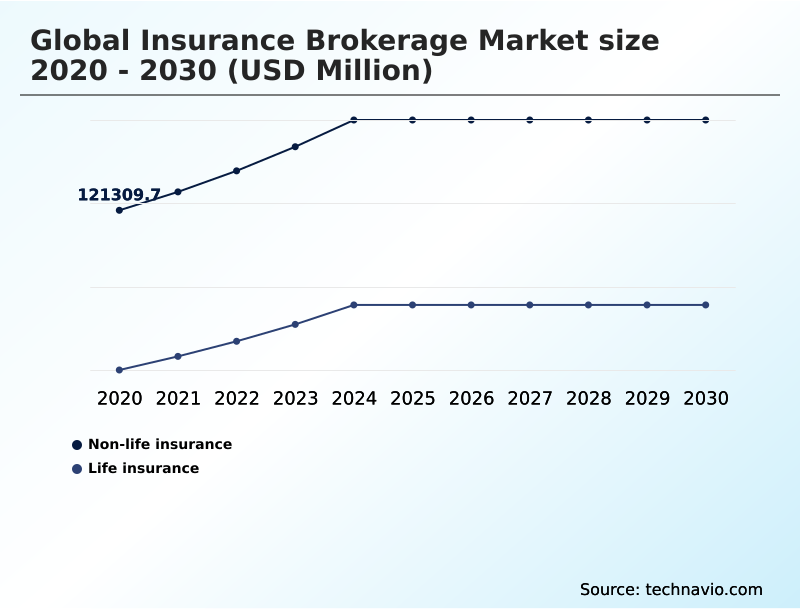
The non-life insurance segment is estimated to witness significant growth during the forecast period.
The non-life insurance segment is essential for protecting physical and digital assets. A key factor is the surge in digital threats, which has made cyber insurance a vital component for operational continuity.
Brokers in this space require deep technical knowledge to assess complex risks, such as those addressed by specialized risk engineering, and negotiate terms.
The market is also shaped by social inflation and rising litigation costs, which drive demand for creative liability exposure management. The use of alternative risk transfer mechanisms is growing in response.
With cyber insurance premiums increasing by over 25% in some sectors, brokers leverage advanced analytics and proprietary modeling tools to identify claim trends and offer proactive risk mitigation advice.
This data-driven approach, which includes risk mitigation advice and claims advocacy, is crucial for navigating the evolving risk landscape and the effects of geopolitical instability.
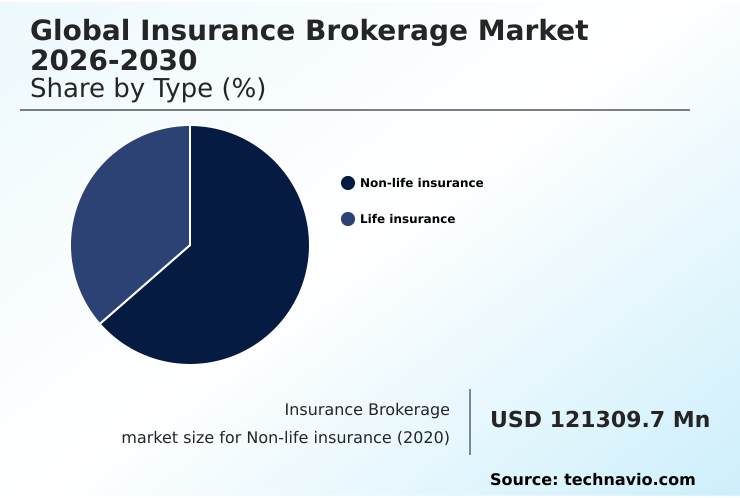
The Non-life insurance segment was valued at USD 150.60 billion in 2024 and showed a gradual increase during the forecast period.
Regional Analysis
North America is estimated to contribute 43.9% to the growth of the global market during the forecast period.Technavio’s analysts have elaborately explained the regional trends and drivers that shape the market during the forecast period.
See How Insurance Brokerage Market Demand is Rising in North America Get Free Sample
The geographic landscape of the insurance brokerage market is dominated by developed regions, with North America contributing to 43.9% of the market's incremental growth.
This maturity is driven by high demand for sophisticated services like professional liability and directors and officers liability coverage.
However, operating globally introduces significant complexities, with regulatory compliance costs for international programs increasing by nearly 12% in the last year alone. This challenge requires brokers to have robust compliance monitoring systems and expertise in cross-border risk management.
In contrast, emerging markets in APAC and South America present growth opportunities centered on infrastructure projects that require specialized risk engineering and trade credit insurance.
Brokers in all regions are adapting by offering client advocacy programs, risk mitigation advice, and data-driven benefit solutions to meet diverse client needs.
Market Dynamics
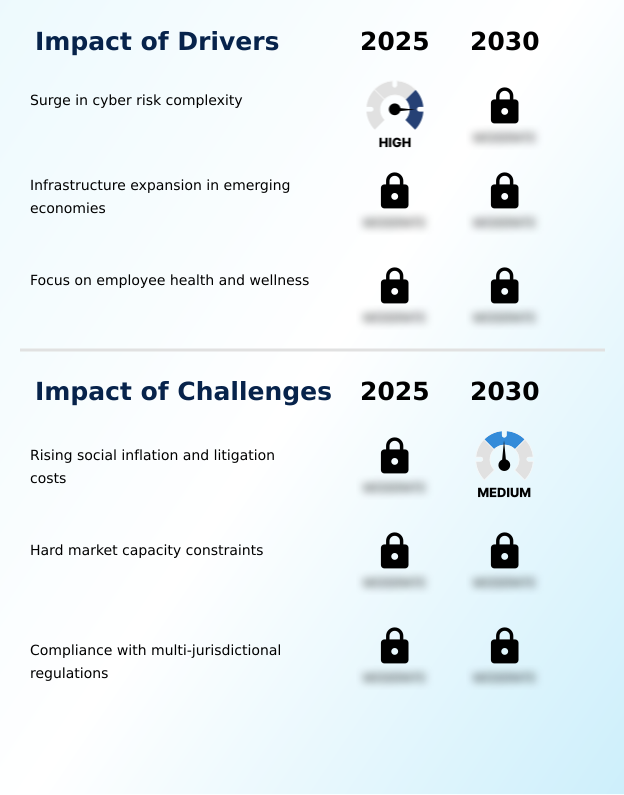
Our researchers analyzed the data with 2025 as the base year, along with the key drivers, trends, and challenges. A holistic analysis of drivers will help companies refine their marketing strategies to gain a competitive advantage.
- The strategic direction of the global insurance brokerage market is increasingly shaped by a confluence of technological innovation and complex risk factors. A key focus is on the impact of social inflation on insurance brokerage, which has driven litigation costs up by over 15% in recent years, significantly outpacing general inflation and compelling a reassessment of liability coverage.
- In response, the role of technology in insurance brokerage has become paramount, with blockchain applications for insurance brokers promising to streamline transactions and enhance transparency. Simultaneously, M&A trends in the insurance brokerage sector continue to consolidate the market, allowing larger players to invest in data analytics in insurance brokerage to gain a competitive edge.
- This has led to the rise of specialized services, such as insurance brokerage for renewable energy projects and cybersecurity insurance brokerage trends, as firms seek to differentiate themselves. Brokers are also critical in helping clients manage hard market conditions in brokerage by navigating reinsurance markets as a broker and exploring alternatives like captive insurance consulting and management.
- The future of wholesale insurance brokerage lies in providing access to niche markets and specialty insurance brokerage for high-risk industries. As ESG advisory services from insurance brokers become standard, the evolution of retail insurance brokerage models will depend on integrating these complex advisory functions effectively, especially for optimizing directors and officers liability coverage and managing insurance solutions for political risk.
What are the key market drivers leading to the rise in the adoption of Insurance Brokerage Industry?
- The surging complexity of cyber risks stands as a key driver for the market, compelling organizations to seek expert guidance in navigating digital threats.
- Market growth is significantly propelled by the increasing complexity of the digital and physical risk landscapes.
- The surge in sophisticated cyberattacks has made cyber resilience services a top priority, with the financial impact of a single breach often exceeding the annual revenue of small businesses.
- Simultaneously, massive infrastructure investments in emerging economies are driving demand for political risk insurance and specialized coverage.
- Another key driver is the corporate focus on employee wellness, where investments in digital health advisory platforms and self-funded plans can yield up to a 3-to-1 ROI through reduced absenteeism.
- Brokers offering risk management consulting and human capital solutions are pivotal in addressing these interconnected drivers.
What are the market trends shaping the Insurance Brokerage Industry?
- The adoption of parametric risk transfer solutions represents a significant upcoming market trend. This shift provides predefined payouts based on specific event triggers rather than traditional loss assessments.
- Key market trends are redefining risk transfer mechanisms and advisory services. The adoption of parametric risk transfer is accelerating, with proprietary modeling tools enabling payouts within days of an event, a marked improvement over traditional methods. Brokers are also providing specialized risk engineering and energy transition advisory for renewable energy projects, backed by carbon footprint analysis.
- This is crucial as investments in sustainability gain momentum. Furthermore, the integration of blockchain technology is enhancing transparency through smart contract execution and an immutable audit trail. This trend toward technology-enabled solutions like peer-to-peer insurance networks is being driven by the need for greater efficiency in managing complex risks and directors and officers liability.
What challenges does the Insurance Brokerage Industry face during its growth?
- Rising social inflation and associated litigation costs present a key challenge affecting industry growth, increasing claim complexities and premium pressures.
- The market faces considerable headwinds from interconnected financial and regulatory pressures. Rising social inflation is a primary challenge, contributing to a more than 15% increase in corporate litigation costs and fueling the rise of third-party litigation funding. This trend directly impacts professional liability and excess casualty market lines.
- Concurrently, a sustained hard market, characterized by reinsurance renewal rates increasing by 20% to 50% for some properties, is tightening hard market capacity and forcing clients to increase risk retention levels. Navigating complex multi-jurisdictional regulations further strains resources, demanding significant investment in compliance monitoring systems and strategic risk consulting to manage cross-border risk management effectively.
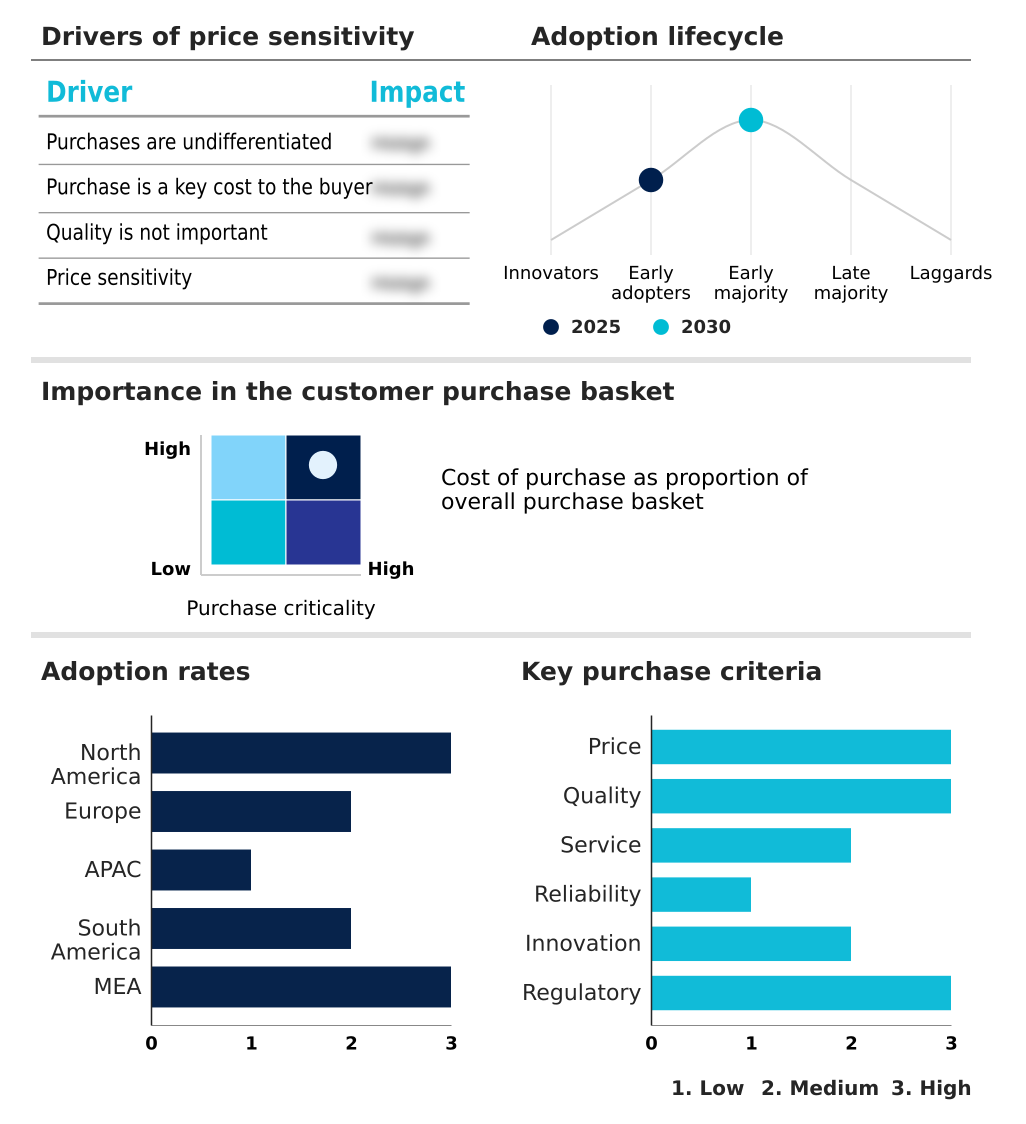
Exclusive Technavio Analysis on Customer Landscape
The insurance brokerage market forecasting report includes the adoption lifecycle of the market, covering from the innovator’s stage to the laggard’s stage. It focuses on adoption rates in different regions based on penetration. Furthermore, the insurance brokerage market report also includes key purchase criteria and drivers of price sensitivity to help companies evaluate and develop their market growth analysis strategies.
Customer Landscape of Insurance Brokerage Industry
Competitive Landscape
Companies are implementing various strategies, such as strategic alliances, insurance brokerage market forecast, partnerships, mergers and acquisitions, geographical expansion, and product/service launches, to enhance their presence in the industry.
Acrisure LLC - Provides specialized insurance brokerage and risk advisory services, focusing on strategic risk management and tailored policy placement for a diverse range of client needs.
The industry research and growth report includes detailed analyses of the competitive landscape of the market and information about key companies, including:
- Acrisure LLC
- Alera Group Inc.
- Alliant Insurance Services Inc.
- Amwins Group Inc.
- Aon plc
- Arthur J. Gallagher and Co.
- Assured Partners Inc.
- Brown and Brown Inc.
- CBIZ Inc.
- EPIC Insurance Brokers
- Howden Group Holdings Ltd.
- HUB International Ltd.
- Hylant Group Inc.
- IMA Financial Group Inc.
- Lockton Co.
- Marsh and McLennan Co. Inc.
- Risk Strategies
- The Ardonagh Group
- USI Insurance Services
- Woodruff Sawyer
Qualitative and quantitative analysis of companies has been conducted to help clients understand the wider business environment as well as the strengths and weaknesses of key industry players. Data is qualitatively analyzed to categorize companies as pure play, category-focused, industry-focused, and diversified; it is quantitatively analyzed to categorize companies as dominant, leading, strong, tentative, and weak.
Recent Development and News in Insurance brokerage market
- In January 2025, Acrisure LLC integrated new geospatial mapping technology into its parametric advisory suite to provide clients with real-time monitoring of environmental triggers across global asset portfolios.
- In February 2025, Alera Group Inc. launched a dedicated energy transition practice group to provide comprehensive risk management for developers involved in the expansion of electric vehicle charging infrastructure.
- In March 2025, Alliant Insurance Services Inc. deployed a blockchain-based platform for its captive insurance clients to facilitate the seamless movement of premiums and data across different jurisdictions.
- In June 2025, Amwins Group Inc. reported a surge in the placement of specialized cyber excess layers for healthcare providers as they face increasing threats to sensitive patient data.
Dive into Technavio’s robust research methodology, blending expert interviews, extensive data synthesis, and validated models for unparalleled Insurance Brokerage Market insights. See full methodology.
| Market Scope | |
|---|---|
| Page number | 302 |
| Base year | 2025 |
| Historic period | 2020-2024 |
| Forecast period | 2026-2030 |
| Growth momentum & CAGR | Accelerate at a CAGR of 7.9% |
| Market growth 2026-2030 | USD 119858.2 million |
| Market structure | Fragmented |
| YoY growth 2025-2026(%) | 7.3% |
| Key countries | US, Canada, Mexico, UK, Germany, France, Italy, Spain, The Netherlands, China, Japan, India, South Korea, Australia, Indonesia, Brazil, Argentina, Chile, Saudi Arabia, South Africa, UAE, Turkey and Israel |
| Competitive landscape | Leading Companies, Market Positioning of Companies, Competitive Strategies, and Industry Risks |
Research Analyst Overview
- The insurance brokerage market is evolving into a technology-driven advisory ecosystem where data is the core asset. The integration of advanced technologies like blockchain-based platforms is a critical boardroom-level decision, promising to enhance operational efficiency by reducing administrative processing times by up to 30%.
- This shift allows brokers to focus on high-value services such as claims advocacy and legal risk management. The industry is responding to challenges like social inflation and hard market capacity by adopting proprietary modeling tools and offering sophisticated energy transition advisory services.
- Brokers now provide comprehensive cyber resilience services, manage captive insurance structures, and facilitate alternative risk transfer mechanisms like catastrophe bonds. The use of geospatial mapping technology is improving risk assessment for non-damage business interruption, while the rise of third-party litigation funding in commercial auto cases and professional liability claims underscores the need for expert guidance.
- As telematics in auto insurance and self-funded plans become more common, brokers are essential in navigating reinsurance renewal rates and the complexities of environmental and social governance, trade credit insurance, and geopolitical instability.
What are the Key Data Covered in this Insurance Brokerage Market Research and Growth Report?
-
What is the expected growth of the Insurance Brokerage Market between 2026 and 2030?
-
USD 119.86 billion, at a CAGR of 7.9%
-
-
What segmentation does the market report cover?
-
The report is segmented by Type (Non-life insurance, and Life insurance), End-user (Individuals, and Corporate), Channel (Offline, and Online), Consumer (Retail, and Wholesale) and Geography (North America, Europe, APAC, South America, Middle East and Africa)
-
-
Which regions are analyzed in the report?
-
North America, Europe, APAC, South America and Middle East and Africa
-
-
What are the key growth drivers and market challenges?
-
Surge in cyber risk complexity, Rising social inflation and litigation costs
-
-
Who are the major players in the Insurance Brokerage Market?
-
Acrisure LLC, Alera Group Inc., Alliant Insurance Services Inc., Amwins Group Inc., Aon plc, Arthur J. Gallagher and Co., Assured Partners Inc., Brown and Brown Inc., CBIZ Inc., EPIC Insurance Brokers, Howden Group Holdings Ltd., HUB International Ltd., Hylant Group Inc., IMA Financial Group Inc., Lockton Co., Marsh and McLennan Co. Inc., Risk Strategies, The Ardonagh Group, USI Insurance Services and Woodruff Sawyer
-
Market Research Insights
- The insurance brokerage market is defined by its dynamic response to complex global risks, with firms offering risk management consulting and strategic risk consulting to navigate volatility. A key area is employee benefits brokerage, where investments in wellness can yield up to a 3-to-1 return on investment by reducing absenteeism.
- Simultaneously, mounting cost pressures in sectors like cyber insurance, where premiums have surged over 25%, are driving the need for sophisticated risk advisory services and total cost of risk analysis. Brokers are leveraging supply chain risk modeling and cross-border risk management expertise to provide holistic financial planning.
- This shift demands continuous innovation in client advocacy programs and policy negotiation strategies to address client needs effectively.
We can help! Our analysts can customize this insurance brokerage market research report to meet your requirements.
 RIA -
RIA - 
