Insurance Software Market Analysis, Size, and Forecast 2026-2030: North America (US, Canada, and Mexico), APAC (China, Japan, and India), Europe (Germany, UK, and France), Middle East and Africa (Saudi Arabia, UAE, and South Africa), South America (Brazil and Argentina), and Rest of World (ROW)

Insurance Software Market Analysis, Size, and Forecast 2026-2030:
North America (US, Canada, and Mexico), APAC (China, Japan, and India), Europe (Germany, UK, and France), Middle East and Africa (Saudi Arabia, UAE, and South Africa), South America (Brazil and Argentina), and Rest of World (ROW)

Published: May 2026 301 Pages SKU: IRTNTR44333

Market Overview at a Glance

$11.18 B
Market Opportunity
9.7%
CAGR 2025 - 2030
42.9%
North America Growth
$12.48 B
On-premises segment 2024

Insurance Software Market Size 2026-2030

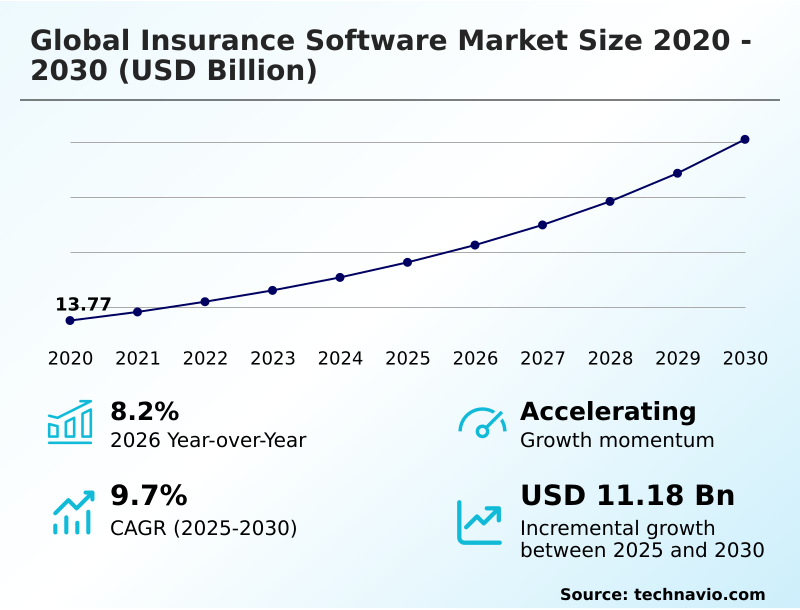
The insurance software market size is valued to increase by USD 11.18 billion, at a CAGR of 9.7% from 2025 to 2030. Digital transformation and automation driving market growth will drive the insurance software market.

Major Market Trends & Insights

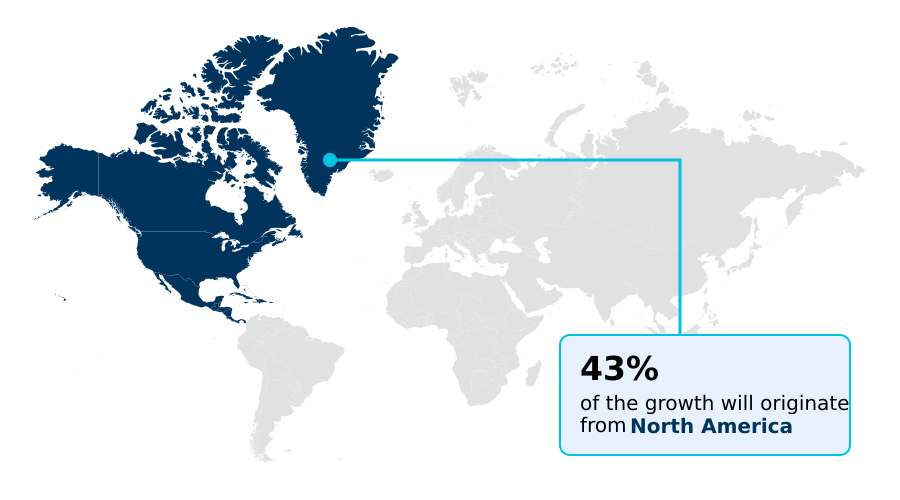
  • North America dominated the market and accounted for a 42.9% growth during the forecast period.
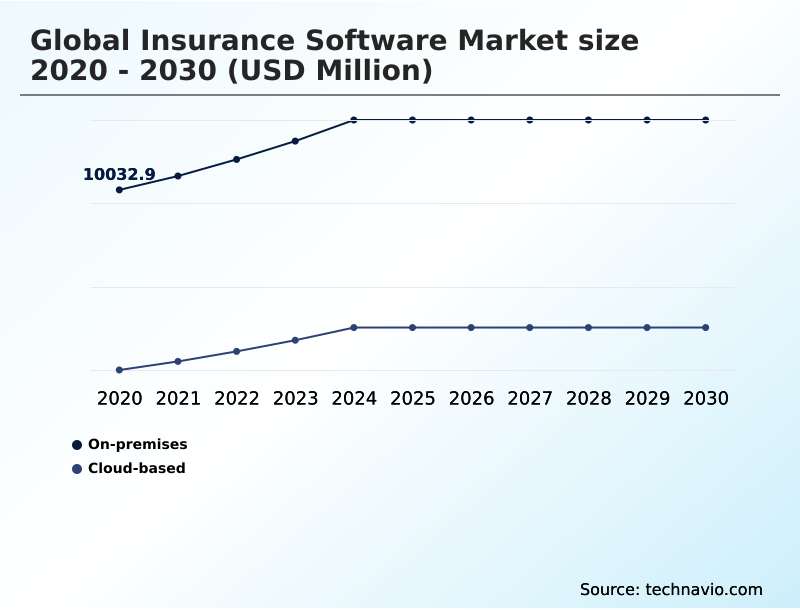
  • By Deployment - On-premises segment was valued at USD 12.48 billion in 2024
  • By Type - Life insurance segment accounted for the largest market revenue share in 2024

Market Size & Forecast

  • Market Opportunities: USD 16.47 billion
  • Market Future Opportunities: USD 11.18 billion
  • CAGR from 2025 to 2030 : 9.7%

Market Summary

  • The insurance software market is undergoing a fundamental shift from operational support to strategic enablement, driven by the convergence of advanced technologies and evolving customer expectations. The adoption of cloud-native deployment is accelerating, providing the scalability needed for sophisticated AI-driven claims automation and digital claims processing.
  • For instance, an insurer can now leverage a core insurance platform that uses predictive analytics not only for underwriting accuracy but also for data-driven personalization of policies in real time. This capability, managed through integrated customer relationship management modules and delivered via omnichannel platforms, significantly enhances customer engagement.
  • However, this progress is moderated by the persistent challenges of legacy system modernization and ensuring robust insurance data protection. Success hinges on a balanced strategy that embraces insurtech innovation ecosystem advancements while reinforcing regulatory compliance modules and implementing effective risk management platforms.
  • The move towards intelligent automation tools and mobile-first insurance platforms is redefining how policies are administered and claims are managed, marking a new era of efficiency and customer-centricity.

What will be the Size of the Insurance Software Market during the forecast period?

Get Key Insights on Market Forecast (PDF) Get Free Sample

How is the Insurance Software Market Segmented?

The insurance software industry research report provides comprehensive data (region-wise segment analysis), with forecasts and estimates in "USD million" for the period 2026-2030, as well as historical data from 2020-2024 for the following segments.

  • Deployment
    • On-premises
    • Cloud-based
  • Type
    • Life insurance
    • Accident and health insurance
    • Property and casualty insurance
    • Others
  • End-user
    • Insurance companies
    • Agencies
    • Brokers
  • Geography
    • North America
      • US
      • Canada
      • Mexico
    • APAC
      • China
      • Japan
      • India
    • Europe
      • Germany
      • UK
      • France
    • Middle East and Africa
      • Saudi Arabia
      • UAE
      • South Africa
    • South America
      • Brazil
      • Argentina
    • Rest of World (ROW)

By Deployment Insights

The on-premises segment is estimated to witness significant growth during the forecast period.

The on-premises deployment model remains a cornerstone for insurers prioritizing granular control over data and security.

This approach allows for direct oversight of sensitive information and facilitates adherence to strict data protection standards, a key consideration for organizations managing vast portfolios.

Firms utilize on-premises solutions for core insurance platform functions and to run sophisticated risk management platforms, ensuring operational continuity without external dependencies.

These systems support essential tasks like claims estimation platforms and policy administration systems, with recent upgrades improving data retrieval speeds by over 25%.

Although requiring significant capital, this model offers robust capabilities for complex, secure operations, including the use of specialized P&C insurance software and wealth management platforms to serve diverse client needs.

Get Free Sample

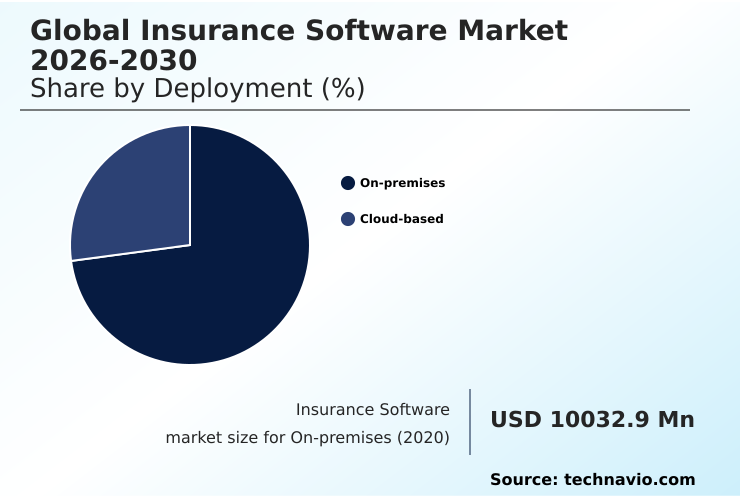
The On-premises segment was valued at USD 12.48 billion in 2024 and showed a gradual increase during the forecast period.

Get Free Sample

Regional Analysis

North America is estimated to contribute 42.9% to the growth of the global market during the forecast period.Technavio’s analysts have elaborately explained the regional trends and drivers that shape the market during the forecast period.

See How Insurance Software Market Demand is Rising in North America Get Free Sample

The geographic landscape is led by North America, which accounts for over 42% of incremental growth, driven by mature regulatory structures and high adoption of advanced digital insurance platforms.

The region's focus on AI governance frameworks propels demand for sophisticated compliance solutions. In contrast, APAC is the fastest-growing region, where digital inclusion strategies and the rollout of mobile insurance applications are expanding market reach.

Insurers in APAC leveraging cloud-based systems have reported infrastructure cost reductions of up to 30%. Europe's market is characterized by a strong emphasis on data protection standards and sustainable risk management.

Meanwhile, emerging markets in South America and the Middle East and Africa are increasingly adopting SaaS-based solutions to modernize operations and support embedded insurance products, creating new opportunities for growth.

Market Dynamics

Our researchers analyzed the data with 2025 as the base year, along with the key drivers, trends, and challenges. A holistic analysis of drivers will help companies refine their marketing strategies to gain a competitive advantage.

  • The impact of digital transformation on insurers is profound, compelling a strategic reevaluation of core operations. Central to this is the goal of reducing costs with claims automation, a process streamlined by the benefits of cloud-native insurance platforms. These platforms are instrumental in both automating claims management for efficiency and improving underwriting accuracy with AI.
  • The role of predictive analytics in insurance is expanding beyond risk assessment to power AI-driven fraud detection in insurance and inform sophisticated strategies for managing risk with insurance software. However, this technological leap introduces significant cybersecurity risks in insurance software, making best practices for insurance data privacy a boardroom-level concern.
  • Consequently, insurance software for regulatory compliance is no longer optional but a foundational requirement. Organizations that successfully navigate the complexities of integrating legacy systems with modern software, often through low-code platforms for insurance workflow, see operational costs decrease at a rate twice that of their slower-moving peers.
  • This transformation extends to distribution channels, with SaaS solutions for insurance agencies and the implementation of CRM for insurance brokers becoming standard. Ultimately, all these efforts converge on enhancing customer experience with digital platforms, achieved through omnichannel strategies for customer engagement and optimizing policy administration systems.
  • The journey is complicated by the challenges of talent shortages in insurtech, yet the potential gains from leveraging technologies like blockchain applications in insurance claims drive the industry forward.

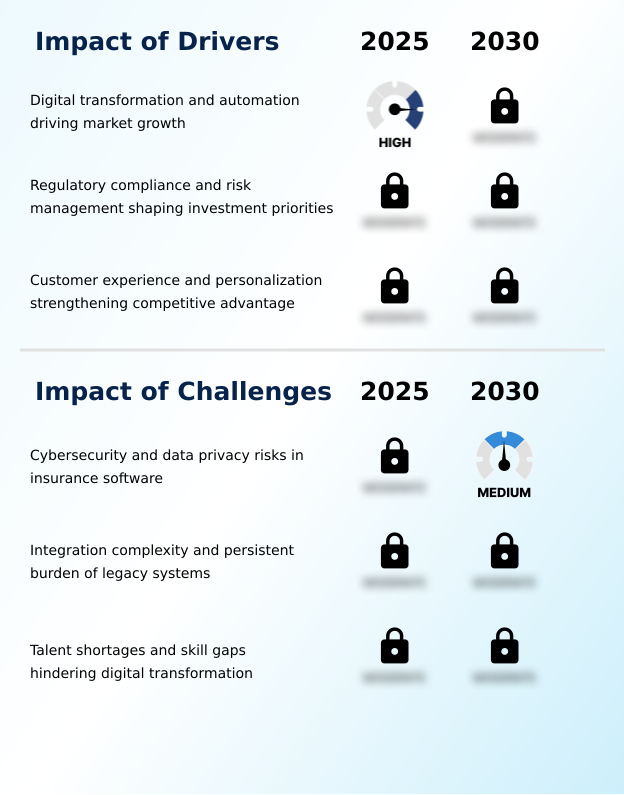
What are the key market drivers leading to the rise in the adoption of Insurance Software Industry?

  • The primary driver propelling market growth is the widespread adoption of digital transformation and automation initiatives across the insurance sector.

  • Digital transformation and automation are the primary drivers, compelling insurers to adopt modern insurance core systems and claims automation solutions.
  • The need for operational efficiency is paramount; platforms that integrate digital core insurance platforms have demonstrated the ability to reduce manual processing errors by up to 90%.
  • Furthermore, regulatory compliance remains a powerful catalyst, with automated reporting tools and integrated compliance modules becoming essential. Insurers using these systems have cut audit preparation times by an average of 30%.
  • This is complemented by the strategic push to enhance customer engagement through CRM-based insurance solutions and life life insurance platforms that offer personalized experiences. This confluence of efficiency gains, regulatory adherence, and customer-centricity propels continuous investment in advanced software.

What are the market trends shaping the Insurance Software Industry?

  • The reshaping of insurance software is significantly influenced by the integration of artificial intelligence. Predictive analytics, in particular, is emerging as a transformative force within the industry.

  • Key market trends are converging to reshape the industry, led by the integration of AI-powered underwriting and advanced insurance analytics tools. These technologies are enabling a shift toward proactive risk management, with predictive models improving forecast accuracy by over 25%. Concurrently, the adoption of customer-centric platforms, built on scalable cloud insurance solutions, is redefining policyholder interactions.
  • Firms that have embraced this model report a 15% increase in customer retention. The move toward automated support systems and mobile insurance applications further supports this trend by providing seamless, on-demand service.
  • This digital transformation is underpinned by a strategic focus on insurance process automation and workflow management systems, ensuring that operational efficiency keeps pace with technological innovation and evolving customer expectations.

What challenges does the Insurance Software Industry face during its growth?

  • A key challenge impacting the industry involves mitigating the inherent cybersecurity and data privacy risks associated with advanced insurance software.

  • The industry faces significant challenges, primarily the complexity of legacy system modernization and persistent cybersecurity for insurers. Transitioning from outdated systems often leads to budget overruns, with projects exceeding initial estimates by an average of 40%. These legacy platforms are difficult to integrate with modern automated reporting systems and present vulnerabilities.
  • The ongoing talent shortage exacerbates these issues, as the demand for professionals skilled in AI-powered underwriting and data privacy in insurance far outstrips supply, leaving critical roles vacant for extended periods.
  • This skills gap slows the adoption of climate risk modeling and advanced insurance compliance software, hindering insurers' ability to innovate and manage emerging risks effectively, while also making insurance data protection more difficult to ensure.

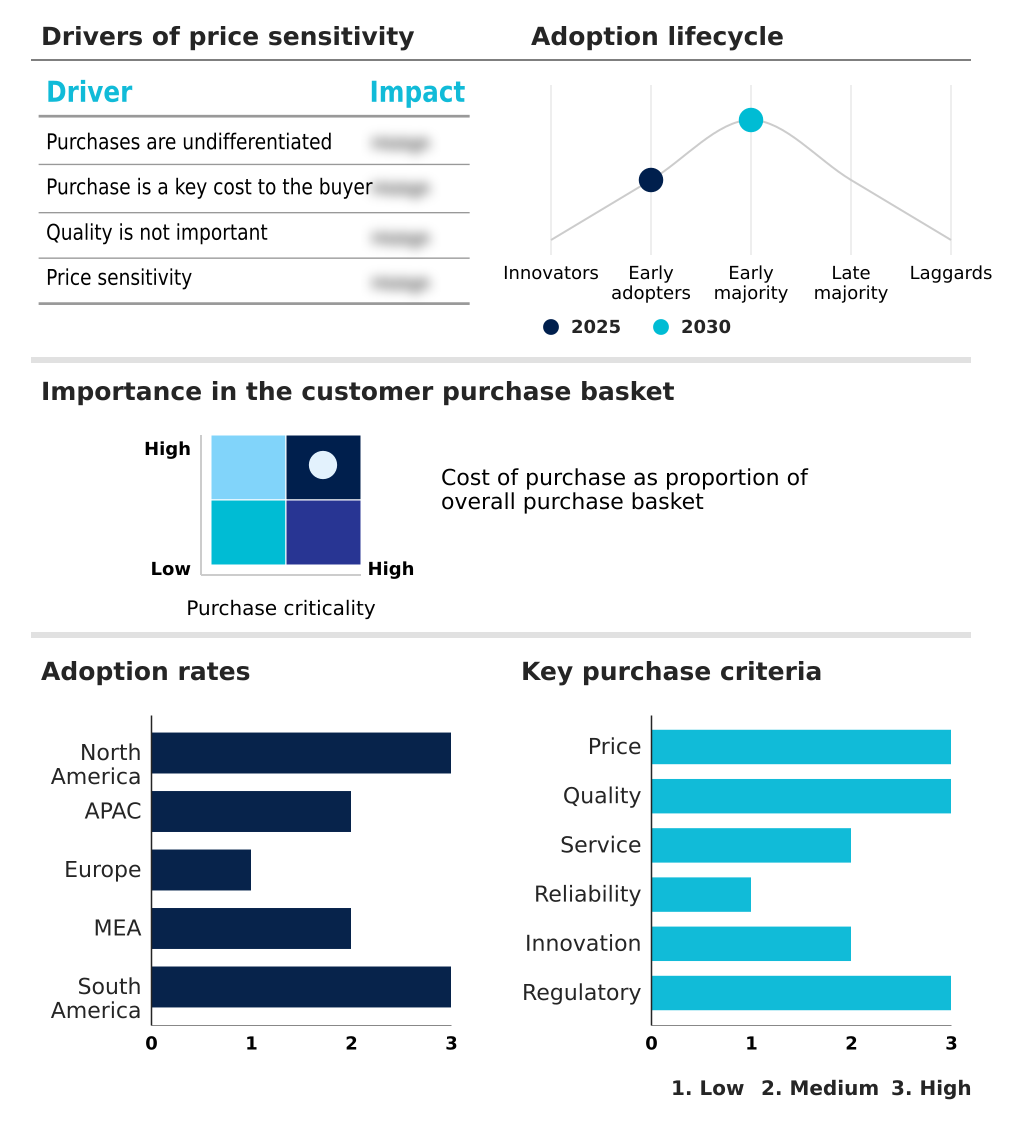
Exclusive Technavio Analysis on Customer Landscape

The insurance software market forecasting report includes the adoption lifecycle of the market, covering from the innovator’s stage to the laggard’s stage. It focuses on adoption rates in different regions based on penetration. Furthermore, the insurance software market report also includes key purchase criteria and drivers of price sensitivity to help companies evaluate and develop their market growth analysis strategies.

Customer Landscape of Insurance Software Industry

Competitive Landscape

Companies are implementing various strategies, such as strategic alliances, insurance software market forecast, partnerships, mergers and acquisitions, geographical expansion, and product/service launches, to enhance their presence in the industry.

Appian Corp. - Offerings center on a low-code automation platform, enabling streamlined claims automation and sophisticated workflow management systems for the insurance sector.

The industry research and growth report includes detailed analyses of the competitive landscape of the market and information about key companies, including:

  • Appian Corp.
  • Applied Systems Inc.
  • CCC Intelligent Solutions
  • Charles Taylor Ltd.
  • Duck Creek Technologies LLC
  • DXC Technology Co.
  • EIS Group Inc.
  • Equisoft
  • Fair Isaac Corp.
  • FRISS
  • Guidewire Software Inc.
  • Infosys Ltd.
  • Insurity LLC
  • Majesco
  • Oracle Corp.
  • Pegasystems Inc.
  • Salesforce Inc.
  • SAP SE
  • Shift Technology
  • Tata Consultancy Services

Qualitative and quantitative analysis of companies has been conducted to help clients understand the wider business environment as well as the strengths and weaknesses of key industry players. Data is qualitatively analyzed to categorize companies as pure play, category-focused, industry-focused, and diversified; it is quantitatively analyzed to categorize companies as dominant, leading, strong, tentative, and weak.

Recent Development and News in Insurance software market

  • In March 2025, Guidewire Software Inc. introduced an artificial intelligence-driven claims automation module designed to reduce claims processing times and improve operational efficiency for P&C insurers.
  • In May 2025, Duck Creek Technologies LLC announced significant enhancements to its analytics suite, incorporating advanced machine learning models to improve underwriting accuracy and risk assessment.
  • In April 2025, Charles Taylor Ltd. launched a blockchain-enabled compliance reporting tool for its InsureTech platform, targeting European property insurers to enhance transparency and streamline audit processes.
  • In September 2024, Oracle Corp. expanded its Oracle Insurance Policy Administration system with new capabilities to support emerging microinsurance and specialty line products, particularly for the growing APAC market.

Dive into Technavio’s robust research methodology, blending expert interviews, extensive data synthesis, and validated models for unparalleled Insurance Software Market insights. See full methodology.

Market Scope
Page number 301
Base year 2025
Historic period 2020-2024
Forecast period 2026-2030
Growth momentum & CAGR Accelerate at a CAGR of 9.7%
Market growth 2026-2030 USD 11180.4 million
Market structure Fragmented
YoY growth 2025-2026(%) 8.2%
Key countries US, Canada, Mexico, China, Japan, India, South Korea, Australia, Indonesia, Germany, UK, France, Italy, Spain, The Netherlands, Saudi Arabia, UAE, South Africa, Israel, Turkey, Brazil, Argentina and Chile
Competitive landscape Leading Companies, Market Positioning of Companies, Competitive Strategies, and Industry Risks

Request Free Sample

Research Analyst Overview

  • The insurance software market has evolved beyond simple digitalization, now focusing on intelligent, end-to-end process optimization. Core functions like policy administration and claims management systems are being transformed by AI-driven claims automation and advanced fraud detection analytics. This shift is built on a foundation of cloud-native deployment and increasingly, low-code automation platforms, which offer greater agility.
  • Insurers are leveraging predictive analytics and sophisticated risk scoring solutions to enhance underwriting accuracy and enable data-driven personalization. For instance, the implementation of automated claims estimation platforms has been shown to reduce processing times by up to 40%. The adoption of comprehensive risk management platforms with integrated regulatory compliance modules is now standard practice.
  • This technological overhaul, encompassing everything from digital core insurance platforms to CRM based insurance solutions, is critical for delivering the seamless experience customers expect from modern omnichannel platforms and ensuring long-term competitiveness in a rapidly changing landscape.

What are the Key Data Covered in this Insurance Software Market Research and Growth Report?

  • What is the expected growth of the Insurance Software Market between 2026 and 2030?

    • USD 11.18 billion, at a CAGR of 9.7%

  • What segmentation does the market report cover?

    • The report is segmented by Deployment (On-premises, and Cloud-based), Type (Life insurance, Accident and health insurance, Property and casualty insurance, and Others), End-user (Insurance companies, Agencies, and Brokers) and Geography (North America, APAC, Europe, Middle East and Africa, South America)

  • Which regions are analyzed in the report?

    • North America, APAC, Europe, Middle East and Africa and South America

  • What are the key growth drivers and market challenges?

    • Digital transformation and automation driving market growth, Cybersecurity and data privacy risks in insurance software

  • Who are the major players in the Insurance Software Market?

    • Appian Corp., Applied Systems Inc., CCC Intelligent Solutions, Charles Taylor Ltd., Duck Creek Technologies LLC, DXC Technology Co., EIS Group Inc., Equisoft, Fair Isaac Corp., FRISS, Guidewire Software Inc., Infosys Ltd., Insurity LLC, Majesco, Oracle Corp., Pegasystems Inc., Salesforce Inc., SAP SE, Shift Technology and Tata Consultancy Services

Market Research Insights

  • Market dynamics are shaped by the dual pressures of enhancing digital customer engagement and achieving greater operational efficiency through insurance process automation. The adoption of cloud insurance solutions is a key enabler, with implementations showing a direct correlation to a 15% improvement in claims processing efficiency.
  • Insurers leveraging AI-powered underwriting and insurance analytics tools report up to a 20% gain in risk assessment accuracy compared to traditional methods. This push for innovation is balanced by the critical need for robust cybersecurity for insurers and effective data privacy in insurance protocols.
  • As firms navigate these dynamics, the focus remains on delivering real-time policy adjustments and seamless omnichannel customer experiences, positioning technology as a central pillar of competitive strategy.

We can help! Our analysts can customize this insurance software market research report to meet your requirements.

Get in touch

1. Executive Summary

1.1 Market overview

Executive Summary - Chart on Market Overview
Executive Summary - Data Table on Market Overview
Executive Summary - Chart on Global Market Characteristics
Executive Summary - Chart on Market by Geography
Executive Summary - Chart on Market Segmentation by Deployment
Executive Summary - Chart on Market Segmentation by Type
Executive Summary - Chart on Market Segmentation by End-user
Executive Summary - Chart on Incremental Growth
Executive Summary - Data Table on Incremental Growth
Executive Summary - Chart on Company Market Positioning

2. Technavio Analysis

2.1 Analysis of price sensitivity, lifecycle, customer purchase basket, adoption rates, and purchase criteria

2.2 Criticality of inputs and Factors of differentiation

Chart on Overview on criticality of inputs and factors of differentiation

2.3 Factors of disruption

Chart on Overview on factors of disruption

2.4 Impact of drivers and challenges

Chart on Impact of drivers and challenges in 2025 and 2030

3. Market Landscape

3.1 Market ecosystem

Chart on Parent Market
Data Table on - Parent Market

3.2 Market characteristics

Chart on Market characteristics analysis

3.3 Value chain analysis

Chart on Value chain analysis

4. Market Sizing

4.1 Market definition

Data Table on Offerings of companies included in the market definition

4.2 Market segment analysis

Market segments

4.3 Market size 2025

4.4 Market outlook: Forecast for 2025-2030

Chart on Global - Market size and forecast 2025-2030 ($ million)
Data Table on Global - Market size and forecast 2025-2030 ($ million)
Chart on Global Market: Year-over-year growth 2025-2030 (%)
Data Table on Global Market: Year-over-year growth 2025-2030 (%)

5. Historic Market Size

5.1 Global Insurance Software Market 2020 - 2024

Historic Market Size - Data Table on Global Insurance Software Market 2020 - 2024 ($ million)

5.2 Deployment segment analysis 2020 - 2024

Historic Market Size - Deployment Segment 2020 - 2024 ($ million)

5.3 Type segment analysis 2020 - 2024

Historic Market Size - Type Segment 2020 - 2024 ($ million)

5.4 End-user segment analysis 2020 - 2024

Historic Market Size - End-user Segment 2020 - 2024 ($ million)

5.5 Geography segment analysis 2020 - 2024

Historic Market Size - Geography Segment 2020 - 2024 ($ million)

5.6 Country segment analysis 2020 - 2024

Historic Market Size - Country Segment 2020 - 2024 ($ million)

6. Qualitative Analysis

6.1 Impact of AI on global insurance software market

6.2 Impact of geopolitical conflict on global insurance software market

7. Five Forces Analysis

7.1 Five forces summary

Five forces analysis - Comparison between 2025 and 2030

7.2 Bargaining power of buyers

Bargaining power of buyers - Impact of key factors 2025 and 2030

7.3 Bargaining power of suppliers

Bargaining power of suppliers - Impact of key factors in 2025 and 2030

7.4 Threat of new entrants

Threat of new entrants - Impact of key factors in 2025 and 2030

7.5 Threat of substitutes

Threat of substitutes - Impact of key factors in 2025 and 2030

7.6 Threat of rivalry

Threat of rivalry - Impact of key factors in 2025 and 2030

7.7 Market condition

Chart on Market condition - Five forces 2025 and 2030

8. Market Segmentation by Deployment

8.1 Market segments

Chart on Deployment - Market share 2025-2030 (%)
Data Table on Deployment - Market share 2025-2030 (%)

8.2 Comparison by Deployment

Chart on Comparison by Deployment
Data Table on Comparison by Deployment

8.3 On-premises - Market size and forecast 2025-2030

Chart on On-premises - Market size and forecast 2025-2030 ($ million)
Data Table on On-premises - Market size and forecast 2025-2030 ($ million)
Chart on On-premises - Year-over-year growth 2025-2030 (%)
Data Table on On-premises - Year-over-year growth 2025-2030 (%)

8.4 Cloud-based - Market size and forecast 2025-2030

Chart on Cloud-based - Market size and forecast 2025-2030 ($ million)
Data Table on Cloud-based - Market size and forecast 2025-2030 ($ million)
Chart on Cloud-based - Year-over-year growth 2025-2030 (%)
Data Table on Cloud-based - Year-over-year growth 2025-2030 (%)

8.5 Market opportunity by Deployment

Market opportunity by Deployment ($ million)
Data Table on Market opportunity by Deployment ($ million)

9. Market Segmentation by Type

9.1 Market segments

Chart on Type - Market share 2025-2030 (%)
Data Table on Type - Market share 2025-2030 (%)

9.2 Comparison by Type

Chart on Comparison by Type
Data Table on Comparison by Type

9.3 Life insurance - Market size and forecast 2025-2030

Chart on Life insurance - Market size and forecast 2025-2030 ($ million)
Data Table on Life insurance - Market size and forecast 2025-2030 ($ million)
Chart on Life insurance - Year-over-year growth 2025-2030 (%)
Data Table on Life insurance - Year-over-year growth 2025-2030 (%)

9.4 Accident and health insurance - Market size and forecast 2025-2030

Chart on Accident and health insurance - Market size and forecast 2025-2030 ($ million)
Data Table on Accident and health insurance - Market size and forecast 2025-2030 ($ million)
Chart on Accident and health insurance - Year-over-year growth 2025-2030 (%)
Data Table on Accident and health insurance - Year-over-year growth 2025-2030 (%)

9.5 Property and casualty insurance - Market size and forecast 2025-2030

Chart on Property and casualty insurance - Market size and forecast 2025-2030 ($ million)
Data Table on Property and casualty insurance - Market size and forecast 2025-2030 ($ million)
Chart on Property and casualty insurance - Year-over-year growth 2025-2030 (%)
Data Table on Property and casualty insurance - Year-over-year growth 2025-2030 (%)

9.6 Others - Market size and forecast 2025-2030

Chart on Others - Market size and forecast 2025-2030 ($ million)
Data Table on Others - Market size and forecast 2025-2030 ($ million)
Chart on Others - Year-over-year growth 2025-2030 (%)
Data Table on Others - Year-over-year growth 2025-2030 (%)

9.7 Market opportunity by Type

Market opportunity by Type ($ million)
Data Table on Market opportunity by Type ($ million)

10. Market Segmentation by End-user

10.1 Market segments

Chart on End-user - Market share 2025-2030 (%)
Data Table on End-user - Market share 2025-2030 (%)

10.2 Comparison by End-user

Chart on Comparison by End-user
Data Table on Comparison by End-user

10.3 Insurance companies - Market size and forecast 2025-2030

Chart on Insurance companies - Market size and forecast 2025-2030 ($ million)
Data Table on Insurance companies - Market size and forecast 2025-2030 ($ million)
Chart on Insurance companies - Year-over-year growth 2025-2030 (%)
Data Table on Insurance companies - Year-over-year growth 2025-2030 (%)

10.4 Agencies - Market size and forecast 2025-2030

Chart on Agencies - Market size and forecast 2025-2030 ($ million)
Data Table on Agencies - Market size and forecast 2025-2030 ($ million)
Chart on Agencies - Year-over-year growth 2025-2030 (%)
Data Table on Agencies - Year-over-year growth 2025-2030 (%)

10.5 Brokers - Market size and forecast 2025-2030

Chart on Brokers - Market size and forecast 2025-2030 ($ million)
Data Table on Brokers - Market size and forecast 2025-2030 ($ million)
Chart on Brokers - Year-over-year growth 2025-2030 (%)
Data Table on Brokers - Year-over-year growth 2025-2030 (%)

10.6 Market opportunity by End-user

Market opportunity by End-user ($ million)
Data Table on Market opportunity by End-user ($ million)

11. Customer Landscape

11.1 Customer landscape overview

Analysis of price sensitivity, lifecycle, customer purchase basket, adoption rates, and purchase criteria

12. Geographic Landscape

12.1 Geographic segmentation

Chart on Market share by geography 2025-2030 (%)
Data Table on Market share by geography 2025-2030 (%)

12.2 Geographic comparison

Chart on Geographic comparison
Data Table on Geographic comparison

12.3 North America - Market size and forecast 2025-2030

Chart on North America - Market size and forecast 2025-2030 ($ million)
Data Table on North America - Market size and forecast 2025-2030 ($ million)
Chart on North America - Year-over-year growth 2025-2030 (%)
Data Table on North America - Year-over-year growth 2025-2030 (%)
Chart on Regional Comparison - North America
Data Table on Regional Comparison - North America

12.3.1 US - Market size and forecast 2025-2030

Chart on US - Market size and forecast 2025-2030 ($ million)
Data Table on US - Market size and forecast 2025-2030 ($ million)
Chart on US - Year-over-year growth 2025-2030 (%)
Data Table on US - Year-over-year growth 2025-2030 (%)

12.3.2 Canada - Market size and forecast 2025-2030

Chart on Canada - Market size and forecast 2025-2030 ($ million)
Data Table on Canada - Market size and forecast 2025-2030 ($ million)
Chart on Canada - Year-over-year growth 2025-2030 (%)
Data Table on Canada - Year-over-year growth 2025-2030 (%)

12.3.3 Mexico - Market size and forecast 2025-2030

Chart on Mexico - Market size and forecast 2025-2030 ($ million)
Data Table on Mexico - Market size and forecast 2025-2030 ($ million)
Chart on Mexico - Year-over-year growth 2025-2030 (%)
Data Table on Mexico - Year-over-year growth 2025-2030 (%)

12.4 APAC - Market size and forecast 2025-2030

Chart on APAC - Market size and forecast 2025-2030 ($ million)
Data Table on APAC - Market size and forecast 2025-2030 ($ million)
Chart on APAC - Year-over-year growth 2025-2030 (%)
Data Table on APAC - Year-over-year growth 2025-2030 (%)
Chart on Regional Comparison - APAC
Data Table on Regional Comparison - APAC

12.4.1 China - Market size and forecast 2025-2030

Chart on China - Market size and forecast 2025-2030 ($ million)
Data Table on China - Market size and forecast 2025-2030 ($ million)
Chart on China - Year-over-year growth 2025-2030 (%)
Data Table on China - Year-over-year growth 2025-2030 (%)

12.4.2 Japan - Market size and forecast 2025-2030

Chart on Japan - Market size and forecast 2025-2030 ($ million)
Data Table on Japan - Market size and forecast 2025-2030 ($ million)
Chart on Japan - Year-over-year growth 2025-2030 (%)
Data Table on Japan - Year-over-year growth 2025-2030 (%)

12.4.3 India - Market size and forecast 2025-2030

Chart on India - Market size and forecast 2025-2030 ($ million)
Data Table on India - Market size and forecast 2025-2030 ($ million)
Chart on India - Year-over-year growth 2025-2030 (%)
Data Table on India - Year-over-year growth 2025-2030 (%)

12.4.4 South Korea - Market size and forecast 2025-2030

Chart on South Korea - Market size and forecast 2025-2030 ($ million)
Data Table on South Korea - Market size and forecast 2025-2030 ($ million)
Chart on South Korea - Year-over-year growth 2025-2030 (%)
Data Table on South Korea - Year-over-year growth 2025-2030 (%)

12.4.5 Australia - Market size and forecast 2025-2030

Chart on Australia - Market size and forecast 2025-2030 ($ million)
Data Table on Australia - Market size and forecast 2025-2030 ($ million)
Chart on Australia - Year-over-year growth 2025-2030 (%)
Data Table on Australia - Year-over-year growth 2025-2030 (%)

12.4.6 Indonesia - Market size and forecast 2025-2030

Chart on Indonesia - Market size and forecast 2025-2030 ($ million)
Data Table on Indonesia - Market size and forecast 2025-2030 ($ million)
Chart on Indonesia - Year-over-year growth 2025-2030 (%)
Data Table on Indonesia - Year-over-year growth 2025-2030 (%)

12.5 Europe - Market size and forecast 2025-2030

Chart on Europe - Market size and forecast 2025-2030 ($ million)
Data Table on Europe - Market size and forecast 2025-2030 ($ million)
Chart on Europe - Year-over-year growth 2025-2030 (%)
Data Table on Europe - Year-over-year growth 2025-2030 (%)
Chart on Regional Comparison - Europe
Data Table on Regional Comparison - Europe

12.5.1 Germany - Market size and forecast 2025-2030

Chart on Germany - Market size and forecast 2025-2030 ($ million)
Data Table on Germany - Market size and forecast 2025-2030 ($ million)
Chart on Germany - Year-over-year growth 2025-2030 (%)
Data Table on Germany - Year-over-year growth 2025-2030 (%)

12.5.2 UK - Market size and forecast 2025-2030

Chart on UK - Market size and forecast 2025-2030 ($ million)
Data Table on UK - Market size and forecast 2025-2030 ($ million)
Chart on UK - Year-over-year growth 2025-2030 (%)
Data Table on UK - Year-over-year growth 2025-2030 (%)

12.5.3 France - Market size and forecast 2025-2030

Chart on France - Market size and forecast 2025-2030 ($ million)
Data Table on France - Market size and forecast 2025-2030 ($ million)
Chart on France - Year-over-year growth 2025-2030 (%)
Data Table on France - Year-over-year growth 2025-2030 (%)

12.5.4 Italy - Market size and forecast 2025-2030

Chart on Italy - Market size and forecast 2025-2030 ($ million)
Data Table on Italy - Market size and forecast 2025-2030 ($ million)
Chart on Italy - Year-over-year growth 2025-2030 (%)
Data Table on Italy - Year-over-year growth 2025-2030 (%)

12.5.5 Spain - Market size and forecast 2025-2030

Chart on Spain - Market size and forecast 2025-2030 ($ million)
Data Table on Spain - Market size and forecast 2025-2030 ($ million)
Chart on Spain - Year-over-year growth 2025-2030 (%)
Data Table on Spain - Year-over-year growth 2025-2030 (%)

12.5.6 The Netherlands - Market size and forecast 2025-2030

Chart on The Netherlands - Market size and forecast 2025-2030 ($ million)
Data Table on The Netherlands - Market size and forecast 2025-2030 ($ million)
Chart on The Netherlands - Year-over-year growth 2025-2030 (%)
Data Table on The Netherlands - Year-over-year growth 2025-2030 (%)

12.6 Middle East and Africa - Market size and forecast 2025-2030

Chart on Middle East and Africa - Market size and forecast 2025-2030 ($ million)
Data Table on Middle East and Africa - Market size and forecast 2025-2030 ($ million)
Chart on Middle East and Africa - Year-over-year growth 2025-2030 (%)
Data Table on Middle East and Africa - Year-over-year growth 2025-2030 (%)
Chart on Regional Comparison - Middle East and Africa
Data Table on Regional Comparison - Middle East and Africa

12.6.1 Saudi Arabia - Market size and forecast 2025-2030

Chart on Saudi Arabia - Market size and forecast 2025-2030 ($ million)
Data Table on Saudi Arabia - Market size and forecast 2025-2030 ($ million)
Chart on Saudi Arabia - Year-over-year growth 2025-2030 (%)
Data Table on Saudi Arabia - Year-over-year growth 2025-2030 (%)

12.6.2 UAE - Market size and forecast 2025-2030

Chart on UAE - Market size and forecast 2025-2030 ($ million)
Data Table on UAE - Market size and forecast 2025-2030 ($ million)
Chart on UAE - Year-over-year growth 2025-2030 (%)
Data Table on UAE - Year-over-year growth 2025-2030 (%)

12.6.3 South Africa - Market size and forecast 2025-2030

Chart on South Africa - Market size and forecast 2025-2030 ($ million)
Data Table on South Africa - Market size and forecast 2025-2030 ($ million)
Chart on South Africa - Year-over-year growth 2025-2030 (%)
Data Table on South Africa - Year-over-year growth 2025-2030 (%)

12.6.4 Israel - Market size and forecast 2025-2030

Chart on Israel - Market size and forecast 2025-2030 ($ million)
Data Table on Israel - Market size and forecast 2025-2030 ($ million)
Chart on Israel - Year-over-year growth 2025-2030 (%)
Data Table on Israel - Year-over-year growth 2025-2030 (%)

12.6.5 Turkey - Market size and forecast 2025-2030

Chart on Turkey - Market size and forecast 2025-2030 ($ million)
Data Table on Turkey - Market size and forecast 2025-2030 ($ million)
Chart on Turkey - Year-over-year growth 2025-2030 (%)
Data Table on Turkey - Year-over-year growth 2025-2030 (%)

12.7 South America - Market size and forecast 2025-2030

Chart on South America - Market size and forecast 2025-2030 ($ million)
Data Table on South America - Market size and forecast 2025-2030 ($ million)
Chart on South America - Year-over-year growth 2025-2030 (%)
Data Table on South America - Year-over-year growth 2025-2030 (%)
Chart on Regional Comparison - South America
Data Table on Regional Comparison - South America

12.7.1 Brazil - Market size and forecast 2025-2030

Chart on Brazil - Market size and forecast 2025-2030 ($ million)
Data Table on Brazil - Market size and forecast 2025-2030 ($ million)
Chart on Brazil - Year-over-year growth 2025-2030 (%)
Data Table on Brazil - Year-over-year growth 2025-2030 (%)

12.7.2 Argentina - Market size and forecast 2025-2030

Chart on Argentina - Market size and forecast 2025-2030 ($ million)
Data Table on Argentina - Market size and forecast 2025-2030 ($ million)
Chart on Argentina - Year-over-year growth 2025-2030 (%)
Data Table on Argentina - Year-over-year growth 2025-2030 (%)

12.7.3 Chile - Market size and forecast 2025-2030

Chart on Chile - Market size and forecast 2025-2030 ($ million)
Data Table on Chile - Market size and forecast 2025-2030 ($ million)
Chart on Chile - Year-over-year growth 2025-2030 (%)
Data Table on Chile - Year-over-year growth 2025-2030 (%)

12.8 Market opportunity by geography

Market opportunity by geography ($ million)
Data Tables on Market opportunity by geography ($ million)

13. Drivers, Challenges, and Opportunity

13.1 Market drivers

Digital transformation and automation driving market growth
Regulatory compliance and risk management shaping investment priorities
Customer experience and personalization strengthening competitive advantage

13.2 Market challenges

Cybersecurity and data privacy risks in insurance software
Integration complexity and persistent burden of legacy systems
Talent shortages and skill gaps hindering digital transformation

13.3 Impact of drivers and challenges

Impact of drivers and challenges in 2025 and 2030

13.4 Market opportunities

Artificial Intelligence and predictive analytics reshaping insurance software
Cloud-Native deployment and scalability transforming operational efficiency
Customer-centric digital platforms redefining engagement and loyalty

14. Competitive Landscape

14.1 Overview

14.2

Overview on criticality of inputs and factors of differentiation

14.3 Landscape disruption

Overview on factors of disruption

14.4 Industry risks

Impact of key risks on business

15. Competitive Analysis

15.1 Companies profiled

Companies covered

15.2 Company ranking index

15.3 Market positioning of companies

Matrix on companies position and classification

15.4 Appian Corp.

Appian Corp. - Overview
Appian Corp. - Business segments
Appian Corp. - Key offerings
Appian Corp. - Segment focus
SWOT

15.5 Applied Systems Inc.

Applied Systems Inc. - Overview
Applied Systems Inc. - Product / Service
Applied Systems Inc. - Key offerings
SWOT

15.6 CCC Intelligent Solutions

CCC Intelligent Solutions - Overview
CCC Intelligent Solutions - Product / Service
CCC Intelligent Solutions - Key offerings
SWOT

15.7 Charles Taylor Ltd.

Charles Taylor Ltd. - Overview
Charles Taylor Ltd. - Product / Service
Charles Taylor Ltd. - Key offerings
SWOT

15.8 Duck Creek Technologies LLC

Duck Creek Technologies LLC - Overview
Duck Creek Technologies LLC - Product / Service
Duck Creek Technologies LLC - Key offerings
SWOT

15.9 DXC Technology Co.

DXC Technology Co. - Overview
DXC Technology Co. - Business segments
DXC Technology Co. - Key news
DXC Technology Co. - Key offerings
DXC Technology Co. - Segment focus
SWOT

15.10 EIS Group Inc.

EIS Group Inc. - Overview
EIS Group Inc. - Product / Service
EIS Group Inc. - Key offerings
SWOT

15.11 Equisoft

Equisoft - Overview
Equisoft - Product / Service
Equisoft - Key offerings
SWOT

15.12 Fair Isaac Corp.

Fair Isaac Corp. - Overview
Fair Isaac Corp. - Business segments
Fair Isaac Corp. - Key news
Fair Isaac Corp. - Key offerings
Fair Isaac Corp. - Segment focus
SWOT

15.13 Infosys Ltd.

Infosys Ltd. - Overview
Infosys Ltd. - Business segments
Infosys Ltd. - Key news
Infosys Ltd. - Key offerings
Infosys Ltd. - Segment focus
SWOT

15.14 Oracle Corp.

Oracle Corp. - Overview
Oracle Corp. - Business segments
Oracle Corp. - Key news
Oracle Corp. - Key offerings
Oracle Corp. - Segment focus
SWOT

15.15 Pegasystems Inc.

Pegasystems Inc. - Overview
Pegasystems Inc. - Business segments
Pegasystems Inc. - Key offerings
Pegasystems Inc. - Segment focus
SWOT

15.16 Salesforce Inc.

Salesforce Inc. - Overview
Salesforce Inc. - Business segments
Salesforce Inc. - Key news
Salesforce Inc. - Key offerings
Salesforce Inc. - Segment focus
SWOT

15.17 SAP SE

SAP SE - Overview
SAP SE - Business segments
SAP SE - Key news
SAP SE - Key offerings
SAP SE - Segment focus
SWOT

15.18 Tata Consultancy Services

Tata Consultancy Services - Overview
Tata Consultancy Services - Business segments
Tata Consultancy Services - Key offerings
Tata Consultancy Services - Segment focus
SWOT

16. Appendix

16.1 Scope of the report

Market definition
Objectives
Notes and caveats

16.2 Inclusions and exclusions checklist

Inclusions checklist
Exclusions checklist

16.3 Currency conversion rates for US$

16.4 Research methodology

16.5 Data procurement

Information sources

16.6 Data validation

16.7 Validation techniques employed for market sizing

16.8 Data synthesis

16.9 360 degree market analysis

16.10 List of abbreviations

Research Methodology

Technavio presents a detailed picture of the market by way of study, synthesis, and summation of data from multiple sources. The analysts have presented the various facets of the market with a particular focus on identifying the key industry influencers. The data thus presented is comprehensive, reliable, and the result of extensive research, both primary and secondary.

INFORMATION SOURCES

Primary sources

  • Manufacturers and suppliers
  • Channel partners
  • Industry experts
  • Strategic decision makers

Secondary sources

  • Industry journals and periodicals
  • Government data
  • Financial reports of key industry players
  • Historical data
  • Press releases

DATA ANALYSIS

Data Synthesis

  • Collation of data
  • Estimation of key figures
  • Analysis of derived insights

Data Validation

  • Triangulation with data models
  • Reference against proprietary databases
  • Corroboration with industry experts

REPORT WRITING

Qualitative

  • Market drivers
  • Market challenges
  • Market trends
  • Five forces analysis

Quantitative

  • Market size and forecast
  • Market segmentation
  • Geographical insights
  • Competitive landscape

Interested in this report?

Get your sample now to see our research methodology and insights!

Download Now

Frequently Asked Questions

Insurance Software market growth will increase by USD 11180.4 million during 2026-2030.

The Insurance Software market is expected to grow at a CAGR of 9.7% during 2026-2030.

Insurance Software market is segmented by Deployment (On-premises, Cloud-based) Type (Life insurance, Accident and health insurance, Property and casualty insurance, Others) End-user (Insurance companies, Agencies, Brokers)

Appian Corp., Applied Systems Inc., CCC Intelligent Solutions, Charles Taylor Ltd., Duck Creek Technologies LLC, DXC Technology Co., EIS Group Inc., Equisoft, Fair Isaac Corp., FRISS, Guidewire Software Inc., Infosys Ltd., Insurity LLC, Majesco, Oracle Corp., Pegasystems Inc., Salesforce Inc., SAP SE, Shift Technology, Tata Consultancy Services are a few of the key vendors in the Insurance Software market.

North America will register the highest growth rate of 42.9% among the other regions. Therefore, the Insurance Software market in North America is expected to garner significant business opportunities for the vendors during the forecast period.

US, Canada, Mexico, China, Japan, India, South Korea, Australia, Indonesia, Germany, UK, France, Italy, Spain, The Netherlands, Saudi Arabia, UAE, South Africa, Israel, Turkey, Brazil, Argentina, Chile

  • Digital transformation and automation driving market growth is the driving factor this market.

The Insurance Software market vendors should focus on grabbing business opportunities from the Deployment segment as it accounted for the largest market share in the base year.
RIA - Research AI Assistant
Ask RIA