Insurtech Market Analysis, Size, and Forecast 2026-2030: North America (US, Canada, and Mexico), Europe (UK, Germany, and France), APAC (China, India, and Australia), Middle East and Africa (UAE, Saudi Arabia, and South Africa), South America (Brazil, Colombia, and Argentina), and Rest of World (ROW)

Insurtech Market Analysis, Size, and Forecast 2026-2030:
North America (US, Canada, and Mexico), Europe (UK, Germany, and France), APAC (China, India, and Australia), Middle East and Africa (UAE, Saudi Arabia, and South Africa), South America (Brazil, Colombia, and Argentina), and Rest of World (ROW)

Published: Apr 2026 295 Pages SKU: IRTNTR45277

Market Overview at a Glance

$164.26 B
Market Opportunity
44%
CAGR 2025 - 2030
52.8%
North America Growth
$12.68 B
Marketing and distribution segment 2024

Insurtech Market Size 2026-2030

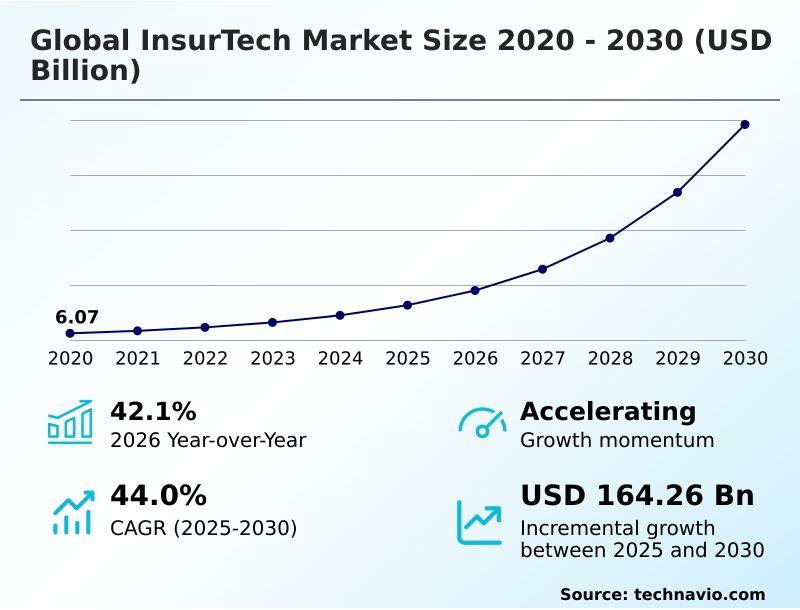
The insurtech market size is valued to increase by USD 164.26 billion, at a CAGR of 44% from 2025 to 2030. Acceleration of AI driven hyper personalization and predictive analytics will drive the insurtech market.

Major Market Trends & Insights

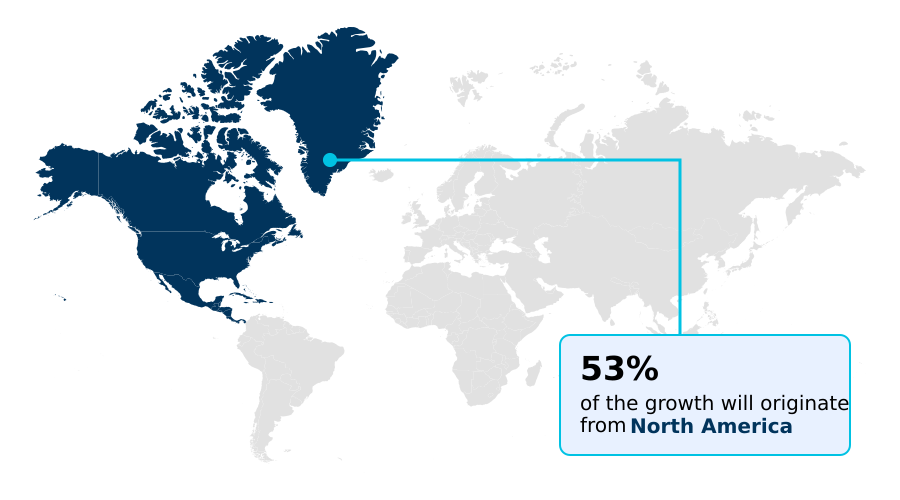
  • North America dominated the market and accounted for a 52.8% growth during the forecast period.
  • By Application - Marketing and distribution segment was valued at USD 12.68 billion in 2024
  • By Deployment - On-premises segment accounted for the largest market revenue share in 2024

Market Size & Forecast

  • Market Opportunities: USD 189.85 billion
  • Market Future Opportunities: USD 164.26 billion
  • CAGR from 2025 to 2030 : 44%

Market Summary

  • The InsurTech market is undergoing a significant transformation, driven by the strategic integration of advanced technologies to enhance operational efficiency. This evolution is characterized by a shift from reactive models to proactive risk mitigation strategies, powered by AI-driven underwriting and predictive analytics.
  • For example, a property and casualty carrier can now leverage computer vision for claims assessment, using automated damage assessment to analyze images of a damaged vehicle and generate a repair estimate within minutes, drastically reducing manual intervention. The adoption of cloud-native platforms is central to this change, providing the scalability needed for real-time data processing.
  • However, this digitalization introduces challenges in data governance and necessitates robust cybersecurity protocols. The integration of the Internet of Things (IoT) and telematics data further refines risk assessment, enabling dynamic pricing and usage-based insurance products that align with modern consumer expectations for personalized insurance products and on-demand coverage.

What will be the Size of the Insurtech Market during the forecast period?

Get Key Insights on Market Forecast (PDF) Request Free Sample

How is the Insurtech Market Segmented?

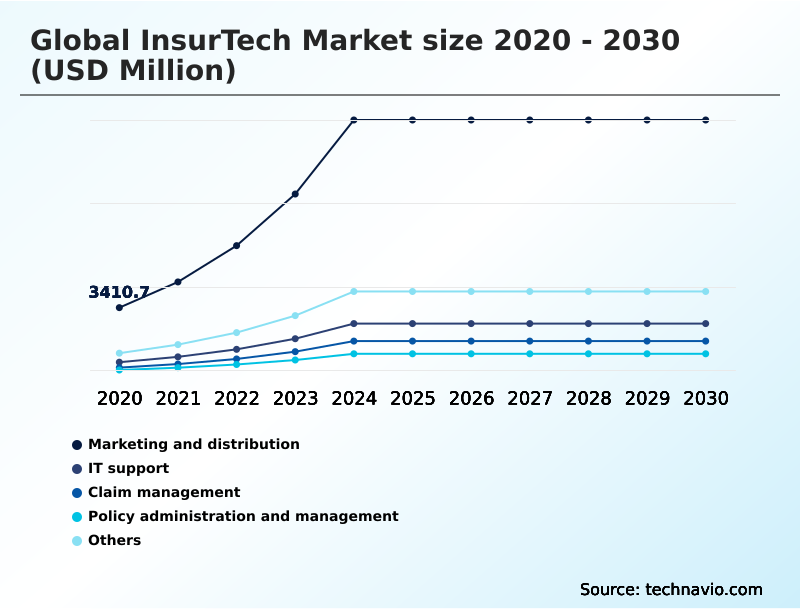
The insurtech industry research report provides comprehensive data (region-wise segment analysis), with forecasts and estimates in "USD million" for the period 2026-2030, as well as historical data from 2020-2024 for the following segments.

  • Application
    • Marketing and distribution
    • IT support
    • Claim management
    • Policy administration and management
    • Others
  • Deployment
    • On-premises
    • Cloud
  • End-user
    • Insurance companies
    • Brokers
    • Policyholders
  • Geography
    • North America
      • US
      • Canada
      • Mexico
    • Europe
      • UK
      • Germany
      • France
    • APAC
      • China
      • India
      • Australia
    • Middle East and Africa
      • UAE
      • Saudi Arabia
      • South Africa
    • South America
      • Brazil
      • Colombia
      • Argentina
    • Rest of World (ROW)

By Application Insights

The marketing and distribution segment is estimated to witness significant growth during the forecast period.

The marketing and distribution segment is shifting from intermediary models to direct-to-consumer digital channels. This evolution leverages machine learning models for hyper-personalized engagement and dynamic pricing. Digital distribution strategies, supported by robust policy administration systems, are key.

By utilizing predictive modeling to identify life events, firms can deliver relevant offers at the moment of need through mobile-first insurance platforms.

API integration with non-insurance platforms creates a seamless ecosystem, improving customer experience automation and driving a 15% increase in conversion rates.

This focus on a frictionless user journey, offering personalized insurance products, is essential for fostering long-term loyalty and managing the entire customer lifecycle management.

Request Free Sample

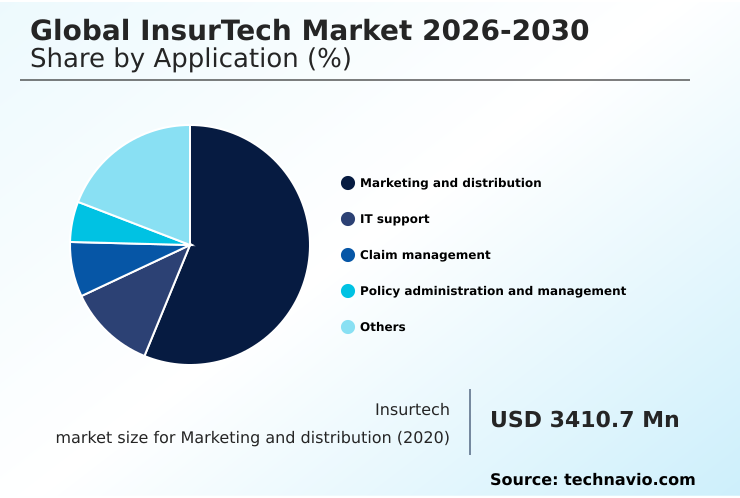
The Marketing and distribution segment was valued at USD 12.68 billion in 2024 and showed a gradual increase during the forecast period.

Request Free Sample

Regional Analysis

North America is estimated to contribute 52.8% to the growth of the global market during the forecast period.Technavio’s analysts have elaborately explained the regional trends and drivers that shape the market during the forecast period.

See How Insurtech Market Demand is Rising in North America Request Free Sample

The geographic landscape of the insurtech market is led by North America, which accounts for over 52% of incremental growth, driven by advanced risk assessment technologies and a mature venture capital ecosystem.

In this region, automated underwriting systems are standard, and firms are aggressively adopting AI for real-time risk mitigation. Europe follows, with a strong focus on regulatory compliance and data privacy, fostering innovation in areas like open insurance.

The APAC region is the fastest-growing, where a mobile-first population has allowed digital insurance platforms to leapfrog legacy systems, with AI-driven fraud detection being a key investment area.

In APAC, the use of computer vision and IoT for property insurance is expanding rapidly, especially in markets like China and India, addressing the needs of a burgeoning digital economy.

Market Dynamics

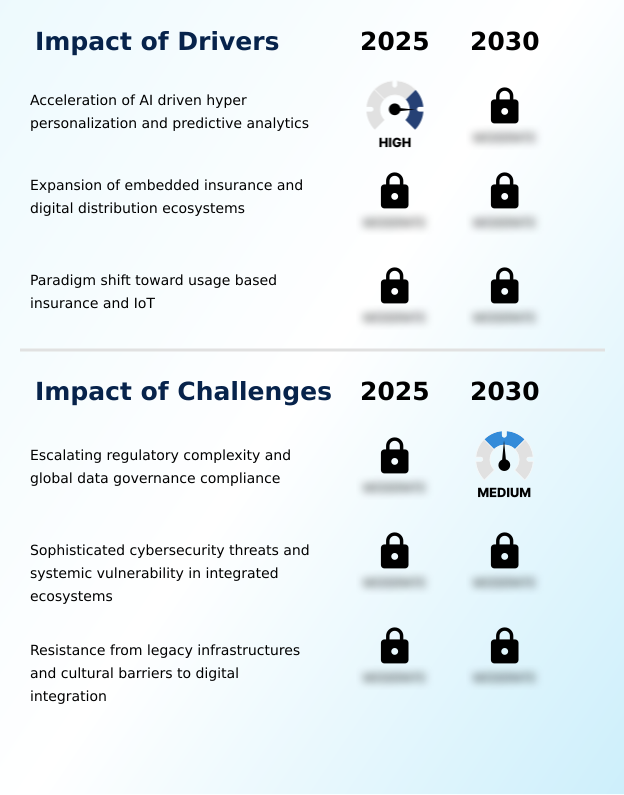
Our researchers analyzed the data with 2025 as the base year, along with the key drivers, trends, and challenges. A holistic analysis of drivers will help companies refine their marketing strategies to gain a competitive advantage.

  • The strategic evolution of the insurtech landscape is heavily influenced by the deepening integration of specific technologies addressing core industry challenges. The impact of AI on insurance underwriting is profound, moving carriers from static analysis to dynamic, real-time evaluations.
  • A key aspect of this transformation is using telematics data for risk modeling, which has fundamentally changed auto insurance by enabling premiums based on actual driving behavior. Concurrently, the role of blockchain in parametric insurance is gaining prominence, creating transparent, automated payout systems for trigger-based events, which are over 70% faster than traditional claims processes.
  • The benefits of embedded insurance API integration are also clear, as it seamlessly places coverage options at the digital point of sale, altering distribution dynamics. However, the challenges of legacy system migration remain a significant hurdle for established players. In response, many are turning to generative AI for customer service bots to improve user experience without a complete system overhaul.
  • Furthermore, computer vision applications in claims and how IoT reduces property insurance claims are shifting the focus from indemnity to proactive prevention. This tech-forward environment necessitates advanced cybersecurity measures for digital insurers and strict adherence to data privacy regulations in insurtech.
  • To maintain profitability, firms are heavily investing in automated fraud detection in insurance and utilizing real-time analytics for dynamic pricing, all contributing to the overarching goal of creating personalized insurance with big data. The impact of open insurance on brokers is also reshaping the intermediary landscape, favoring those who adopt tech-enabled advisory roles.

What are the key market drivers leading to the rise in the adoption of Insurtech Industry?

  • The acceleration of AI-driven hyper-personalization and predictive analytics is a key driver fueling market growth.

  • Key market drivers are centered on the use of technology to create highly personalized and efficient insurance products.
  • The acceleration of AI-driven underwriting, supported by powerful predictive analytics, allows insurers to move beyond demographic proxies to assess risk based on individual behaviors.
  • This is particularly evident in the rise of usage-based insurance (UBI) and on-demand coverage, where telematics data from vehicles provides real-time insights for auto insurance.
  • This data-driven decision making has been shown to reduce claims frequency by up to 20% among participating drivers. Simultaneously, the proliferation of embedded insurance is transforming distribution, integrating protection products directly into non-insurance transactions.
  • This model of proactive risk prevention not only enhances consumer convenience but also increases customer retention rates by an average of 15% for partner platforms.

What are the market trends shaping the Insurtech Industry?

  • The increasing dominance of generative AI and agentic workflows represents a significant market trend. This shift is reshaping operational capabilities and customer interaction models across the industry.

  • The market is being reshaped by the transition to advanced automation, with generative AI and agentic workflows at the forefront. This trend goes beyond basic chatbots, using sophisticated natural language processing (NLP) to handle nuanced customer interactions and synthesize complex policy documents.
  • A significant application is in claims automation, where AI in claims processing, combined with automated damage assessment technology, can evaluate digital claims submissions and draft settlement offers. This capability has been shown to enhance adjuster productivity by over 35%. Furthermore, parametric insurance is gaining traction, particularly for climate-related risks, where blockchain for smart contracts can trigger automatic payouts.
  • These systems, utilizing satellite data, can provide liquidity up to 90% faster than traditional indemnity claims, demonstrating a clear shift toward real-time, data-driven insurance solutions.

What challenges does the Insurtech Industry face during its growth?

  • Escalating regulatory complexity and the need for global data governance compliance present a key challenge to industry growth.

  • Significant challenges persist, primarily concerning regulatory complexity and technological resilience. Navigating the fragmented landscape of global data governance and adhering to new standards like the AI Act requires substantial investment in regulatory compliance automation. For many startups, these compliance costs can exceed 10% of their total operating budget, acting as a barrier to scale.
  • Concurrently, the move to interconnected, cloud infrastructure for insurers via an open insurance framework expands the surface area for sophisticated cyber threats, necessitating robust cybersecurity protocols. The persistence of legacy systems further complicates this, as migrating to a modern cloud-native platform while ensuring blockchain technology integration is a complex and costly endeavor.
  • This transition often increases IT spending by as much as 40% in the short term, straining resources and demanding a careful balance between innovation and operational stability.

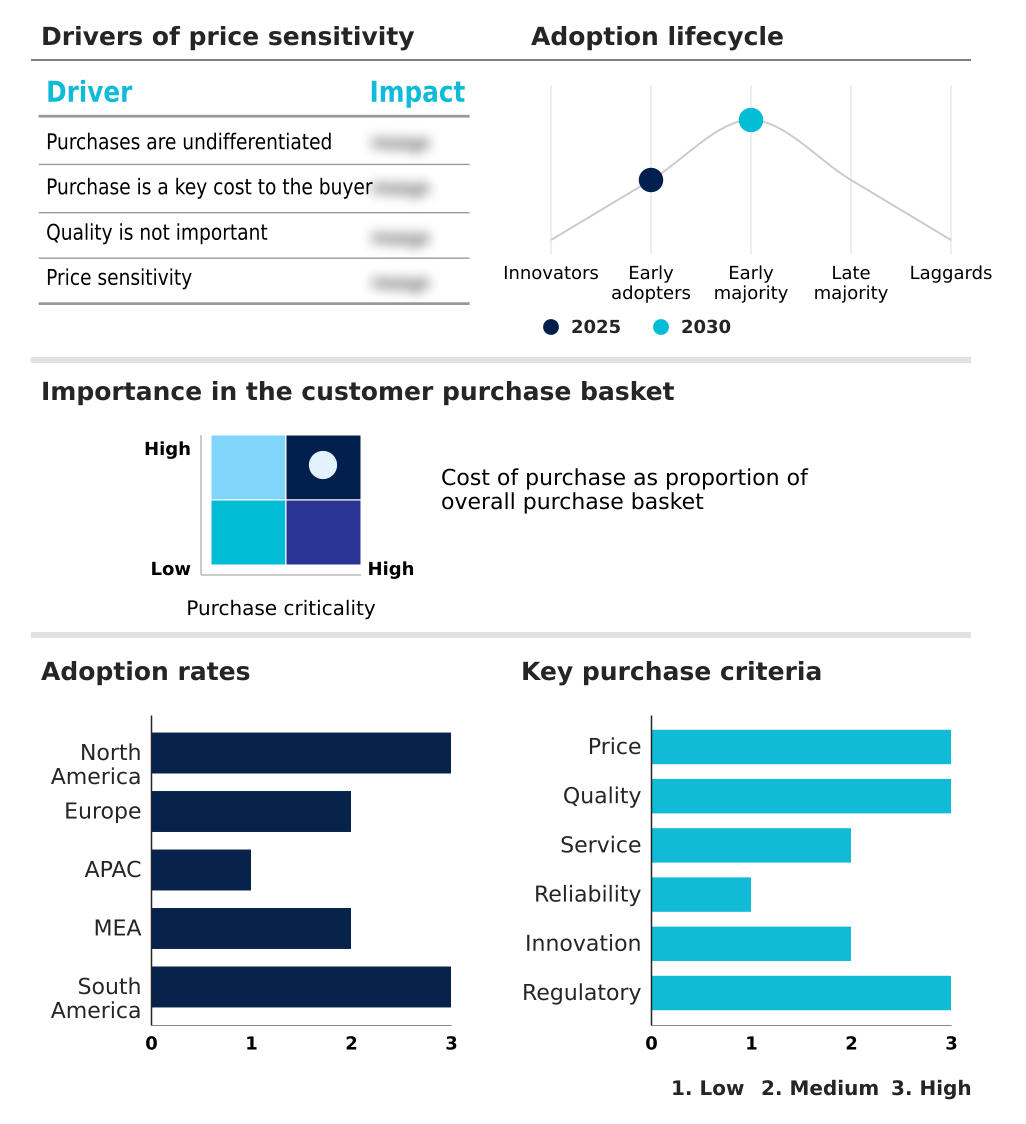
Exclusive Technavio Analysis on Customer Landscape

The insurtech market forecasting report includes the adoption lifecycle of the market, covering from the innovator’s stage to the laggard’s stage. It focuses on adoption rates in different regions based on penetration. Furthermore, the insurtech market report also includes key purchase criteria and drivers of price sensitivity to help companies evaluate and develop their market growth analysis strategies.

Customer Landscape of Insurtech Industry

Competitive Landscape

Companies are implementing various strategies, such as strategic alliances, insurtech market forecast, partnerships, mergers and acquisitions, geographical expansion, and product/service launches, to enhance their presence in the industry.

Alan SA - Delivers a comprehensive cloud-based core platform enabling policy, billing, and claims management for the P&C insurance industry, fostering ecosystem integration.

The industry research and growth report includes detailed analyses of the competitive landscape of the market and information about key companies, including:

  • Alan SA
  • Bolttech
  • Clover Health
  • Coalition Inc.
  • Cover Genius
  • Duck Creek Technologies LLC
  • Ethos Technologies Inc
  • Guidewire Software Inc.
  • Hippo Enterprises Inc
  • Lemonade Inc.
  • Majesco
  • Metromile Inc.
  • MILVIK AB
  • NEXT Insurance
  • Oscar Insurance Corp.
  • Policygenius Inc.
  • Root inc
  • Shift Technology
  • Tractable Ltd.
  • wefox Holding AG

Qualitative and quantitative analysis of companies has been conducted to help clients understand the wider business environment as well as the strengths and weaknesses of key industry players. Data is qualitatively analyzed to categorize companies as pure play, category-focused, industry-focused, and diversified; it is quantitatively analyzed to categorize companies as dominant, leading, strong, tentative, and weak.

Recent Development and News in Insurtech market

  • In September 2024, MetLife acquired a significant stake in the digital insurer Klimber to advance mobile-first distribution and strengthen its embedded insurance capabilities.
  • In October 2024, Guidewire introduced a revamped cloud-native framework designed specifically to facilitate third-party integrations, highlighting the industry-wide focus on interoperability for embedded insurance.
  • In December 2024, Brazil's government enacted a new Insurance Contract Act, a comprehensive regime designed to increase transparency and strengthen the rights of the insured, forcing an overhaul of technical systems.
  • In January 2025, The Insurance Regulatory and Development Authority of India introduced revised cybersecurity guidelines that mandate quarterly risk reviews and grant greater autonomy to Chief Information Security Officers to combat digital threats.

Dive into Technavio’s robust research methodology, blending expert interviews, extensive data synthesis, and validated models for unparalleled Insurtech Market insights. See full methodology.

Market Scope
Page number 295
Base year 2025
Historic period 2020-2024
Forecast period 2026-2030
Growth momentum & CAGR Accelerate at a CAGR of 44%
Market growth 2026-2030 USD 164263.5 million
Market structure Fragmented
YoY growth 2025-2026(%) 42.1%
Key countries US, Canada, Mexico, UK, Germany, France, Switzerland, The Netherlands, Spain, China, India, Australia, Japan, Singapore, South Korea, UAE, Saudi Arabia, South Africa, Israel, Kenya, Brazil, Colombia and Argentina
Competitive landscape Leading Companies, Market Positioning of Companies, Competitive Strategies, and Industry Risks

Request Free Sample

Research Analyst Overview

  • The insurtech market is defined by a strategic pivot toward integrating intelligent technologies to overhaul the entire insurance value chain. A key boardroom focus is the adoption of AI-driven underwriting and predictive analytics, which are no longer optional but essential for competitive risk assessment and dynamic pricing.
  • The deployment of a cloud-native platform is fundamental, enabling the agility needed to launch innovative products like parametric insurance and usage-based insurance (UBI). The use of telematics data and Internet of Things (IoT) devices provides a continuous stream of information, refining machine learning models and enhancing fraud detection capabilities.
  • For instance, the application of computer vision for claims automation has been shown to reduce claims cycle times by up to 50% in certain P&C lines. This level of efficiency directly impacts operational expenditures and capital allocation strategies.
  • As the industry moves forward, success will depend on mastering API integration for embedded insurance, ensuring stringent data governance and cybersecurity protocols, and leveraging regulatory technology (regtech) to navigate complex compliance landscapes. The evolution is clear: from basic policy administration to sophisticated, AI-powered agentic workflows and digital distribution.

What are the Key Data Covered in this Insurtech Market Research and Growth Report?

  • What is the expected growth of the Insurtech Market between 2026 and 2030?

    • USD 164.26 billion, at a CAGR of 44%

  • What segmentation does the market report cover?

    • The report is segmented by Application (Marketing and distribution, IT support, Claim management, Policy administration and management, and Others), Deployment (On-premises, and Cloud), End-user (Insurance companies, Brokers, and Policyholders) and Geography (North America, Europe, APAC, Middle East and Africa, South America)

  • Which regions are analyzed in the report?

    • North America, Europe, APAC, Middle East and Africa and South America

  • What are the key growth drivers and market challenges?

    • Acceleration of AI driven hyper personalization and predictive analytics, Escalating regulatory complexity and global data governance compliance

  • Who are the major players in the Insurtech Market?

    • Alan SA, Bolttech, Clover Health , Coalition Inc., Cover Genius, Duck Creek Technologies LLC, Ethos Technologies Inc, Guidewire Software Inc., Hippo Enterprises Inc, Lemonade Inc., Majesco, Metromile Inc., MILVIK AB, NEXT Insurance, Oscar Insurance Corp., Policygenius Inc., Root inc, Shift Technology, Tractable Ltd. and wefox Holding AG

Market Research Insights

  • The market's dynamics are shaped by a strategic push toward operational efficiency and enhanced customer experience automation. The adoption of digital insurance platforms is widespread, with firms leveraging data-driven decision making to refine product offerings. This technological integration yields tangible results; for instance, the implementation of automated underwriting systems reduces policy issuance times by over 60% compared to manual methods.
  • Similarly, embedded insurance models that utilize an open insurance framework can lower customer acquisition costs by up to 25%. As the industry pivots to proactive risk prevention, the focus remains on leveraging technology to create more resilient and customer-centric business models that can adapt to a complex regulatory environment.

We can help! Our analysts can customize this insurtech market research report to meet your requirements.

Get in touch

1. Executive Summary

1.1 Market overview

Executive Summary - Chart on Market Overview
Executive Summary - Data Table on Market Overview
Executive Summary - Chart on Global Market Characteristics
Executive Summary - Chart on Market by Geography
Executive Summary - Chart on Market Segmentation by Application
Executive Summary - Chart on Market Segmentation by Deployment
Executive Summary - Chart on Market Segmentation by End-user
Executive Summary - Chart on Incremental Growth
Executive Summary - Data Table on Incremental Growth
Executive Summary - Chart on Company Market Positioning

2. Technavio Analysis

2.1 Analysis of price sensitivity, lifecycle, customer purchase basket, adoption rates, and purchase criteria

2.2 Criticality of inputs and Factors of differentiation

Chart on Overview on criticality of inputs and factors of differentiation

2.3 Factors of disruption

Chart on Overview on factors of disruption

2.4 Impact of drivers and challenges

Chart on Impact of drivers and challenges in 2025 and 2030

3. Market Landscape

3.1 Market ecosystem

Chart on Parent Market
Data Table on - Parent Market

3.2 Market characteristics

Chart on Market characteristics analysis

3.3 Value chain analysis

Chart on Value chain analysis

4. Market Sizing

4.1 Market definition

Data Table on Offerings of companies included in the market definition

4.2 Market segment analysis

Market segments

4.3 Market size 2025

4.4 Market outlook: Forecast for 2025-2030

Chart on Global - Market size and forecast 2025-2030 ($ million)
Data Table on Global - Market size and forecast 2025-2030 ($ million)
Chart on Global Market: Year-over-year growth 2025-2030 (%)
Data Table on Global Market: Year-over-year growth 2025-2030 (%)

5. Historic Market Size

5.1 Global InsurTech Market 2020 - 2024

Historic Market Size - Data Table on Global InsurTech Market 2020 - 2024 ($ million)

5.2 Application segment analysis 2020 - 2024

Historic Market Size - Application Segment 2020 - 2024 ($ million)

5.3 Deployment segment analysis 2020 - 2024

Historic Market Size - Deployment Segment 2020 - 2024 ($ million)

5.4 End-user segment analysis 2020 - 2024

Historic Market Size - End-user Segment 2020 - 2024 ($ million)

5.5 Geography segment analysis 2020 - 2024

Historic Market Size - Geography Segment 2020 - 2024 ($ million)

5.6 Country segment analysis 2020 - 2024

Historic Market Size - Country Segment 2020 - 2024 ($ million)

6. Qualitative Analysis

6.1 Impact of AI on global insurtech market

6.2 Impact of geopolitical conflicts on global insurtech market

7. Five Forces Analysis

7.1 Five forces summary

Five forces analysis - Comparison between 2025 and 2030

7.2 Bargaining power of buyers

Bargaining power of buyers - Impact of key factors 2025 and 2030

7.3 Bargaining power of suppliers

Bargaining power of suppliers - Impact of key factors in 2025 and 2030

7.4 Threat of new entrants

Threat of new entrants - Impact of key factors in 2025 and 2030

7.5 Threat of substitutes

Threat of substitutes - Impact of key factors in 2025 and 2030

7.6 Threat of rivalry

Threat of rivalry - Impact of key factors in 2025 and 2030

7.7 Market condition

Chart on Market condition - Five forces 2025 and 2030

8. Market Segmentation by Application

8.1 Market segments

Chart on Application - Market share 2025-2030 (%)
Data Table on Application - Market share 2025-2030 (%)

8.2 Comparison by Application

Chart on Comparison by Application
Data Table on Comparison by Application

8.3 Marketing and distribution - Market size and forecast 2025-2030

Chart on Marketing and distribution - Market size and forecast 2025-2030 ($ million)
Data Table on Marketing and distribution - Market size and forecast 2025-2030 ($ million)
Chart on Marketing and distribution - Year-over-year growth 2025-2030 (%)
Data Table on Marketing and distribution - Year-over-year growth 2025-2030 (%)

8.4 IT support - Market size and forecast 2025-2030

Chart on IT support - Market size and forecast 2025-2030 ($ million)
Data Table on IT support - Market size and forecast 2025-2030 ($ million)
Chart on IT support - Year-over-year growth 2025-2030 (%)
Data Table on IT support - Year-over-year growth 2025-2030 (%)

8.5 Claim management - Market size and forecast 2025-2030

Chart on Claim management - Market size and forecast 2025-2030 ($ million)
Data Table on Claim management - Market size and forecast 2025-2030 ($ million)
Chart on Claim management - Year-over-year growth 2025-2030 (%)
Data Table on Claim management - Year-over-year growth 2025-2030 (%)

8.6 Policy administration and management - Market size and forecast 2025-2030

Chart on Policy administration and management - Market size and forecast 2025-2030 ($ million)
Data Table on Policy administration and management - Market size and forecast 2025-2030 ($ million)
Chart on Policy administration and management - Year-over-year growth 2025-2030 (%)
Data Table on Policy administration and management - Year-over-year growth 2025-2030 (%)

8.7 Others - Market size and forecast 2025-2030

Chart on Others - Market size and forecast 2025-2030 ($ million)
Data Table on Others - Market size and forecast 2025-2030 ($ million)
Chart on Others - Year-over-year growth 2025-2030 (%)
Data Table on Others - Year-over-year growth 2025-2030 (%)

8.8 Market opportunity by Application

Market opportunity by Application ($ million)
Data Table on Market opportunity by Application ($ million)

9. Market Segmentation by Deployment

9.1 Market segments

Chart on Deployment - Market share 2025-2030 (%)
Data Table on Deployment - Market share 2025-2030 (%)

9.2 Comparison by Deployment

Chart on Comparison by Deployment
Data Table on Comparison by Deployment

9.3 On-premises - Market size and forecast 2025-2030

Chart on On-premises - Market size and forecast 2025-2030 ($ million)
Data Table on On-premises - Market size and forecast 2025-2030 ($ million)
Chart on On-premises - Year-over-year growth 2025-2030 (%)
Data Table on On-premises - Year-over-year growth 2025-2030 (%)

9.4 Cloud - Market size and forecast 2025-2030

Chart on Cloud - Market size and forecast 2025-2030 ($ million)
Data Table on Cloud - Market size and forecast 2025-2030 ($ million)
Chart on Cloud - Year-over-year growth 2025-2030 (%)
Data Table on Cloud - Year-over-year growth 2025-2030 (%)

9.5 Market opportunity by Deployment

Market opportunity by Deployment ($ million)
Data Table on Market opportunity by Deployment ($ million)

10. Market Segmentation by End-user

10.1 Market segments

Chart on End-user - Market share 2025-2030 (%)
Data Table on End-user - Market share 2025-2030 (%)

10.2 Comparison by End-user

Chart on Comparison by End-user
Data Table on Comparison by End-user

10.3 Insurance companies - Market size and forecast 2025-2030

Chart on Insurance companies - Market size and forecast 2025-2030 ($ million)
Data Table on Insurance companies - Market size and forecast 2025-2030 ($ million)
Chart on Insurance companies - Year-over-year growth 2025-2030 (%)
Data Table on Insurance companies - Year-over-year growth 2025-2030 (%)

10.4 Brokers - Market size and forecast 2025-2030

Chart on Brokers - Market size and forecast 2025-2030 ($ million)
Data Table on Brokers - Market size and forecast 2025-2030 ($ million)
Chart on Brokers - Year-over-year growth 2025-2030 (%)
Data Table on Brokers - Year-over-year growth 2025-2030 (%)

10.5 Policyholders - Market size and forecast 2025-2030

Chart on Policyholders - Market size and forecast 2025-2030 ($ million)
Data Table on Policyholders - Market size and forecast 2025-2030 ($ million)
Chart on Policyholders - Year-over-year growth 2025-2030 (%)
Data Table on Policyholders - Year-over-year growth 2025-2030 (%)

10.6 Market opportunity by End-user

Market opportunity by End-user ($ million)
Data Table on Market opportunity by End-user ($ million)

11. Customer Landscape

11.1 Customer landscape overview

Analysis of price sensitivity, lifecycle, customer purchase basket, adoption rates, and purchase criteria

12. Geographic Landscape

12.1 Geographic segmentation

Chart on Market share by geography 2025-2030 (%)
Data Table on Market share by geography 2025-2030 (%)

12.2 Geographic comparison

Chart on Geographic comparison
Data Table on Geographic comparison

12.3 North America - Market size and forecast 2025-2030

Chart on North America - Market size and forecast 2025-2030 ($ million)
Data Table on North America - Market size and forecast 2025-2030 ($ million)
Chart on North America - Year-over-year growth 2025-2030 (%)
Data Table on North America - Year-over-year growth 2025-2030 (%)
Chart on Regional Comparison - North America
Data Table on Regional Comparison - North America

12.3.1 US - Market size and forecast 2025-2030

Chart on US - Market size and forecast 2025-2030 ($ million)
Data Table on US - Market size and forecast 2025-2030 ($ million)
Chart on US - Year-over-year growth 2025-2030 (%)
Data Table on US - Year-over-year growth 2025-2030 (%)

12.3.2 Canada - Market size and forecast 2025-2030

Chart on Canada - Market size and forecast 2025-2030 ($ million)
Data Table on Canada - Market size and forecast 2025-2030 ($ million)
Chart on Canada - Year-over-year growth 2025-2030 (%)
Data Table on Canada - Year-over-year growth 2025-2030 (%)

12.3.3 Mexico - Market size and forecast 2025-2030

Chart on Mexico - Market size and forecast 2025-2030 ($ million)
Data Table on Mexico - Market size and forecast 2025-2030 ($ million)
Chart on Mexico - Year-over-year growth 2025-2030 (%)
Data Table on Mexico - Year-over-year growth 2025-2030 (%)

12.4 Europe - Market size and forecast 2025-2030

Chart on Europe - Market size and forecast 2025-2030 ($ million)
Data Table on Europe - Market size and forecast 2025-2030 ($ million)
Chart on Europe - Year-over-year growth 2025-2030 (%)
Data Table on Europe - Year-over-year growth 2025-2030 (%)
Chart on Regional Comparison - Europe
Data Table on Regional Comparison - Europe

12.4.1 UK - Market size and forecast 2025-2030

Chart on UK - Market size and forecast 2025-2030 ($ million)
Data Table on UK - Market size and forecast 2025-2030 ($ million)
Chart on UK - Year-over-year growth 2025-2030 (%)
Data Table on UK - Year-over-year growth 2025-2030 (%)

12.4.2 Germany - Market size and forecast 2025-2030

Chart on Germany - Market size and forecast 2025-2030 ($ million)
Data Table on Germany - Market size and forecast 2025-2030 ($ million)
Chart on Germany - Year-over-year growth 2025-2030 (%)
Data Table on Germany - Year-over-year growth 2025-2030 (%)

12.4.3 France - Market size and forecast 2025-2030

Chart on France - Market size and forecast 2025-2030 ($ million)
Data Table on France - Market size and forecast 2025-2030 ($ million)
Chart on France - Year-over-year growth 2025-2030 (%)
Data Table on France - Year-over-year growth 2025-2030 (%)

12.4.4 Switzerland - Market size and forecast 2025-2030

Chart on Switzerland - Market size and forecast 2025-2030 ($ million)
Data Table on Switzerland - Market size and forecast 2025-2030 ($ million)
Chart on Switzerland - Year-over-year growth 2025-2030 (%)
Data Table on Switzerland - Year-over-year growth 2025-2030 (%)

12.4.5 The Netherlands - Market size and forecast 2025-2030

Chart on The Netherlands - Market size and forecast 2025-2030 ($ million)
Data Table on The Netherlands - Market size and forecast 2025-2030 ($ million)
Chart on The Netherlands - Year-over-year growth 2025-2030 (%)
Data Table on The Netherlands - Year-over-year growth 2025-2030 (%)

12.4.6 Spain - Market size and forecast 2025-2030

Chart on Spain - Market size and forecast 2025-2030 ($ million)
Data Table on Spain - Market size and forecast 2025-2030 ($ million)
Chart on Spain - Year-over-year growth 2025-2030 (%)
Data Table on Spain - Year-over-year growth 2025-2030 (%)

12.5 APAC - Market size and forecast 2025-2030

Chart on APAC - Market size and forecast 2025-2030 ($ million)
Data Table on APAC - Market size and forecast 2025-2030 ($ million)
Chart on APAC - Year-over-year growth 2025-2030 (%)
Data Table on APAC - Year-over-year growth 2025-2030 (%)
Chart on Regional Comparison - APAC
Data Table on Regional Comparison - APAC

12.5.1 China - Market size and forecast 2025-2030

Chart on China - Market size and forecast 2025-2030 ($ million)
Data Table on China - Market size and forecast 2025-2030 ($ million)
Chart on China - Year-over-year growth 2025-2030 (%)
Data Table on China - Year-over-year growth 2025-2030 (%)

12.5.2 India - Market size and forecast 2025-2030

Chart on India - Market size and forecast 2025-2030 ($ million)
Data Table on India - Market size and forecast 2025-2030 ($ million)
Chart on India - Year-over-year growth 2025-2030 (%)
Data Table on India - Year-over-year growth 2025-2030 (%)

12.5.3 Australia - Market size and forecast 2025-2030

Chart on Australia - Market size and forecast 2025-2030 ($ million)
Data Table on Australia - Market size and forecast 2025-2030 ($ million)
Chart on Australia - Year-over-year growth 2025-2030 (%)
Data Table on Australia - Year-over-year growth 2025-2030 (%)

12.5.4 Japan - Market size and forecast 2025-2030

Chart on Japan - Market size and forecast 2025-2030 ($ million)
Data Table on Japan - Market size and forecast 2025-2030 ($ million)
Chart on Japan - Year-over-year growth 2025-2030 (%)
Data Table on Japan - Year-over-year growth 2025-2030 (%)

12.5.5 Singapore - Market size and forecast 2025-2030

Chart on Singapore - Market size and forecast 2025-2030 ($ million)
Data Table on Singapore - Market size and forecast 2025-2030 ($ million)
Chart on Singapore - Year-over-year growth 2025-2030 (%)
Data Table on Singapore - Year-over-year growth 2025-2030 (%)

12.5.6 South Korea - Market size and forecast 2025-2030

Chart on South Korea - Market size and forecast 2025-2030 ($ million)
Data Table on South Korea - Market size and forecast 2025-2030 ($ million)
Chart on South Korea - Year-over-year growth 2025-2030 (%)
Data Table on South Korea - Year-over-year growth 2025-2030 (%)

12.6 Middle East and Africa - Market size and forecast 2025-2030

Chart on Middle East and Africa - Market size and forecast 2025-2030 ($ million)
Data Table on Middle East and Africa - Market size and forecast 2025-2030 ($ million)
Chart on Middle East and Africa - Year-over-year growth 2025-2030 (%)
Data Table on Middle East and Africa - Year-over-year growth 2025-2030 (%)
Chart on Regional Comparison - Middle East and Africa
Data Table on Regional Comparison - Middle East and Africa

12.6.1 UAE - Market size and forecast 2025-2030

Chart on UAE - Market size and forecast 2025-2030 ($ million)
Data Table on UAE - Market size and forecast 2025-2030 ($ million)
Chart on UAE - Year-over-year growth 2025-2030 (%)
Data Table on UAE - Year-over-year growth 2025-2030 (%)

12.6.2 Saudi Arabia - Market size and forecast 2025-2030

Chart on Saudi Arabia - Market size and forecast 2025-2030 ($ million)
Data Table on Saudi Arabia - Market size and forecast 2025-2030 ($ million)
Chart on Saudi Arabia - Year-over-year growth 2025-2030 (%)
Data Table on Saudi Arabia - Year-over-year growth 2025-2030 (%)

12.6.3 South Africa - Market size and forecast 2025-2030

Chart on South Africa - Market size and forecast 2025-2030 ($ million)
Data Table on South Africa - Market size and forecast 2025-2030 ($ million)
Chart on South Africa - Year-over-year growth 2025-2030 (%)
Data Table on South Africa - Year-over-year growth 2025-2030 (%)

12.6.4 Israel - Market size and forecast 2025-2030

Chart on Israel - Market size and forecast 2025-2030 ($ million)
Data Table on Israel - Market size and forecast 2025-2030 ($ million)
Chart on Israel - Year-over-year growth 2025-2030 (%)
Data Table on Israel - Year-over-year growth 2025-2030 (%)

12.6.5 Kenya - Market size and forecast 2025-2030

Chart on Kenya - Market size and forecast 2025-2030 ($ million)
Data Table on Kenya - Market size and forecast 2025-2030 ($ million)
Chart on Kenya - Year-over-year growth 2025-2030 (%)
Data Table on Kenya - Year-over-year growth 2025-2030 (%)

12.7 South America - Market size and forecast 2025-2030

Chart on South America - Market size and forecast 2025-2030 ($ million)
Data Table on South America - Market size and forecast 2025-2030 ($ million)
Chart on South America - Year-over-year growth 2025-2030 (%)
Data Table on South America - Year-over-year growth 2025-2030 (%)
Chart on Regional Comparison - South America
Data Table on Regional Comparison - South America

12.7.1 Brazil - Market size and forecast 2025-2030

Chart on Brazil - Market size and forecast 2025-2030 ($ million)
Data Table on Brazil - Market size and forecast 2025-2030 ($ million)
Chart on Brazil - Year-over-year growth 2025-2030 (%)
Data Table on Brazil - Year-over-year growth 2025-2030 (%)

12.7.2 Colombia - Market size and forecast 2025-2030

Chart on Colombia - Market size and forecast 2025-2030 ($ million)
Data Table on Colombia - Market size and forecast 2025-2030 ($ million)
Chart on Colombia - Year-over-year growth 2025-2030 (%)
Data Table on Colombia - Year-over-year growth 2025-2030 (%)

12.7.3 Argentina - Market size and forecast 2025-2030

Chart on Argentina - Market size and forecast 2025-2030 ($ million)
Data Table on Argentina - Market size and forecast 2025-2030 ($ million)
Chart on Argentina - Year-over-year growth 2025-2030 (%)
Data Table on Argentina - Year-over-year growth 2025-2030 (%)

12.8 Market opportunity by geography

Market opportunity by geography ($ million)
Data Tables on Market opportunity by geography ($ million)

13. Drivers, Challenges, and Opportunity

13.1 Market drivers

Acceleration of AI driven hyper personalization and predictive analytics
Expansion of embedded insurance and digital distribution ecosystems
Paradigm shift toward usage based insurance and IoT

13.2 Market challenges

Escalating regulatory complexity and global data governance compliance
Sophisticated cybersecurity threats and systemic vulnerability in integrated ecosystems
Resistance from legacy infrastructures and cultural barriers to digital integration

13.3 Impact of drivers and challenges

Impact of drivers and challenges in 2025 and 2030

13.4 Market opportunities

Dominance of generative AI and agentic workflows
Expansion of embedded insurance and open data ecosystems
Transition toward parametric insurance and real time risk mitigation

14. Competitive Landscape

14.1 Overview

14.2

Overview on criticality of inputs and factors of differentiation

14.3 Landscape disruption

Overview on factors of disruption

14.4 Industry risks

Impact of key risks on business

15. Competitive Analysis

15.1 Companies profiled

Companies covered

15.2 Company ranking index

15.3 Market positioning of companies

Matrix on companies position and classification

15.4 Alan SA

Alan SA - Overview
Alan SA - Product / Service
Alan SA - Key offerings
SWOT

15.5 Bolttech

Bolttech - Overview
Bolttech - Product / Service
Bolttech - Key offerings
SWOT

15.6 Clover Health

Clover Health - Overview
Clover Health - Product / Service
Clover Health - Key offerings
SWOT

15.7 Coalition Inc.

Coalition Inc. - Overview
Coalition Inc. - Product / Service
Coalition Inc. - Key offerings
SWOT

15.8 Cover Genius

Cover Genius - Overview
Cover Genius - Product / Service
Cover Genius - Key offerings
SWOT

15.9 Duck Creek Technologies LLC

Duck Creek Technologies LLC - Overview
Duck Creek Technologies LLC - Product / Service
Duck Creek Technologies LLC - Key offerings
SWOT

15.10 Guidewire Software Inc.

Guidewire Software Inc. - Overview
Guidewire Software Inc. - Product / Service
Guidewire Software Inc. - Key offerings
SWOT

15.11 Hippo Enterprises Inc

Hippo Enterprises Inc - Overview
Hippo Enterprises Inc - Business segments
Hippo Enterprises Inc - Key offerings
Hippo Enterprises Inc - Segment focus
SWOT

15.12 Lemonade Inc.

Lemonade Inc. - Overview
Lemonade Inc. - Product / Service
Lemonade Inc. - Key offerings
SWOT

15.13 Majesco

Majesco - Overview
Majesco - Product / Service
Majesco - Key offerings
SWOT

15.14 MILVIK AB

MILVIK AB - Overview
MILVIK AB - Product / Service
MILVIK AB - Key offerings
SWOT

15.15 NEXT Insurance

NEXT Insurance - Overview
NEXT Insurance - Product / Service
NEXT Insurance - Key offerings
SWOT

15.16 Oscar Insurance Corp.

Oscar Insurance Corp. - Overview
Oscar Insurance Corp. - Product / Service
Oscar Insurance Corp. - Key offerings
SWOT

15.17 Root inc

Root inc - Overview
Root inc - Product / Service
Root inc - Key offerings
SWOT

15.18 wefox Holding AG

wefox Holding AG - Overview
wefox Holding AG - Product / Service
wefox Holding AG - Key offerings
SWOT

16. Appendix

16.1 Scope of the report

Market definition
Objectives
Notes and caveats

16.2 Inclusions and exclusions checklist

Inclusions checklist
Exclusions checklist

16.3 Currency conversion rates for US$

16.4 Research methodology

16.5 Data procurement

Information sources

16.6 Data validation

16.7 Validation techniques employed for market sizing

16.8 Data synthesis

16.9 360 degree market analysis

16.10 List of abbreviations

Research Methodology

Technavio presents a detailed picture of the market by way of study, synthesis, and summation of data from multiple sources. The analysts have presented the various facets of the market with a particular focus on identifying the key industry influencers. The data thus presented is comprehensive, reliable, and the result of extensive research, both primary and secondary.

INFORMATION SOURCES

Primary sources

  • Manufacturers and suppliers
  • Channel partners
  • Industry experts
  • Strategic decision makers

Secondary sources

  • Industry journals and periodicals
  • Government data
  • Financial reports of key industry players
  • Historical data
  • Press releases

DATA ANALYSIS

Data Synthesis

  • Collation of data
  • Estimation of key figures
  • Analysis of derived insights

Data Validation

  • Triangulation with data models
  • Reference against proprietary databases
  • Corroboration with industry experts

REPORT WRITING

Qualitative

  • Market drivers
  • Market challenges
  • Market trends
  • Five forces analysis

Quantitative

  • Market size and forecast
  • Market segmentation
  • Geographical insights
  • Competitive landscape

Interested in this report?

Get your sample now to see our research methodology and insights!

Download Now

Frequently Asked Questions

Insurtech market growth will increase by USD 164263.5 million during 2026-2030.

The Insurtech market is expected to grow at a CAGR of 44% during 2026-2030.

Insurtech market is segmented by Application (Marketing and distribution, IT support, Claim management, Policy administration and management, Others) Deployment (On-premises, Cloud) End-user (Insurance companies, Brokers, Policyholders)

Alan SA, Bolttech, Clover Health , Coalition Inc., Cover Genius, Duck Creek Technologies LLC, Ethos Technologies Inc, Guidewire Software Inc., Hippo Enterprises Inc, Lemonade Inc., Majesco, Metromile Inc., MILVIK AB, NEXT Insurance, Oscar Insurance Corp., Policygenius Inc., Root inc, Shift Technology, Tractable Ltd., wefox Holding AG are a few of the key vendors in the Insurtech market.

North America will register the highest growth rate of 52.8% among the other regions. Therefore, the Insurtech market in North America is expected to garner significant business opportunities for the vendors during the forecast period.

US, Canada, Mexico, UK, Germany, France, Switzerland, The Netherlands, Spain, China, India, Australia, Japan, Singapore, South Korea, UAE, Saudi Arabia, South Africa, Israel, Kenya, Brazil, Colombia, Argentina

  • Acceleration of AI driven hyper personalization and predictive analytics is the driving factor this market.

The Insurtech market vendors should focus on grabbing business opportunities from the Application segment as it accounted for the largest market share in the base year.
RIA - Research AI Assistant
Ask RIA