Interspinous Spacers Market Size 2024-2028
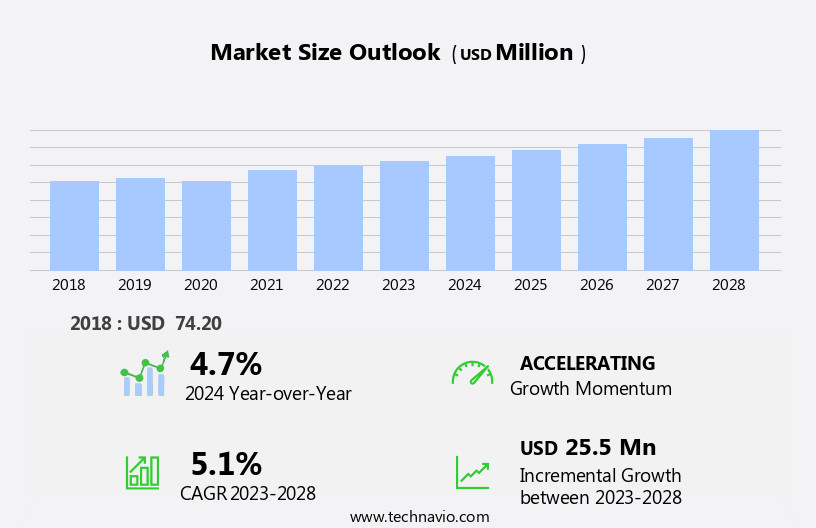
The interspinous spacers market size is forecast to increase by USD 25.5 million, at a CAGR of 5.1% between 2023 and 2028.
- The market is experiencing significant growth due to the increasing prevalence of spinal disorders. The global population is aging, leading to an increase in the number of people suffering from spinal conditions such as degenerative disc diseases, herniated discs, and spinal stenosis. This trend is driving demand for minimally invasive spinal procedures, including the use of interspinous spacers. Another key driver for the market is technological advances. Innovations in material science and design have led to the development of advanced interspinous spacers with improved biomechanical properties and clinical outcomes. These devices offer better pain relief, mobility, and functional restoration compared to traditional surgical procedures.
- However, the market also faces challenges, primarily due to the high costs associated with spine surgery. The cost of spine surgery can be prohibitive for many patients, leading to a significant unmet need for affordable treatment options. Additionally, there are specific challenges related to the reimbursement landscape and regulatory requirements, which can impact market penetration and profitability for companies operating in this space. To capitalize on market opportunities and navigate challenges effectively, companies must focus on developing cost-effective solutions while ensuring regulatory compliance and clinical efficacy.
What will be the Size of the Interspinous Spacers Market during the forecast period?
The interspinous spacer market continues to evolve, driven by the persistent demand for pain relief and biomechanical stability solutions for various spinal conditions. These devices, typically made of stainless steel, play a crucial role in addressing spinal instability, spinal stenosis, and cervical spondylosis, among others. The ongoing unfolding of market activities includes the integration of advanced technologies, such as bone morphogenetic protein, to enhance functional outcomes and improve quality of life for patients. Spinal fusion, surgical implants, and postoperative rehabilitation are key areas where interspinous spacers are making a significant impact. For instance, they facilitate spinal mobility and reduce recovery time, enabling outpatient care for some surgical procedures.
In the realm of pain management, these devices offer load-sharing capabilities, providing relief for conditions like lumbar disc herniation and spinal canal stenosis. Moreover, interspinous spacers have found applications in the treatment of complex conditions, such as spinal tumors and spinal cord injury. The continuous development in this market is further influenced by healthcare cost considerations, as well as regulatory approvals, such as FDA approval for certain devices. The evolving market dynamics also reflect the ongoing research and innovation in minimally invasive surgery, disc arthroplasty, and other advanced spinal treatments. Patient satisfaction and insurance coverage remain critical factors shaping the interspinous spacer market.
As the demand for effective and cost-efficient spinal solutions continues to grow, market players are focusing on delivering high-quality, patient-centric solutions that cater to a diverse range of spinal conditions and patient needs.
How is this Interspinous Spacers Industry segmented?
The interspinous spacers industry research report provides comprehensive data (region-wise segment analysis), with forecasts and estimates in "USD million" for the period 2024-2028, as well as historical data from 2018-2022 for the following segments.
- Product
- Static
- Dynamic
- Geography
- North America
- US
- Canada
- Europe
- Germany
- UK
- APAC
- China
- Rest of World (ROW)
- North America
By Product Insights
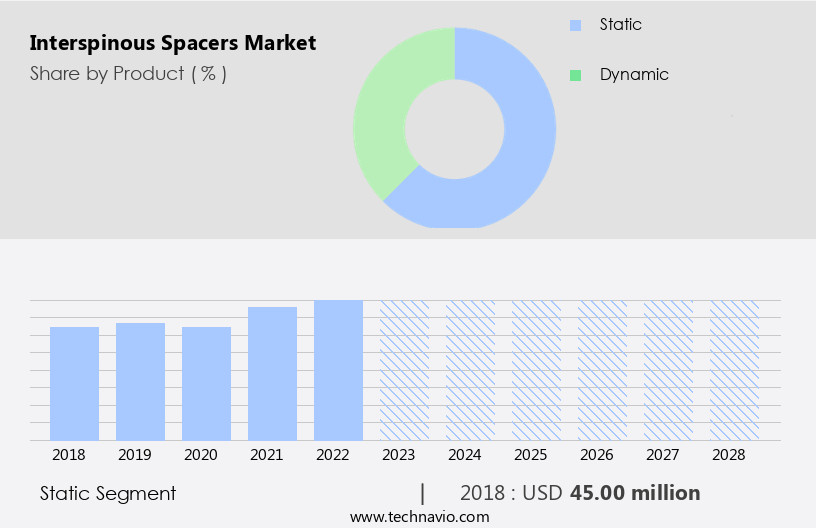
The static segment is estimated to witness significant growth during the forecast period.
The market for interspinous spacers is witnessing significant activity, driven by the growing prevalence of conditions such as lumbar disc herniation, spinal stenosis, and cervical spondylosis. Static interspinous spacers, which are the most commonly used devices, account for a large share of the market. These devices, implanted between the spinous processes of the vertebrae, provide decompression of the neural foramen and are made of non-compressive materials like metals and bones. Clinical trials and functional outcomes studies have shown their effectiveness in pain relief and improving functional capacity. In comparison to surgical procedures like laminectomy, static interspinous spacers offer cost advantages.
For instance, in individuals with lumbar spinal stenosis, static implants have been found to be less expensive than laminectomy. This cost-effectiveness, coupled with their minimally invasive nature, is driving their adoption, especially in outpatient care settings. Besides static interspinous spacers, other technologies like dynamic spacers, bone grafting, and spinal fusion are also gaining traction. Dynamic spacers, which allow for load sharing and natural range of motion, are increasingly being used for better biomechanical stability and postoperative rehabilitation. Bone grafting and spinal fusion procedures are used for treating spinal instability and spinal deformities, while pain management techniques like facet joint injection, epidural steroid injection, and radiofrequency ablation are used for pain relief.
The market also faces challenges such as the risk of spinal infections and revision surgeries. To mitigate these risks, surgical implants undergo rigorous testing and receive FDA approval. CE marking and other regulatory approvals ensure the safety and quality of these medical devices. Additionally, advancements in technology, such as the use of bone morphogenetic protein and cervical disc replacement, are expected to expand the market's scope. Despite the challenges, the market is expected to grow, driven by the increasing demand for minimally invasive surgical procedures and the need for pain relief and improved quality of life. Patient satisfaction and insurance coverage are also key factors influencing market growth.
Overall, the market is an evolving landscape, with a focus on innovation and cost-effectiveness.
The Static segment was valued at USD 45.00 million in 2018 and showed a gradual increase during the forecast period.
Regional Analysis
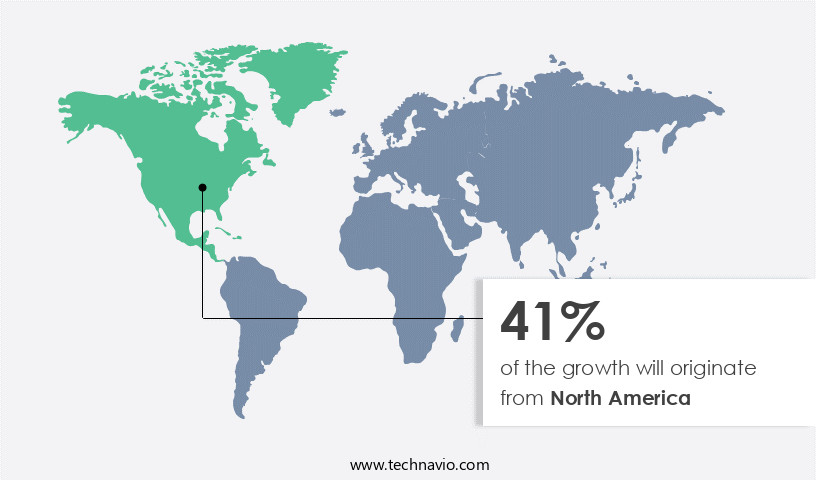
North America is estimated to contribute 41% to the growth of the global market during the forecast period. Technavio's analysts have elaborately explained the regional trends and drivers that shape the market during the forecast period.
The market is witnessing significant growth in North America, which holds the largest market share. This region's dominance is attributed to an expanding geriatric population suffering from degenerative disc diseases and lumbar spinal stenosis, the presence of major market competitors, increasing preference for minimally invasive surgical treatments, and frequent new product releases. Lumbar spinal stenosis, affecting over 200,000 adults in the US, is a significant reason for older adults opting for spine procedures. Consequently, the aging population's growth will fuel the demand for interspinous spacers throughout the forecast period. Clinical trials and research advancements continue to drive innovation in the market, with focus on enhancing functional capacity, pain relief, and biomechanical stability.
Spinal infections, spinal cord stimulation, and physical therapy are essential components of pain management strategies. Spinal mobility, recovery time, and quality of life are crucial factors for patients undergoing surgical procedures, such as spinal fusion, spinal implants, and disc arthroplasty. Cervical spondylosis, spinal stenosis, spinal tumors, and spinal canal stenosis are common conditions leading to the use of interspinous spacers. Minimally invasive surgery, facet joint degeneration, and epidural steroid injections are alternative treatments for managing back and neck pain. Revision surgeries and interspinous spacers with load sharing and stainless steel materials offer improved patient satisfaction. Healthcare costs and insurance coverage are essential considerations for patients undergoing interspinous spacer procedures.
FDA approval, ce marking, and functional outcomes are crucial factors for product development and market acceptance. Radiofrequency ablation, bone grafting, and bone morphogenetic protein are additional treatments used in conjunction with interspinous spacers. The market's evolving trends include the development of cervical disc replacement and disc arthroplasty technologies.
Market Dynamics
Our researchers analyzed the data with 2023 as the base year, along with the key drivers, trends, and challenges. A holistic analysis of drivers will help companies refine their marketing strategies to gain a competitive advantage.
What are the key market drivers leading to the rise in the adoption of Interspinous Spacers Industry?
- The surge in the incidence of spinal disorders serves as the primary catalyst for market growth in this sector.
- Interspinous spacers have gained significant attention in the healthcare industry due to their effectiveness in addressing various spine disorders, particularly those related to degenerative disc diseases, spondylolisthesis, prolapsed intervertebral disc, and spinal stenosis. The elderly population is disproportionately affected by these conditions, with osteoporosis being a significant contributing factor. This orthopedic condition weakens the bones, making individuals more susceptible to fractures, progressive spine deformities, and stenosis. As the population ages, the demand for surgical treatment for spine disorders and osteoporosis increases. Surgeons often opt for surgical procedures to alleviate pain, improve bone stability, and enhance overall quality of life.
- Interspinous spacers play a crucial role in these surgeries, providing adequate space between the vertebrae and reducing pressure on the affected disc. Clinical trials and research continue to validate the efficacy of interspinous spacers in treating various spine conditions. For instance, these devices have been shown to improve functional capacity and spinal mobility, leading to shorter recovery times and reduced need for physical therapy. Additionally, minimally invasive procedures like facet joint injections and spinal cord stimulation have gained popularity, further increasing the demand for interspinous spacers in outpatient care settings. In summary, the rising prevalence of spine disorders and osteoporosis, coupled with advancements in surgical procedures and minimally invasive treatments, is driving the demand for interspinous spacers in the healthcare industry.
- These devices offer a viable solution for managing pain, improving bone stability, and enhancing overall quality of life for patients.
What are the market trends shaping the Interspinous Spacers Industry?
- The trend in the market is being shaped by technological advances. This includes the adoption of innovative technologies and the continuous improvement of existing ones.
- The global market for spinal implants, including interspinous spacers, is driven by advancements in technology and the growing need for pain relief and biomechanical stability in patients with spinal conditions. Interspinous spacers, a type of surgical implant, are used to treat conditions such as cervical spondylosis, spinal stenosis, and spinal canal stenosis. These implants help maintain the normal spacing between vertebrae, reducing pressure on the spinal cord and nerves, and providing pain relief. The use of biocompatible materials and the integration of technologies like 3D printing enable the production of customized implants that offer better fit and functionality. Additionally, the incorporation of bone morphogenetic protein (BMP) in some implants promotes bone growth and enhances the fusion process during postoperative rehabilitation.
- The implementation of these advanced technologies in the production of interspinous spacers has expanded their therapeutic applications, addressing complex spinal issues that were previously challenging to treat with conventional implants. As a result, the market for these implants is expected to grow, offering potential benefits in terms of improved quality of life and reduced healthcare costs for patients.
What challenges does the Interspinous Spacers Industry face during its growth?
- The escalating costs linked to spine surgery represent a significant barrier to growth in the industry.
- Interspinous spacers are medical devices used in minimally invasive spinal surgeries to maintain or restore intervertebral disc height, alleviating conditions like lumbar stenosis and facet joint degeneration. The global market for these devices is driven by the increasing prevalence of spinal disorders, particularly among the elderly population. Conditions such as spinal tumors, degenerative disc diseases, scoliosis, and severe accidents leading to spine fractures fuel the demand for spinal fusion surgeries. Interspinous spacers are often used in these procedures as they facilitate load sharing and offer functional outcomes similar to fusion. However, high costs associated with these surgeries and the price of interspinous spacers can hinder their adoption in medium and small-sized hospitals.
- The European market, with its stringent regulatory requirements, including CE marking, further increases the cost of these devices. Despite these challenges, the market is expected to grow due to the superior clinical outcomes offered by interspinous spacers compared to traditional treatments like epidural steroid injections and revision surgeries.
Exclusive Customer Landscape
The interspinous spacers market forecasting report includes the adoption lifecycle of the market, covering from the innovator's stage to the laggard's stage. It focuses on adoption rates in different regions based on penetration. Furthermore, the interspinous spacers market report also includes key purchase criteria and drivers of price sensitivity to help companies evaluate and develop their market growth analysis strategies.
Customer Landscape
Key Companies & Market Insights
Companies are implementing various strategies, such as strategic alliances, interspinous spacers market forecast, partnerships, mergers and acquisitions, geographical expansion, and product/service launches, to enhance their presence in the industry.
Alphatec Holdings Inc. - The company specializes in providing interspinous spacers, including the Vertiflex Superion model, for minimally invasive treatment of lumbar spinal stenosis.
The industry research and growth report includes detailed analyses of the competitive landscape of the market and information about key companies, including:
- Alphatec Holdings Inc.
- Arca Medica GmbH
- BM KOREA Co. Ltd.
- Boston Scientific Corp.
- Cousin Biotech
- Globus Medical Inc.
- IMECO SA
- Johnson and Johnson Inc.
- Life Spine Inc.
- Medtronic Plc
- Medyssey USA Inc.
- Mikai SpA
- Minimus Spine Inc.
- Normmed Medikal ve Makina San. Tic. Ltd. Sti.
- Nuvasive Inc.
- Orthofix Medical Inc.
- RTI Surgical Inc.
- Spineart SA
- Zimmer Biomet Holdings Inc.
Qualitative and quantitative analysis of companies has been conducted to help clients understand the wider business environment as well as the strengths and weaknesses of key industry players. Data is qualitatively analyzed to categorize companies as pure play, category-focused, industry-focused, and diversified; it is quantitatively analyzed to categorize companies as dominant, leading, strong, tentative, and weak.
Recent Development and News in Interspinous Spacers Market
- In February 2023, Medtronic plc, a global healthcare solutions company, announced the FDA approval of its InfuseTech Interspinous Process Decompression System, an interspinous spacer featuring a unique design that allows for easier insertion and removal. This approval marks a significant advancement in the market, as the system aims to address the challenges associated with current spacer designs (Medtronic Press Release, 2023).
- In March 2024, Zimmer Biomet Holdings, Inc., a leading orthopedic and neuro technologies company, entered into a strategic partnership with NeuroArC, a neurotechnology company, to develop and commercialize innovative interspinous spacer solutions. This collaboration is expected to bring forth advanced technologies and expand the product portfolio for both companies, bolstering their presence in the market (Zimmer Biomet Press Release, 2024).
- In July 2024, NuVasive, Inc., a medical device company specializing in minimally disruptive surgical products, secured a USD 100 million investment from Blackstone Growth, a growth equity investment firm. The funds will be utilized to accelerate the development and commercialization of NuVasive's interspinous spacer portfolio, further solidifying their market position (NuVasive Press Release, 2024).
Research Analyst Overview
- The market encompasses innovative solutions for addressing spinal conditions in the cervical and lumbar regions. Key trends include the integration of advanced technologies such as surface treatment and implant design to enhance surgical outcomes and patient-reported outcomes. Cost-benefit analysis plays a crucial role in value-based healthcare, driving the adoption of interbody fusion and artificial discs over traditional methods. Medical innovation continues to advance with the exploration of gene therapy, stem cell therapy, and regenerative medicine. Predictive modeling and data analytics enable personalized medicine, while machine learning and artificial intelligence optimize surgical techniques and bone healing.
- Health economics and quality-adjusted life years remain focal points for health care decision-makers. Spinal instrumentation, including surface modification and bioresorbable materials, contribute to improved surgical outcomes and reduced recovery times. Precision medicine and healthcare technology further refine treatment approaches, ensuring optimal care for patients. Surgical techniques and artificial joints continue to evolve, with a focus on minimally invasive procedures and long-term outcomes.
Dive into Technavio's robust research methodology, blending expert interviews, extensive data synthesis, and validated models for unparalleled Interspinous Spacers Market insights. See full methodology.
|
Market Scope |
|
|
Report Coverage |
Details |
|
Page number |
161 |
|
Base year |
2023 |
|
Historic period |
2018-2022 |
|
Forecast period |
2024-2028 |
|
Growth momentum & CAGR |
Accelerate at a CAGR of 5.1% |
|
Market growth 2024-2028 |
USD 25.5 million |
|
Market structure |
Fragmented |
|
YoY growth 2023-2024(%) |
4.7 |
|
Key countries |
US, China, Germany, UK, and Canada |
|
Competitive landscape |
Leading Companies, Market Positioning of Companies, Competitive Strategies, and Industry Risks |
What are the Key Data Covered in this Interspinous Spacers Market Research and Growth Report?
- CAGR of the Interspinous Spacers industry during the forecast period
- Detailed information on factors that will drive the growth and forecasting between 2024 and 2028
- Precise estimation of the size of the market and its contribution of the industry in focus to the parent market
- Accurate predictions about upcoming growth and trends and changes in consumer behaviour
- Growth of the market across North America, Europe, Asia, and Rest of World (ROW)
- Thorough analysis of the market's competitive landscape and detailed information about companies
- Comprehensive analysis of factors that will challenge the interspinous spacers market growth of industry companies
We can help! Our analysts can customize this interspinous spacers market research report to meet your requirements.


