Inverter Duty Motor Market Analysis, Size, and Forecast 2026-2030: North America (US, Canada, and Mexico), APAC (China, India, and Japan), Europe (Germany, France, and UK), South America (Brazil and Argentina), Middle East and Africa (Saudi Arabia, UAE, and Turkey), and Rest of World (ROW)

Inverter Duty Motor Market Analysis, Size, and Forecast 2026-2030:
North America (US, Canada, and Mexico), APAC (China, India, and Japan), Europe (Germany, France, and UK), South America (Brazil and Argentina), Middle East and Africa (Saudi Arabia, UAE, and Turkey), and Rest of World (ROW)

Published: Jan 2026 296 Pages SKU: IRTNTR72603

Market Overview at a Glance

$2.54 B
Market Opportunity
8.9%
CAGR 2025 - 2030
35.8%
North America Growth
$1.74 B
Pumps segment 2024

Inverter Duty Motor Market Size 2026-2030

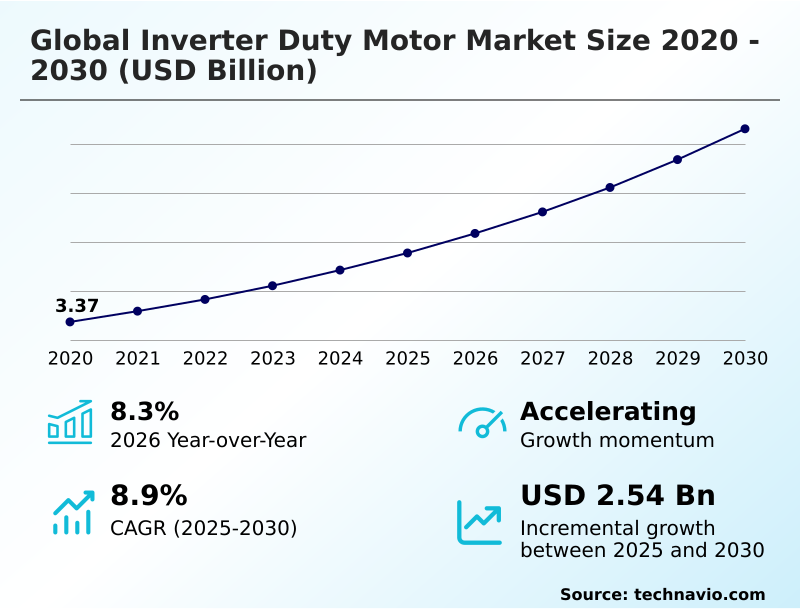
The inverter duty motor market size is valued to increase by USD 2.54 billion, at a CAGR of 8.9% from 2025 to 2030. Rising focus on energy efficiency regulations will drive the inverter duty motor market.

Major Market Trends & Insights

  • North America dominated the market and accounted for a 35.8% growth during the forecast period.
  • By Application - Pumps segment was valued at USD 1.74 billion in 2024
  • By End-user - Oil and gas segment accounted for the largest market revenue share in 2024

Market Size & Forecast

  • Market Opportunities: USD 3.95 billion
  • Market Future Opportunities: USD 2.54 billion
  • CAGR from 2025 to 2030 : 8.9%

Market Summary

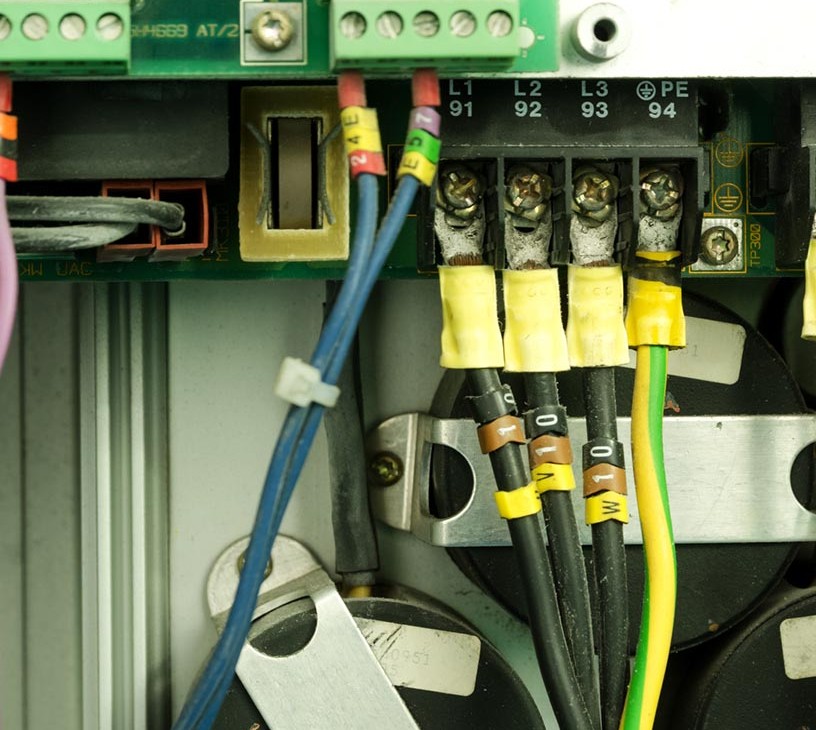
  • The Inverter Duty Motor Market is defined by a deep integration with the industrial motion control system and a relentless pursuit of energy efficiency. These specialized motors are engineered for variable frequency drive compatibility, featuring an enhanced motor insulation system to handle stresses from a non-sinusoidal voltage waveform, making them essential for applications requiring constant torque at low speed.
  • A key driver is the global regulatory push for premium efficiency motor standards, compelling industries to upgrade. Consequently, designs incorporate advanced motor thermal management and an inter-laminar insulation coating to prevent premature failure.
  • For example, a food processing motor application in a large-scale plant can achieve operational gains by retrofitting its lines with these motors, which feature predictive motor maintenance capabilities. This reduces energy consumption and minimizes downtime from issues like bearing current damage prevention.
  • While initial investment for an integrated motor-drive package is higher, the long-term motor lifecycle cost is lower, making it a sound decision for any process industry motor.

What will be the Size of the Inverter Duty Motor Market during the forecast period?

Get Key Insights on Market Forecast (PDF) Request Free Sample

How is the Inverter Duty Motor Market Segmented?

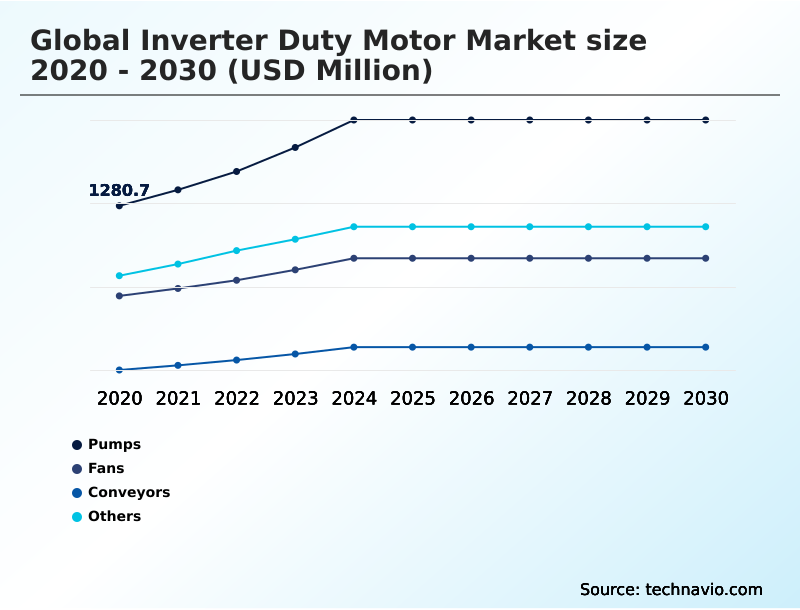
The inverter duty motor industry research report provides comprehensive data (region-wise segment analysis), with forecasts and estimates in "USD million" for the period 2026-2030, as well as historical data from 2020-2024 for the following segments.

  • Application
    • Pumps
    • Fans
    • Conveyors
    • Others
  • End-user
    • Oil and gas
    • Chemicals
    • Metal and mining
    • Food and beverages
    • Others
  • Material type
    • Laminated steel
    • Cast iron
    • Aluminum
  • Geography
    • North America
      • US
      • Canada
      • Mexico
    • APAC
      • China
      • India
      • Japan
    • Europe
      • Germany
      • France
      • UK
    • South America
      • Brazil
      • Argentina
    • Middle East and Africa
      • Saudi Arabia
      • UAE
      • Turkey
    • Rest of World (ROW)

By Application Insights

The pumps segment is estimated to witness significant growth during the forecast period.

The pumps segment is central to the inverter duty motor market, driven by a global push for efficiency in fluid handling.

In industrial processes, operators achieve significant energy savings by using these motors with variable frequency drives to match pump speed to flow demand. For instance, a 20% reduction in pump speed can cut energy use by nearly 50%.

This capability is critical in water management and industrial applications. Modern solutions often feature an integrated motor-drive package and leverage electrical signature analysis for predictive motor maintenance.

This focus on an industrial motion control system with integrated motor diagnostics ensures reliable motor operation and supports demand for custom engineered motor designs with high power density motor configurations, optimizing lifecycle performance over initial cost.

Request Free Sample

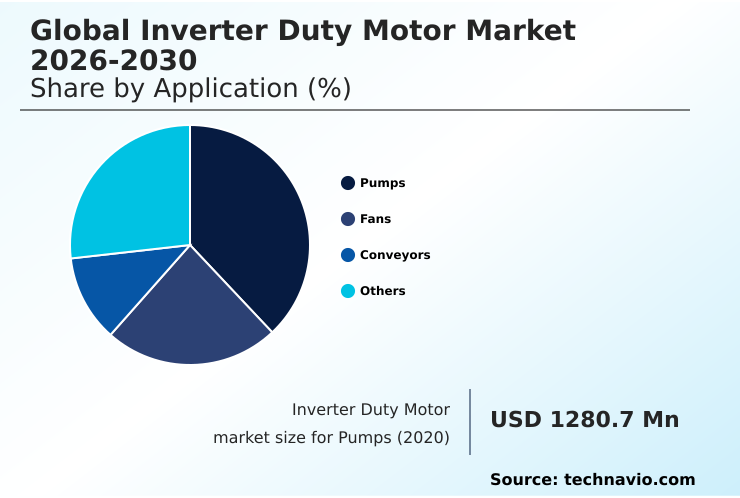
The Pumps segment was valued at USD 1.74 billion in 2024 and showed a gradual increase during the forecast period.

Request Free Sample

Regional Analysis

North America is estimated to contribute 35.8% to the growth of the global market during the forecast period.Technavio’s analysts have elaborately explained the regional trends and drivers that shape the market during the forecast period.

See How Inverter Duty Motor Market Demand is Rising in North America Request Free Sample

North America is projected to be a significant contributor to market growth, accounting for approximately 35.8% of the incremental expansion. This is driven by stringent energy regulations and the modernization of industrial infrastructure.

In sectors like oil and gas, the use of an oil and gas pump motor with an explosion-proof motor design is critical. The push towards higher efficiency in wastewater treatment motor applications and food processing motor systems also fuels demand.

Manufacturers are using high-grade electrical steel and advanced inter-laminar insulation coating on high dV/dt motor winding to meet flame-proof motor standards.

The region's focus on adopting high-performance motor winding technology in every process industry motor reinforces its leading position, with facilities reporting up to a 25% improvement in operational uptime after upgrading their motor systems.

Market Dynamics

Our researchers analyzed the data with 2025 as the base year, along with the key drivers, trends, and challenges. A holistic analysis of drivers will help companies refine their marketing strategies to gain a competitive advantage.

  • Navigating the specifics of the Global Inverter Duty Motor Market 2026-2030 requires a deep dive into application-specific requirements. For example, selecting an inverter duty motor for high ambient temperature conditions demands different specifications than one for washdown environments.
  • A frequent point of evaluation involves understanding the benefits of inverter duty motor vs standard motor, where the former offers superior performance under variable loads, reducing instances of troubleshooting inverter duty motor overheating. A critical specification is the inverter duty motor insulation class requirements, which dictate resilience against voltage spikes.
  • For reliability, an inverter duty motor shaft grounding selection guide is essential to prevent premature inverter duty motor bearing failure analysis issues, often caused by the impact of long motor leads on inverter duty motors. In practical terms, these motors are fundamental to achieving precise control in constant pressure pump systems and material handling conveyor systems.
  • Their use in HVAC air handler units and for variable torque applications showcases their versatility. The decision on how to select an inverter duty motor for extruders depends on torque needs, while comparing cast iron vs aluminum inverter duty motors involves a trade-off between durability and weight.
  • The inverter duty motor total cost of ownership calculator often reveals that retrofitting standard motor with inverter duty motor yields a positive ROI, with some systems with an inverter duty motor with integrated encoder feedback achieving double the precision.
  • NEMA premium inverter duty motor specifications and ensuring inverter duty motor compliance with energy regulations are non-negotiable for modern industrial facilities, especially those with a hazardous area classification.

What are the key market drivers leading to the rise in the adoption of Inverter Duty Motor Industry?

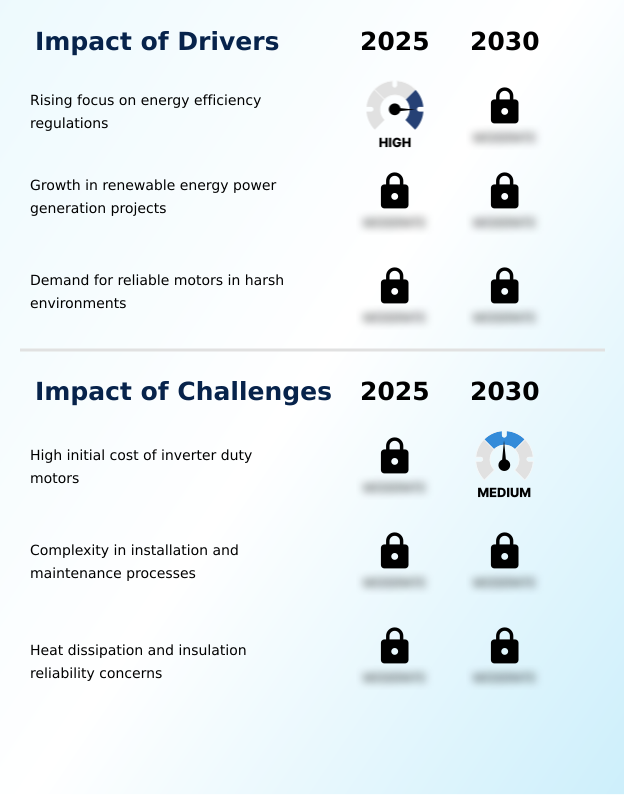
  • A rising focus on stringent energy efficiency regulations worldwide is a key driver compelling industries to adopt advanced inverter duty motor technologies.

  • The market is primarily driven by regulations mandating premium efficiency motor standards and the pursuit of lower operational expenditures.
  • Analyzing motor lifecycle cost reveals that energy expenses constitute the vast majority of a motor's total cost of ownership motor, making efficiency a key investment criterion.
  • The use of an industrial pump motor or conveyor system motor with variable speed control can reduce energy consumption by up to 50%.
  • The underlying technology, including advanced rotor and stator core material and effective motor thermal management, mitigates the negative pulse width modulation effects.
  • The adoption of shaft grounding ring technology has become crucial for reliability, decreasing drive-related bearing failures by more than 60% in applications like the HVAC fan motor, directly impacting maintenance budgets and uptime.

What are the market trends shaping the Inverter Duty Motor Industry?

  • The rising adoption of inverter duty motors in industrial automation systems is emerging as a significant market trend. This is driven by the need for enhanced productivity, precision, and efficiency in modern manufacturing.

  • The primary trend is the deepening integration of the industrial automation motor into smart manufacturing ecosystems. This evolution is driven by the need for a VFD-rated electric motor that offers not just an energy-efficient motor solution but also superior control and data generation.
  • Modern motors feature an enhanced motor insulation system for high voltage spike resistance, ensuring reliability in a harsh environment motor application. This variable frequency drive compatibility allows for constant torque at low speed, a critical requirement in robotics and precision conveying, improving process consistency by over 15%.
  • Furthermore, this advanced variable speed motor application reduces mechanical stress on equipment, extending asset life by up to 25% compared to fixed-speed alternatives.

What challenges does the Inverter Duty Motor Industry face during its growth?

  • The high initial cost of inverter duty motors remains a key challenge, potentially slowing adoption for companies prioritizing short-term affordability over long-term operational savings.

  • Despite clear benefits, the market faces challenges related to complexity and cost. A primary hurdle is the higher upfront investment for motors compliant with IE4 and IE5 efficiency classes, which can be a barrier for some operators. These motors are designed to handle a non-sinusoidal voltage waveform, which necessitates advanced engineering and materials.
  • For a motor for hazardous location or a heavy industry electric motor, the design must also ensure bearing current damage prevention from phenomena like electrical discharge machining damage. Implementing a smart factory motor with intelligent motor control requires specialized skills, adding to initial setup costs.
  • In some severe-duty motor application scenarios, retrofitting legacy systems presents integration complexities that can delay projects and inflate budgets by up to 20%.

Exclusive Technavio Analysis on Customer Landscape

The inverter duty motor market forecasting report includes the adoption lifecycle of the market, covering from the innovator’s stage to the laggard’s stage. It focuses on adoption rates in different regions based on penetration. Furthermore, the inverter duty motor market report also includes key purchase criteria and drivers of price sensitivity to help companies evaluate and develop their market growth analysis strategies.

Customer Landscape of Inverter Duty Motor Industry

Competitive Landscape

Companies are implementing various strategies, such as strategic alliances, inverter duty motor market forecast, partnerships, mergers and acquisitions, geographical expansion, and product/service launches, to enhance their presence in the industry.

ABB Ltd. - Key offerings include AC inverter, vector duty, and RPM AC motors engineered for superior performance and reliability in demanding variable speed applications.

The industry research and growth report includes detailed analyses of the competitive landscape of the market and information about key companies, including:

  • ABB Ltd.
  • Adlee Powertronic Co. Ltd.
  • Bison Gear And Engineering Co
  • Bodine Electric Company
  • Havells India Ltd.
  • Megha Roto Tech Pvt. Ltd.
  • Nidec Corp.
  • Nord Gear Corp.
  • Regal Rexnord Corp.
  • Rockwell Automation Inc.
  • SEW EURODRIVE
  • Synchronics Electronics
  • TECO-Westinghouse
  • Toshiba Corp.
  • WEG S.A
  • Yaskawa Electric Corp.

Qualitative and quantitative analysis of companies has been conducted to help clients understand the wider business environment as well as the strengths and weaknesses of key industry players. Data is qualitatively analyzed to categorize companies as pure play, category-focused, industry-focused, and diversified; it is quantitatively analyzed to categorize companies as dominant, leading, strong, tentative, and weak.

Recent Development and News in Inverter duty motor market

  • In September, 2024, WEG S.A. announced the acquisition of Volt Electric Motors in Turkey to enhance its market presence in Eastern Europe and the Middle East.
  • In November, 2024, Nidec Corp. inaugurated a new manufacturing facility in Sri City, India, to address the growing regional demand for industrial motors.
  • In January, 2025, ABB launched its Baldor-Reliance Food Safe SP5+ motor, an ultra-premium efficient model designed with advanced rotor technology for the food processing industry.
  • In April, 2025, WEG S.A. disclosed significant investments to increase its low-voltage motor production capacity in Lissone, Italy, aiming to strengthen its European service levels.

Dive into Technavio’s robust research methodology, blending expert interviews, extensive data synthesis, and validated models for unparalleled Inverter Duty Motor Market insights. See full methodology.

Market Scope
Page number 296
Base year 2025
Historic period 2020-2024
Forecast period 2026-2030
Growth momentum & CAGR Accelerate at a CAGR of 8.9%
Market growth 2026-2030 USD 2542.2 million
Market structure Fragmented
YoY growth 2025-2026(%) 8.3%
Key countries US, Canada, Mexico, China, India, Japan, South Korea, Australia, Indonesia, Germany, France, UK, Italy, Spain, The Netherlands, Brazil, Argentina, Chile, Saudi Arabia, UAE, Turkey, South Africa and Egypt
Competitive landscape Leading Companies, Market Positioning of Companies, Competitive Strategies, and Industry Risks

Request Free Sample

Research Analyst Overview

  • The landscape for inverter duty motors is shaped by the convergence of automation and energy mandates. A core competency is variable frequency drive compatibility, which necessitates an enhanced motor insulation system capable of withstanding significant voltage spike resistance. The challenge of harmonic distortion mitigation is addressed through superior rotor and stator core material and advanced motor thermal management.
  • Technologies like the shaft grounding ring technology are now standard for bearing current damage prevention, a common failure point stemming from electrical discharge machining damage. Adherence to premium efficiency motor standards, including NEMA premium efficiency levels and the stringent IE4 and IE5 efficiency classes, is no longer optional.
  • These motors are designed to operate on a non-sinusoidal voltage waveform without degradation, a result of robust high dV/dt motor winding and the use of high-grade electrical steel with a resilient inter-laminar insulation coating. The market offers explosion-proof motor design and models meeting flame-proof motor standards, often delivered as an integrated motor-drive package.
  • As part of an industrial motion control system, these motors leverage electrical signature analysis for predictive motor maintenance, with some industrial operators reporting a 30% reduction in unplanned downtime.

What are the Key Data Covered in this Inverter Duty Motor Market Research and Growth Report?

  • What is the expected growth of the Inverter Duty Motor Market between 2026 and 2030?

    • USD 2.54 billion, at a CAGR of 8.9%

  • What segmentation does the market report cover?

    • The report is segmented by Application (Pumps, Fans, Conveyors, and Others), End-user (Oil and gas, Chemicals, Metal and mining, Food and beverages, and Others), Material Type (Laminated steel, Cast iron, and Aluminum) and Geography (North America, APAC, Europe, South America, Middle East and Africa)

  • Which regions are analyzed in the report?

    • North America, APAC, Europe, South America and Middle East and Africa

  • What are the key growth drivers and market challenges?

    • Rising focus on energy efficiency regulations, High initial cost of inverter duty motors

  • Who are the major players in the Inverter Duty Motor Market?

    • ABB Ltd., Adlee Powertronic Co. Ltd., Bison Gear And Engineering Co, Bodine Electric Company, Havells India Ltd., Megha Roto Tech Pvt. Ltd., Nidec Corp., Nord Gear Corp., Regal Rexnord Corp., Rockwell Automation Inc., SEW EURODRIVE, Synchronics Electronics, TECO-Westinghouse, Toshiba Corp., WEG S.A and Yaskawa Electric Corp.

Market Research Insights

  • The market's momentum is fueled by a strategic shift toward intelligent manufacturing, where operational efficiency is paramount. The adoption of an energy-efficient motor solution can reduce energy consumption by up to 50% in variable torque applications, directly improving a firm's bottom line.
  • Furthermore, the integration of a VFD-rated electric motor in production lines enhances process control, with some systems reporting a 15% increase in output consistency. The focus on total cost of ownership motor analysis over initial purchase price is becoming standard practice.
  • For a harsh environment motor application, reliable motor operation is critical, and these specialized motors deliver superior performance, with failure rates nearly 40% lower than standard motors under similar variable speed conditions. This shift underscores the value of investing in specialized technology for long-term industrial resilience.

We can help! Our analysts can customize this inverter duty motor market research report to meet your requirements.

Get in touch

1. Executive Summary

1.1 Market overview

Executive Summary - Chart on Market Overview
Executive Summary - Data Table on Market Overview
Executive Summary - Chart on Global Market Characteristics
Executive Summary - Chart on Market by Geography
Executive Summary - Chart on Market Segmentation by Application
Executive Summary - Chart on Market Segmentation by End-user
Executive Summary - Chart on Market Segmentation by Material Type
Executive Summary - Chart on Incremental Growth
Executive Summary - Data Table on Incremental Growth
Executive Summary - Chart on Company Market Positioning

2. Technavio Analysis

2.1 Analysis of price sensitivity, lifecycle, customer purchase basket, adoption rates, and purchase criteria

2.2 Criticality of inputs and Factors of differentiation

Chart on Overview on criticality of inputs and factors of differentiation

2.3 Factors of disruption

Chart on Overview on factors of disruption

2.4 Impact of drivers and challenges

Chart on Impact of drivers and challenges in 2025 and 2030

3. Market Landscape

3.1 Market ecosystem

Chart on Parent Market
Data Table on - Parent Market

3.2 Market characteristics

Chart on Market characteristics analysis

3.3 Value chain analysis

Chart on Value chain analysis

4. Market Sizing

4.1 Market definition

Data Table on Offerings of companies included in the market definition

4.2 Market segment analysis

Market segments

4.3 Market size 2025

4.4 Market outlook: Forecast for 2025-2030

Chart on Global - Market size and forecast 2025-2030 ($ million)
Data Table on Global - Market size and forecast 2025-2030 ($ million)
Chart on Global Market: Year-over-year growth 2025-2030 (%)
Data Table on Global Market: Year-over-year growth 2025-2030 (%)

5. Historic Market Size

5.1 Global Inverter Duty Motor Market 2020 - 2024

Historic Market Size - Data Table on Global Inverter Duty Motor Market 2020 - 2024 ($ million)

5.2 Application segment analysis 2020 - 2024

Historic Market Size - Application Segment 2020 - 2024 ($ million)

5.3 End-user segment analysis 2020 - 2024

Historic Market Size - End-user Segment 2020 - 2024 ($ million)

5.4 Material Type segment analysis 2020 - 2024

Historic Market Size - Material Type Segment 2020 - 2024 ($ million)

5.5 Geography segment analysis 2020 - 2024

Historic Market Size - Geography Segment 2020 - 2024 ($ million)

5.6 Country segment analysis 2020 - 2024

Historic Market Size - Country Segment 2020 - 2024 ($ million)

6. Qualitative Analysis

6.1 Impact of AI on Global Inverter Duty Motor Market

7. Five Forces Analysis

7.1 Five forces summary

Five forces analysis - Comparison between 2025 and 2030

7.2 Bargaining power of buyers

Bargaining power of buyers - Impact of key factors 2025 and 2030

7.3 Bargaining power of suppliers

Bargaining power of suppliers - Impact of key factors in 2025 and 2030

7.4 Threat of new entrants

Threat of new entrants - Impact of key factors in 2025 and 2030

7.5 Threat of substitutes

Threat of substitutes - Impact of key factors in 2025 and 2030

7.6 Threat of rivalry

Threat of rivalry - Impact of key factors in 2025 and 2030

7.7 Market condition

Chart on Market condition - Five forces 2025 and 2030

8. Market Segmentation by Application

8.1 Market segments

Chart on Application - Market share 2025-2030 (%)
Data Table on Application - Market share 2025-2030 (%)

8.2 Comparison by Application

Chart on Comparison by Application
Data Table on Comparison by Application

8.3 Pumps - Market size and forecast 2025-2030

Chart on Pumps - Market size and forecast 2025-2030 ($ million)
Data Table on Pumps - Market size and forecast 2025-2030 ($ million)
Chart on Pumps - Year-over-year growth 2025-2030 (%)
Data Table on Pumps - Year-over-year growth 2025-2030 (%)

8.4 Fans - Market size and forecast 2025-2030

Chart on Fans - Market size and forecast 2025-2030 ($ million)
Data Table on Fans - Market size and forecast 2025-2030 ($ million)
Chart on Fans - Year-over-year growth 2025-2030 (%)
Data Table on Fans - Year-over-year growth 2025-2030 (%)

8.5 Conveyors - Market size and forecast 2025-2030

Chart on Conveyors - Market size and forecast 2025-2030 ($ million)
Data Table on Conveyors - Market size and forecast 2025-2030 ($ million)
Chart on Conveyors - Year-over-year growth 2025-2030 (%)
Data Table on Conveyors - Year-over-year growth 2025-2030 (%)

8.6 Others - Market size and forecast 2025-2030

Chart on Others - Market size and forecast 2025-2030 ($ million)
Data Table on Others - Market size and forecast 2025-2030 ($ million)
Chart on Others - Year-over-year growth 2025-2030 (%)
Data Table on Others - Year-over-year growth 2025-2030 (%)

8.7 Market opportunity by Application

Market opportunity by Application ($ million)
Data Table on Market opportunity by Application ($ million)

9. Market Segmentation by End-user

9.1 Market segments

Chart on End-user - Market share 2025-2030 (%)
Data Table on End-user - Market share 2025-2030 (%)

9.2 Comparison by End-user

Chart on Comparison by End-user
Data Table on Comparison by End-user

9.3 Oil and gas - Market size and forecast 2025-2030

Chart on Oil and gas - Market size and forecast 2025-2030 ($ million)
Data Table on Oil and gas - Market size and forecast 2025-2030 ($ million)
Chart on Oil and gas - Year-over-year growth 2025-2030 (%)
Data Table on Oil and gas - Year-over-year growth 2025-2030 (%)

9.4 Chemicals - Market size and forecast 2025-2030

Chart on Chemicals - Market size and forecast 2025-2030 ($ million)
Data Table on Chemicals - Market size and forecast 2025-2030 ($ million)
Chart on Chemicals - Year-over-year growth 2025-2030 (%)
Data Table on Chemicals - Year-over-year growth 2025-2030 (%)

9.5 Metal and mining - Market size and forecast 2025-2030

Chart on Metal and mining - Market size and forecast 2025-2030 ($ million)
Data Table on Metal and mining - Market size and forecast 2025-2030 ($ million)
Chart on Metal and mining - Year-over-year growth 2025-2030 (%)
Data Table on Metal and mining - Year-over-year growth 2025-2030 (%)

9.6 Food and beverages - Market size and forecast 2025-2030

Chart on Food and beverages - Market size and forecast 2025-2030 ($ million)
Data Table on Food and beverages - Market size and forecast 2025-2030 ($ million)
Chart on Food and beverages - Year-over-year growth 2025-2030 (%)
Data Table on Food and beverages - Year-over-year growth 2025-2030 (%)

9.7 Others - Market size and forecast 2025-2030

Chart on Others - Market size and forecast 2025-2030 ($ million)
Data Table on Others - Market size and forecast 2025-2030 ($ million)
Chart on Others - Year-over-year growth 2025-2030 (%)
Data Table on Others - Year-over-year growth 2025-2030 (%)

9.8 Market opportunity by End-user

Market opportunity by End-user ($ million)
Data Table on Market opportunity by End-user ($ million)

10. Market Segmentation by Material Type

10.1 Market segments

Chart on Market Segmentation by Material Type - Market share 2025-2030 (%)
Data Table on Market Segmentation by Material Type - Market share 2025-2030 (%)

10.2 Comparison by Market Segmentation by Material Type

Chart on Comparison by Market Segmentation by Material Type
Data Table on Comparison by Market Segmentation by Material Type

10.3 Laminated steel - Market size and forecast 2025-2030

Chart on Laminated steel - Market size and forecast 2025-2030 ($ million)
Data Table on Laminated steel - Market size and forecast 2025-2030 ($ million)
Chart on Laminated steel - Year-over-year growth 2025-2030 (%)
Data Table on Laminated steel - Year-over-year growth 2025-2030 (%)

10.4 Cast iron - Market size and forecast 2025-2030

Chart on Cast iron - Market size and forecast 2025-2030 ($ million)
Data Table on Cast iron - Market size and forecast 2025-2030 ($ million)
Chart on Cast iron - Year-over-year growth 2025-2030 (%)
Data Table on Cast iron - Year-over-year growth 2025-2030 (%)

10.5 Aluminum - Market size and forecast 2025-2030

Chart on Aluminum - Market size and forecast 2025-2030 ($ million)
Data Table on Aluminum - Market size and forecast 2025-2030 ($ million)
Chart on Aluminum - Year-over-year growth 2025-2030 (%)
Data Table on Aluminum - Year-over-year growth 2025-2030 (%)

10.6 Market opportunity by Market Segmentation by Material Type

Market opportunity by Market Segmentation by Material Type ($ million)
Data Table on Market opportunity by Market Segmentation by Material Type ($ million)

11. Customer Landscape

11.1 Customer landscape overview

Analysis of price sensitivity, lifecycle, customer purchase basket, adoption rates, and purchase criteria

12. Geographic Landscape

12.1 Geographic segmentation

Chart on Market share by geography 2025-2030 (%)
Data Table on Market share by geography 2025-2030 (%)

12.2 Geographic comparison

Chart on Geographic comparison
Data Table on Geographic comparison

12.3 North America - Market size and forecast 2025-2030

Chart on North America - Market size and forecast 2025-2030 ($ million)
Data Table on North America - Market size and forecast 2025-2030 ($ million)
Chart on North America - Year-over-year growth 2025-2030 (%)
Data Table on North America - Year-over-year growth 2025-2030 (%)
Chart on Regional Comparison - North America
Data Table on Regional Comparison - North America

12.3.1 US - Market size and forecast 2025-2030

Chart on US - Market size and forecast 2025-2030 ($ million)
Data Table on US - Market size and forecast 2025-2030 ($ million)
Chart on US - Year-over-year growth 2025-2030 (%)
Data Table on US - Year-over-year growth 2025-2030 (%)

12.3.2 Canada - Market size and forecast 2025-2030

Chart on Canada - Market size and forecast 2025-2030 ($ million)
Data Table on Canada - Market size and forecast 2025-2030 ($ million)
Chart on Canada - Year-over-year growth 2025-2030 (%)
Data Table on Canada - Year-over-year growth 2025-2030 (%)

12.3.3 Mexico - Market size and forecast 2025-2030

Chart on Mexico - Market size and forecast 2025-2030 ($ million)
Data Table on Mexico - Market size and forecast 2025-2030 ($ million)
Chart on Mexico - Year-over-year growth 2025-2030 (%)
Data Table on Mexico - Year-over-year growth 2025-2030 (%)

12.4 APAC - Market size and forecast 2025-2030

Chart on APAC - Market size and forecast 2025-2030 ($ million)
Data Table on APAC - Market size and forecast 2025-2030 ($ million)
Chart on APAC - Year-over-year growth 2025-2030 (%)
Data Table on APAC - Year-over-year growth 2025-2030 (%)
Chart on Regional Comparison - APAC
Data Table on Regional Comparison - APAC

12.4.1 China - Market size and forecast 2025-2030

Chart on China - Market size and forecast 2025-2030 ($ million)
Data Table on China - Market size and forecast 2025-2030 ($ million)
Chart on China - Year-over-year growth 2025-2030 (%)
Data Table on China - Year-over-year growth 2025-2030 (%)

12.4.2 India - Market size and forecast 2025-2030

Chart on India - Market size and forecast 2025-2030 ($ million)
Data Table on India - Market size and forecast 2025-2030 ($ million)
Chart on India - Year-over-year growth 2025-2030 (%)
Data Table on India - Year-over-year growth 2025-2030 (%)

12.4.3 Japan - Market size and forecast 2025-2030

Chart on Japan - Market size and forecast 2025-2030 ($ million)
Data Table on Japan - Market size and forecast 2025-2030 ($ million)
Chart on Japan - Year-over-year growth 2025-2030 (%)
Data Table on Japan - Year-over-year growth 2025-2030 (%)

12.4.4 South Korea - Market size and forecast 2025-2030

Chart on South Korea - Market size and forecast 2025-2030 ($ million)
Data Table on South Korea - Market size and forecast 2025-2030 ($ million)
Chart on South Korea - Year-over-year growth 2025-2030 (%)
Data Table on South Korea - Year-over-year growth 2025-2030 (%)

12.4.5 Australia - Market size and forecast 2025-2030

Chart on Australia - Market size and forecast 2025-2030 ($ million)
Data Table on Australia - Market size and forecast 2025-2030 ($ million)
Chart on Australia - Year-over-year growth 2025-2030 (%)
Data Table on Australia - Year-over-year growth 2025-2030 (%)

12.4.6 Indonesia - Market size and forecast 2025-2030

Chart on Indonesia - Market size and forecast 2025-2030 ($ million)
Data Table on Indonesia - Market size and forecast 2025-2030 ($ million)
Chart on Indonesia - Year-over-year growth 2025-2030 (%)
Data Table on Indonesia - Year-over-year growth 2025-2030 (%)

12.5 Europe - Market size and forecast 2025-2030

Chart on Europe - Market size and forecast 2025-2030 ($ million)
Data Table on Europe - Market size and forecast 2025-2030 ($ million)
Chart on Europe - Year-over-year growth 2025-2030 (%)
Data Table on Europe - Year-over-year growth 2025-2030 (%)
Chart on Regional Comparison - Europe
Data Table on Regional Comparison - Europe

12.5.1 Germany - Market size and forecast 2025-2030

Chart on Germany - Market size and forecast 2025-2030 ($ million)
Data Table on Germany - Market size and forecast 2025-2030 ($ million)
Chart on Germany - Year-over-year growth 2025-2030 (%)
Data Table on Germany - Year-over-year growth 2025-2030 (%)

12.5.2 France - Market size and forecast 2025-2030

Chart on France - Market size and forecast 2025-2030 ($ million)
Data Table on France - Market size and forecast 2025-2030 ($ million)
Chart on France - Year-over-year growth 2025-2030 (%)
Data Table on France - Year-over-year growth 2025-2030 (%)

12.5.3 UK - Market size and forecast 2025-2030

Chart on UK - Market size and forecast 2025-2030 ($ million)
Data Table on UK - Market size and forecast 2025-2030 ($ million)
Chart on UK - Year-over-year growth 2025-2030 (%)
Data Table on UK - Year-over-year growth 2025-2030 (%)

12.5.4 Italy - Market size and forecast 2025-2030

Chart on Italy - Market size and forecast 2025-2030 ($ million)
Data Table on Italy - Market size and forecast 2025-2030 ($ million)
Chart on Italy - Year-over-year growth 2025-2030 (%)
Data Table on Italy - Year-over-year growth 2025-2030 (%)

12.5.5 Spain - Market size and forecast 2025-2030

Chart on Spain - Market size and forecast 2025-2030 ($ million)
Data Table on Spain - Market size and forecast 2025-2030 ($ million)
Chart on Spain - Year-over-year growth 2025-2030 (%)
Data Table on Spain - Year-over-year growth 2025-2030 (%)

12.5.6 The Netherlands - Market size and forecast 2025-2030

Chart on The Netherlands - Market size and forecast 2025-2030 ($ million)
Data Table on The Netherlands - Market size and forecast 2025-2030 ($ million)
Chart on The Netherlands - Year-over-year growth 2025-2030 (%)
Data Table on The Netherlands - Year-over-year growth 2025-2030 (%)

12.6 South America - Market size and forecast 2025-2030

Chart on South America - Market size and forecast 2025-2030 ($ million)
Data Table on South America - Market size and forecast 2025-2030 ($ million)
Chart on South America - Year-over-year growth 2025-2030 (%)
Data Table on South America - Year-over-year growth 2025-2030 (%)
Chart on Regional Comparison - South America
Data Table on Regional Comparison - South America

12.6.1 Brazil - Market size and forecast 2025-2030

Chart on Brazil - Market size and forecast 2025-2030 ($ million)
Data Table on Brazil - Market size and forecast 2025-2030 ($ million)
Chart on Brazil - Year-over-year growth 2025-2030 (%)
Data Table on Brazil - Year-over-year growth 2025-2030 (%)

12.6.2 Argentina - Market size and forecast 2025-2030

Chart on Argentina - Market size and forecast 2025-2030 ($ million)
Data Table on Argentina - Market size and forecast 2025-2030 ($ million)
Chart on Argentina - Year-over-year growth 2025-2030 (%)
Data Table on Argentina - Year-over-year growth 2025-2030 (%)

12.6.3 Chile - Market size and forecast 2025-2030

Chart on Chile - Market size and forecast 2025-2030 ($ million)
Data Table on Chile - Market size and forecast 2025-2030 ($ million)
Chart on Chile - Year-over-year growth 2025-2030 (%)
Data Table on Chile - Year-over-year growth 2025-2030 (%)

12.7 Middle East and Africa - Market size and forecast 2025-2030

Chart on Middle East and Africa - Market size and forecast 2025-2030 ($ million)
Data Table on Middle East and Africa - Market size and forecast 2025-2030 ($ million)
Chart on Middle East and Africa - Year-over-year growth 2025-2030 (%)
Data Table on Middle East and Africa - Year-over-year growth 2025-2030 (%)
Chart on Regional Comparison - Middle East and Africa
Data Table on Regional Comparison - Middle East and Africa

12.7.1 Saudi Arabia - Market size and forecast 2025-2030

Chart on Saudi Arabia - Market size and forecast 2025-2030 ($ million)
Data Table on Saudi Arabia - Market size and forecast 2025-2030 ($ million)
Chart on Saudi Arabia - Year-over-year growth 2025-2030 (%)
Data Table on Saudi Arabia - Year-over-year growth 2025-2030 (%)

12.7.2 UAE - Market size and forecast 2025-2030

Chart on UAE - Market size and forecast 2025-2030 ($ million)
Data Table on UAE - Market size and forecast 2025-2030 ($ million)
Chart on UAE - Year-over-year growth 2025-2030 (%)
Data Table on UAE - Year-over-year growth 2025-2030 (%)

12.7.3 Turkey - Market size and forecast 2025-2030

Chart on Turkey - Market size and forecast 2025-2030 ($ million)
Data Table on Turkey - Market size and forecast 2025-2030 ($ million)
Chart on Turkey - Year-over-year growth 2025-2030 (%)
Data Table on Turkey - Year-over-year growth 2025-2030 (%)

12.7.4 South Africa - Market size and forecast 2025-2030

Chart on South Africa - Market size and forecast 2025-2030 ($ million)
Data Table on South Africa - Market size and forecast 2025-2030 ($ million)
Chart on South Africa - Year-over-year growth 2025-2030 (%)
Data Table on South Africa - Year-over-year growth 2025-2030 (%)

12.7.5 Egypt - Market size and forecast 2025-2030

Chart on Egypt - Market size and forecast 2025-2030 ($ million)
Data Table on Egypt - Market size and forecast 2025-2030 ($ million)
Chart on Egypt - Year-over-year growth 2025-2030 (%)
Data Table on Egypt - Year-over-year growth 2025-2030 (%)

12.8 Market opportunity by geography

Market opportunity by geography ($ million)
Data Tables on Market opportunity by geography ($ million)

13. Drivers, Challenges, and Opportunity

13.1 Market drivers

Rising focus on energy efficiency regulations
Growth in renewable energy power generation projects
Demand for reliable motors in harsh environments

13.2 Market challenges

High initial cost of inverter duty motors
Complexity in installation and maintenance processes
Heat dissipation and insulation reliability concerns

13.3 Impact of drivers and challenges

Impact of drivers and challenges in 2025 and 2030

13.4 Market opportunities

Rising adoption in industrial automation systems
Integration with variable frequency drive technology
Growing demand for energy-efficient motor solutions

14. Competitive Landscape

14.1 Overview

14.2

Overview on criticality of inputs and factors of differentiation

14.3 Landscape disruption

Overview on factors of disruption

14.4 Industry risks

Impact of key risks on business

15. Competitive Analysis

15.1 Companies profiled

Companies covered

15.2 Company ranking index

15.3 Market positioning of companies

Matrix on companies position and classification

15.4 ABB Ltd.

ABB Ltd. - Overview
ABB Ltd. - Business segments
ABB Ltd. - Key news
ABB Ltd. - Key offerings
ABB Ltd. - Segment focus
SWOT

15.5 Adlee Powertronic Co. Ltd.

Adlee Powertronic Co. Ltd. - Overview
Adlee Powertronic Co. Ltd. - Product / Service
Adlee Powertronic Co. Ltd. - Key offerings
SWOT

15.6 Bison Gear And Engineering Co

Bison Gear And Engineering Co - Overview
Bison Gear And Engineering Co - Product / Service
Bison Gear And Engineering Co - Key offerings
SWOT

15.7 Bodine Electric Company

Bodine Electric Company - Overview
Bodine Electric Company - Product / Service
Bodine Electric Company - Key offerings
SWOT

15.8 Havells India Ltd.

Havells India Ltd. - Overview
Havells India Ltd. - Business segments
Havells India Ltd. - Key news
Havells India Ltd. - Key offerings
Havells India Ltd. - Segment focus
SWOT

15.9 Megha Roto Tech Pvt. Ltd.

Megha Roto Tech Pvt. Ltd. - Overview
Megha Roto Tech Pvt. Ltd. - Product / Service
Megha Roto Tech Pvt. Ltd. - Key offerings
SWOT

15.10 Nidec Corp.

Nidec Corp. - Overview
Nidec Corp. - Business segments
Nidec Corp. - Key offerings
Nidec Corp. - Segment focus
SWOT

15.11 Nord Gear Corp.

Nord Gear Corp. - Overview
Nord Gear Corp. - Product / Service
Nord Gear Corp. - Key offerings
SWOT

15.12 Regal Rexnord Corp.

Regal Rexnord Corp. - Overview
Regal Rexnord Corp. - Business segments
Regal Rexnord Corp. - Key offerings
Regal Rexnord Corp. - Segment focus
SWOT

15.13 Rockwell Automation Inc.

Rockwell Automation Inc. - Overview
Rockwell Automation Inc. - Business segments
Rockwell Automation Inc. - Key news
Rockwell Automation Inc. - Key offerings
Rockwell Automation Inc. - Segment focus
SWOT

15.14 SEW EURODRIVE

SEW EURODRIVE - Overview
SEW EURODRIVE - Product / Service
SEW EURODRIVE - Key offerings
SWOT

15.15 TECO-Westinghouse

TECO-Westinghouse - Overview
TECO-Westinghouse - Product / Service
TECO-Westinghouse - Key offerings
SWOT

15.16 Toshiba Corp.

Toshiba Corp. - Overview
Toshiba Corp. - Business segments
Toshiba Corp. - Key news
Toshiba Corp. - Key offerings
Toshiba Corp. - Segment focus
SWOT

15.17 WEG S.A

WEG S.A - Overview
WEG S.A - Business segments
WEG S.A - Key news
WEG S.A - Key offerings
WEG S.A - Segment focus
SWOT

15.18 Yaskawa Electric Corp.

Yaskawa Electric Corp. - Overview
Yaskawa Electric Corp. - Product / Service
Yaskawa Electric Corp. - Key news
Yaskawa Electric Corp. - Key offerings
SWOT

16. Appendix

16.1 Scope of the report

Market definition
Objectives
Notes and caveats

16.2 Inclusions and exclusions checklist

Inclusions checklist
Exclusions checklist

16.3 Currency conversion rates for US$

16.4 Research methodology

16.5 Data procurement

Information sources

16.6 Data validation

16.7 Validation techniques employed for market sizing

16.8 Data synthesis

16.9 360 degree market analysis

16.10 List of abbreviations

Research Methodology

Technavio presents a detailed picture of the market by way of study, synthesis, and summation of data from multiple sources. The analysts have presented the various facets of the market with a particular focus on identifying the key industry influencers. The data thus presented is comprehensive, reliable, and the result of extensive research, both primary and secondary.

INFORMATION SOURCES

Primary sources

  • Manufacturers and suppliers
  • Channel partners
  • Industry experts
  • Strategic decision makers

Secondary sources

  • Industry journals and periodicals
  • Government data
  • Financial reports of key industry players
  • Historical data
  • Press releases

DATA ANALYSIS

Data Synthesis

  • Collation of data
  • Estimation of key figures
  • Analysis of derived insights

Data Validation

  • Triangulation with data models
  • Reference against proprietary databases
  • Corroboration with industry experts

REPORT WRITING

Qualitative

  • Market drivers
  • Market challenges
  • Market trends
  • Five forces analysis

Quantitative

  • Market size and forecast
  • Market segmentation
  • Geographical insights
  • Competitive landscape

Interested in this report?

Get your sample now to see our research methodology and insights!

Download Now

Frequently Asked Questions

Inverter Duty Motor market growth will increase by USD 2542.2 million during 2026-2030.

The Inverter Duty Motor market is expected to grow at a CAGR of 8.9% during 2026-2030.

Inverter Duty Motor market is segmented by Application (Pumps, Fans, Conveyors, Others) End-user (Oil and gas, Chemicals, Metal and mining, Food and beverages, Others) Material type (Laminated steel, Cast iron, Aluminum)

ABB Ltd., Adlee Powertronic Co. Ltd., Bison Gear And Engineering Co, Bodine Electric Company, Havells India Ltd., Megha Roto Tech Pvt. Ltd., Nidec Corp., Nord Gear Corp., Regal Rexnord Corp., Rockwell Automation Inc., SEW EURODRIVE, Synchronics Electronics, TECO-Westinghouse, Toshiba Corp., WEG S.A, Yaskawa Electric Corp. are a few of the key vendors in the Inverter Duty Motor market.

North America will register the highest growth rate of 35.8% among the other regions. Therefore, the Inverter Duty Motor market in North America is expected to garner significant business opportunities for the vendors during the forecast period.

US, Canada, Mexico, China, India, Japan, South Korea, Australia, Indonesia, Germany, France, UK, Italy, Spain, The Netherlands, Brazil, Argentina, Chile, Saudi Arabia, UAE, Turkey, South Africa, Egypt

  • Rising focus on energy efficiency regulations is the driving factor this market.

The Inverter Duty Motor market vendors should focus on grabbing business opportunities from the Application segment as it accounted for the largest market share in the base year.