IoT In Banking And Financial Services Market Size 2024-2028
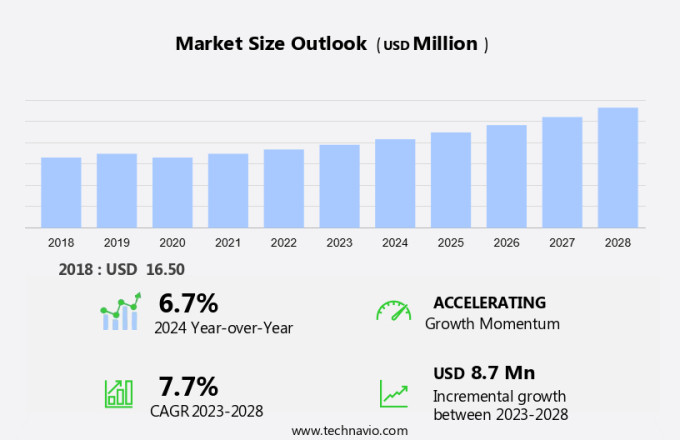
The IoT in banking and financial services market size is forecast to increase by USD 8.7 billion at a CAGR of 7.7% between 2023 and 2028.
- In the banking and financial services sector, the Internet of Things (IoT) is revolutionizing customer interactions by enabling real-time insights and personalized services. IoT devices, such as wearables, are transforming the way financial institutions engage with their clients. These technologies offer automation capabilities, allowing for streamlined processes and improved efficiency. Data analytics derived from IoT devices can provide valuable insights into customer behavior and preferences, enabling tailored offerings and enhanced customer experiences. However, the adoption of IoT in banking also presents challenges, including cybersecurity concerns and the need for fraud detection systems to protect sensitive financial data. As privacy and security remain top priorities for consumers, financial institutions must ensure that IoT implementations prioritize these concerns to build trust and maintain regulatory compliance.
What will be the Size of the Market During the Forecast Period?
- The Internet of Things (IoT) is revolutionizing various industries, including banking and financial services, by enabling interconnectivity and data flow between devices and digital services. This transformation brings about significant opportunities for financial institutions to enhance customer interactions, improve operational efficiency, and provide real-time insights. IoT devices, such as wearables, smart home systems, and connected cars, generate vast amounts of data. Financial institutions can harness this data to offer usage-based insurance (UBI) and personalized services. For instance, insurance companies can analyze driving patterns from a customer's connected car to determine their risk profile and offer customized insurance premiums.
- Moreover, IoT devices can facilitate real-time data flow between financial institutions and their customers. This interoperability allows for automation of transactions and real-time services, enhancing the overall customer experience. Data migration to cloud platforms is another area where IoT plays a crucial role. Managed services are increasingly becoming popular in the banking and financial services sector to manage IoT devices and digital payments. Financial institutions can leverage IoT devices to securely transfer large volumes of data to cloud-based data analytics tools for processing and insights generation. However, the integration of IoT in banking and financial services comes with its challenges. Interoperability and cybersecurity are two critical aspects that require attention. Financial institutions must ensure that IoT devices and digital services can seamlessly communicate with each other while maintaining security measures to protect sensitive customer data. Predictive analytics is another application of IoT in banking and financial services. By analyzing real-time data from IoT devices, financial institutions can predict customer behavior and offer personalized services.
How is this market segmented and which is the largest segment?
The market research report provides comprehensive data (region-wise segment analysis), with forecasts and estimates in "USD million" for the period 2024-2028, as well as historical data from 2018-2022 for the following segments.
- Component
- Solutions
- Services
- Geography
- North America
- Canada
- Mexico
- US
- Europe
- Germany
- UK
- France
- Spain
- APAC
- China
- Japan
- Middle East and Africa
- South America
- North America
By Component Insights
- The solutions segment is estimated to witness significant growth during the forecast period.
IIoT solutions are revolutionizing the banking and financial services industry by enabling advanced digital transformation. With the increasing demand for convenience and real-time services, IoT technologies are becoming essential for banks to meet customer expectations. IoT solutions offer various benefits, such as enhancing security, facilitating financial inclusion, and improving mobile banking experiences. For instance, biometric IoT systems provide personalized access to accounts based on unique physical or behavioral characteristics. Moreover, IoT solutions can be integrated into smart city projects to offer seamless banking services.
Furthermore, these technologies enable real-time risk management, account management, and payment processing, making banking services more efficient and effective. IoT solutions also offer cloud-based services, ensuring secure data storage and access. In conclusion, the adoption of IOT solutions in banking and financial services is a promising trend, offering numerous benefits and opportunities for innovation.
Get a glance at the market report of share of various segments Request Free Sample
The solutions segment was valued at USD 9.90 million in 2018 and showed a gradual increase during the forecast period.
Regional Analysis
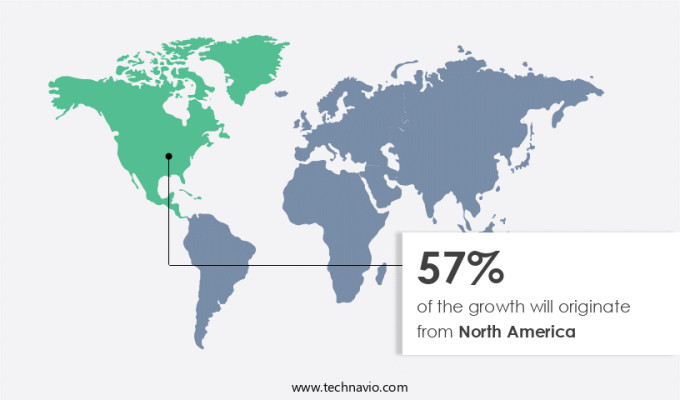
- North America is estimated to contribute 57% to the growth of the global market during the forecast period.
Technavio's analysts have elaborately explained the regional trends and drivers that shape the market during the forecast period.
For more insights on the market share of various regions Request Free Sample
IoT technology has gained significant traction in the banking and financial services sector in North America. Notable institutions like Bank of America have expanded their mobile wallet capabilities for corporate clients in Europe, the Middle East, and Asia Pacific regions. This development enables clients to utilize Corporate Travel and Purchasing Cards, as well as Apple Pay and Google Pay for managing and executing card transactions. Major IT software and service providers in the US, including Microsoft and IBM, are actively investing in IoT technology. The US federal government has also implemented IOT solutions in public sector organizations to cut IT expenses, enhance agility, and promote green computing.
Market Dynamics
Our researchers analyzed the data with 2023 as the base year, along with the key drivers, trends, and challenges. A holistic analysis of drivers will help companies refine their marketing strategies to gain a competitive advantage.
What are the key market drivers leading to the rise in adoption of IOT In Banking And Financial Services Market?
Disintermediation of banking services is the key driver of the market.
- In the banking and financial services sector, the integration of connected devices and digital services is transforming the industry landscape. Banks are embracing interconnectivity and interoperability to enhance their offerings and remain competitive. Real-time data flow is becoming a necessity, enabling institutions to monitor transactions and customer behavior more effectively. This shift is leading to the development of connected banking solutions, where customers can access a range of digital services using smartphones and tablet devices.
- Consequently, connected banking encompasses various payment options, including mobile wallets, contactless payments, and digital currencies like bitcoins. Usage-Based Insurance (UBI) is another area where connected devices are making a significant impact, providing insurers with real-time data to assess risk and offer customized policies. As consumers continue to demand more convenience and personalized services, financial institutions must adapt to this digital evolution to meet their needs. By partnering with technology providers and leveraging the power of data migration, banks can deliver innovative solutions and stay competitive in the market. Thus, such factors are driving the growth of the market during the forecast period.
What are the market trends shaping the IOT In Banking And Financial Services Market?
A rise in customer awareness about finance and digitization is the upcoming trend in the market.
- In today's digital age, customer interactions in the banking and financial services sector have evolved significantly. Millennials, born between 1980 and 2000, are driving the demand for IoT platforms to manage their daily financial transactions. Traditional banking institutions are integrating offerings from tech giants like Amazon, Google, Apple, Square, and PayPal to meet the needs of this tech-savvy demographic. Millennials seek convenience and personalized services through digital channels for activities such as payments, investments, remittances, crowdfunding, consumer banking, and lending.
- For example, SimpleTax simplifies the tax filing process for customers by automatically updating tax regulations. Certified by the Canada Revenue Agency, SimpleTax is just one of many FinTech solutions revolutionizing the financial services industry. Real-time insights and automation are crucial in this digital transformation. IoT devices, including wearables, play a vital role in providing personalized services. Data analytics enables financial institutions to understand customer behavior and preferences, leading to tailored offerings. Cybersecurity and fraud detection are essential components of this digital shift, ensuring the security and privacy of customer data. The integration of IoT and data analytics in banking and financial services offers numerous benefits, including improved customer engagement, increased operational efficiency, and enhanced fraud prevention. Financial institutions must prioritize these technologies to remain competitive and retain customers in the digital era. Thus, such trends will shape the growth of the market during the forecast period.
What challenges does IOT In Banking And Financial Services Market face during the growth?
Privacy and security concerns is a key challenge affecting the market growth.
- In the banking and financial services sector, the implementation of Internet of Things (IoT) technology is gaining traction, albeit slowly. Financial institutions in developed regions have begun integrating IoT into their operations to enhance data processing capabilities and improve fraud detection. However, in many developing nations, the adoption of IoT services and platforms remains low, despite high internet penetration. This is primarily since mass-market customers are still unaware of the benefits of online payment systems. To expand the market opportunity for IoT in banking and financial services, it is essential for policyholders and leading companies to implement policies that promote the use of online platforms.
- Also, data processing is a critical function in the financial services industry, and the collection of customer data plays a significant role in this process. Financial institutions gather personal information to customize advertising messages and target specific audiences. This data is utilized for customer profiling, behavior analysis, and data mining. Despite the benefits, concerns regarding data privacy and security continue to hinder the rapid adoption of IoT in banking and financial services. Delays in implementation due to legacy systems and regulatory compliance further complicate the situation. Nonetheless, the potential for increased efficiency, improved customer experience, and enhanced security make IoT an attractive proposition for the banking and financial services sector. Hence, the above factors will impede the growth of the market during the forecast period.
Exclusive Customer Landscape
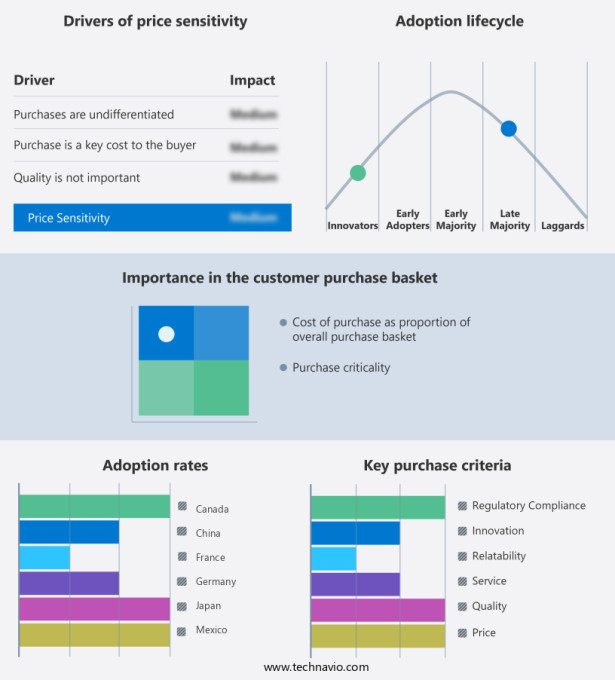
The market forecasting report includes the adoption lifecycle of the market, covering from the innovator's stage to the laggard's stage. It focuses on adoption rates in different regions based on penetration. Furthermore, the market report also includes key purchase criteria and drivers of price sensitivity to help companies evaluate and develop their market growth analysis strategies.
Customer Landscape
Key Companies & Market Insights
Companies are implementing various strategies, such as strategic alliances, market forecast, partnerships, mergers and acquisitions, geographical expansion, and product/service launches, to enhance their presence in the market.
The market research and growth report includes detailed analyses of the competitive landscape of the market and information about key companies, including:
- AAEON Technology Inc.
- Accenture PLC
- BlackBerry Ltd.
- Capgemini Services SAS
- Cisco Systems Inc.
- Concirrus
- Ewave Mobile
- Hewlett Packard Enterprise Co.
- Huawei Technologies Co. Ltd.
- Infosys Ltd.
- Intel Corp.
- International Business Machines Corp.
- Microsoft Corp.
- Oracle Corp.
- Paragyte Technologies
- SAP SE
- Schneider Electric SE
- STMicroelectronics International NV
- SunTec Business Solutions
- Vodafone Group Plc
Qualitative and quantitative analysis of companies has been conducted to help clients understand the wider business environment as well as the strengths and weaknesses of key market players. Data is qualitatively analyzed to categorize companies as pure play, category-focused, industry-focused, and diversified; it is quantitatively analyzed to categorize companies as dominant, leading, strong, tentative, and weak.
Research Analyst Overview
The Internet of Things (IoT) is revolutionizing the banking and financial services industry by enabling connected devices and digital services to facilitate real-time data flow and interoperability. Financial institutions are increasingly adopting IoT technologies to enhance customer interactions, provide personalized services, and gain real-time insights. IoT devices such as wearables and sensors are being used to offer usage-based insurance (UBI) and contactless payments. These innovations are transforming the industry by automating processes, improving data analytics, and enhancing cybersecurity. However, the implementation of IoT in banking and financial services comes with challenges such as data migration from legacy systems, interconnectivity, and integration with existing infrastructure.
Furthermore, real-time data processing is crucial for fraud detection and predictive analytics, which are essential for financial institutions to offer AI-driven personalized services and smart contracts. IoT payment systems and smart branch technology are also gaining popularity, offering managed services and cybersecurity solutions to ensure data security. The digital transformation of banking and financial services through IoT is also driving innovation in areas such as smart city projects, mobile banking, and digital banking solutions. However, implementation delays and infrastructure management requirements can pose challenges to the adoption of IoT in this sector. Despite these challenges, the benefits of IoT in banking and financial services are significant, with the potential to enhance customer experience, improve operational efficiency, and drive financial inclusion.
|
Market Scope |
|
|
Report Coverage |
Details |
|
Page number |
177 |
|
Base year |
2023 |
|
Historic period |
2018-2022 |
|
Forecast period |
2024-2028 |
|
Growth momentum & CAGR |
Accelerate at a CAGR of 7.7% |
|
Market Growth 2024-2028 |
USD 8.7 million |
|
Market structure |
Fragmented |
|
YoY growth 2023-2024(%) |
6.7 |
|
Key countries |
US, China, Germany, UK, Canada, Mexico, France, Spain, Japan, and Taiwan |
|
Competitive landscape |
Leading Companies, Market Positioning of Companies, Competitive Strategies, and Industry Risks |
What are the Key Data Covered in this Market Research and Growth Report?
- CAGR of the market during the forecast period
- Detailed information on factors that will drive the market growth and forecasting between 2024 and 2028
- Precise estimation of the size of the market and its contribution of the market in focus to the parent market
- Accurate predictions about upcoming market growth and trends and changes in consumer behaviour
- Growth of the market across North America, Europe, APAC, Middle East and Africa, and South America
- Thorough analysis of the market's competitive landscape and detailed information about companies
- Comprehensive analysis of factors that will challenge the growth of market companies
We can help! Our analysts can customize this market research report to meet your requirements. Get in touch


