



Israel Agriculture Market Size 2026-2030
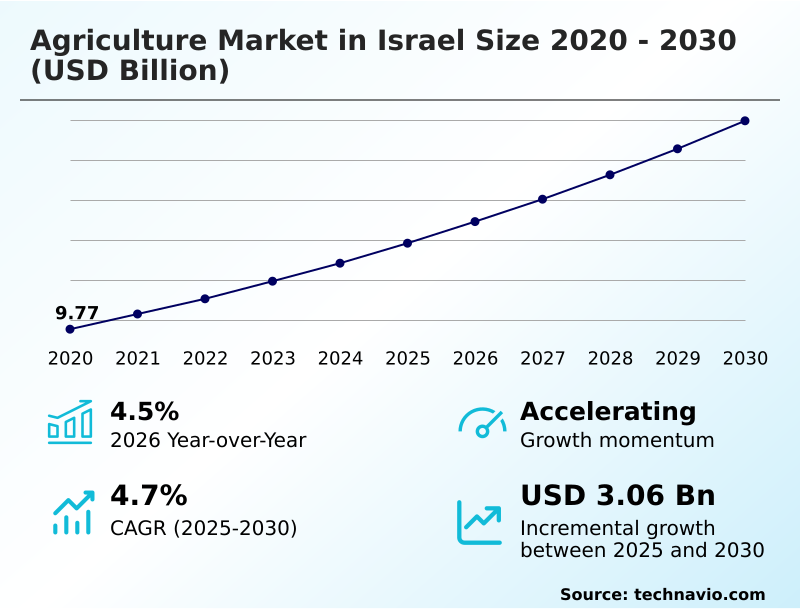
The israel agriculture market size is valued to increase by USD 3.06 billion, at a CAGR of 4.7% from 2025 to 2030. Advanced water scarcity management will drive the israel agriculture market.
Major Market Trends & Insights
- By Product - Oilseeds and pulses segment was valued at USD 2.86 billion in 2024
- By Distribution Channel - Supermarket segment accounted for the largest market revenue share in 2024
Market Size & Forecast
- Market Opportunities: USD 5.21 billion
- Market Future Opportunities: USD 3.06 billion
- CAGR from 2025 to 2030 : 4.7%
Market Summary
- The Agriculture Market in Israel operates as a highly advanced ecosystem defined by intensive technological integration and extreme resource optimization. Precision agriculture tools serve as the operational backbone for domestic producers facing severe environmental constraints.
- By utilizing drone-based crop monitoring to assess soil microclimates, farm operators can execute targeted nutrient delivery rather than blanketing entire fields, which improves input utilization efficiency by up to 25% compared to conventional methods. The integration of automated drone fleets and advanced desalination infrastructure acts as a primary market driver, enabling continuous yield improvements despite arid conditions.
- Conversely, severe water scarcity pressures remain a formidable challenge, compelling enterprises to constantly balance high-volume irrigation demands against strict regulatory quotas and elevated utility expenditures. Consequently, agricultural facilities must adopt hyper-efficient wastewater recycling protocols to maintain operational continuity. This necessity pushes the industry toward constant innovation, transforming geographic vulnerabilities into specialized commercial opportunities within the international agritech landscape.
What will be the Size of the Israel Agriculture Market during the forecast period?
Get Key Insights on Market Forecast (PDF) Get Free Sample
How is the Israel Agriculture Market Segmented?
The israel agriculture industry research report provides comprehensive data (region-wise segment analysis), with forecasts and estimates in "USD million" for the period 2026-2030, as well as historical data from 2020-2024 for the following segments.
- Product
- Oilseeds and pulses
- Cereals and grains
- Commercial crops
- Fruits and vegetables
- Fishery consumables and meat
- Distribution channel
- Supermarket
- Convenience stores
- E-commerce
- Type
- Conventional
- Organic
- Geography
- Middle East and Africa
- Israel
- Middle East and Africa
By Product Insights
The oilseeds and pulses segment is estimated to witness significant growth during the forecast period.
The oilseeds and pulses segment functions as a critical component in dryland cropping systems, leveraging microbial inoculants and subsurface drip lines to optimize yield under severe moisture constraints.
Operators increasingly shift toward a circular water economy, utilizing treated effluents to sustain plant growth without exhausting freshwater reserves. Implementing smart pressure-regulation valves has enhanced water delivery precision, resulting in a 15% improvement in overall irrigation efficiency.
Cultivators are actively integrating organic biofertilizers to naturally enrich soil nitrogen levels, mitigating the need for synthetic alternatives.
This strategic segmentation allows agricultural enterprises to maximize resource utilization and maintain resilient supply chains in arid environments, ensuring stable raw material availability for downstream food processing and alternative protein manufacturing facilities.
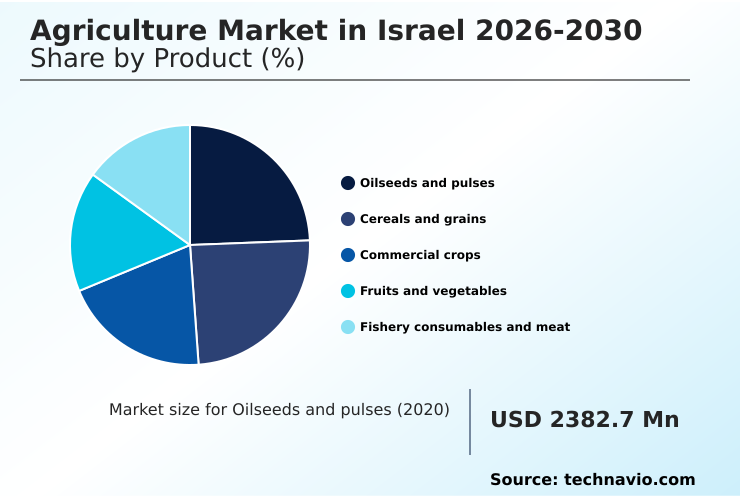
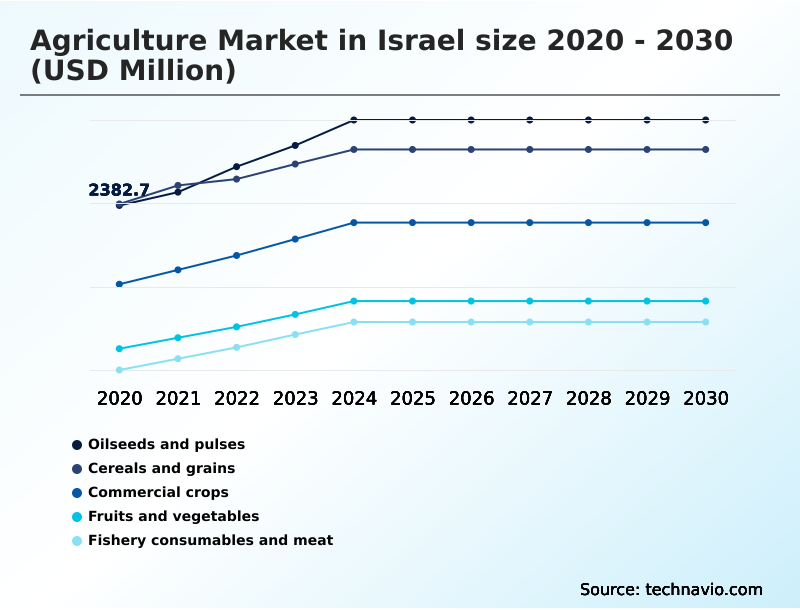
The Oilseeds and pulses segment was valued at USD 2.86 billion in 2024 and showed a gradual increase during the forecast period.
Market Dynamics
Our researchers analyzed the data with 2025 as the base year, along with the key drivers, trends, and challenges. A holistic analysis of drivers will help companies refine their marketing strategies to gain a competitive advantage.
- The transition toward fully automated farming environments fundamentally reshapes how domestic producers manage limited natural resources and volatile climatic shifts. Strategic advanced wastewater recycling infrastructure deployment ensures that high-value horticultural operations maintain a stable moisture supply, mitigating the devastating impact of prolonged regional droughts.
- To maximize the value of these water reserves, operators increasingly rely on artificial intelligence driven crop monitoring, which processes immense volumes of spectral data to identify plant stress long before visual symptoms appear. This capability directly enhances computerized fertigation systems operational efficiency, allowing for micro-dosing of essential nutrients that reduces fertilizer waste by nearly 20% compared to legacy broadcasting methods.
- In controlled environments, the implementation of rigorous smart greenhouse climate management protocols guarantees consistent yields of specialty herbs and vegetables, safeguarding commercial commitments to international retail partners regardless of external weather anomalies. Furthermore, the protein sector experiences significant transformation through recirculating aquaculture systems cost reduction, achieved by integrating highly efficient biological filtration mechanisms that limit energy usage.
- Together, these continuous technological upgrades enable agricultural enterprises to navigate strict regulatory frameworks, optimize their input-to-output ratios, and secure supply chain resilience in an increasingly competitive international landscape.
What are the key market drivers leading to the rise in the adoption of Israel Agriculture Industry?
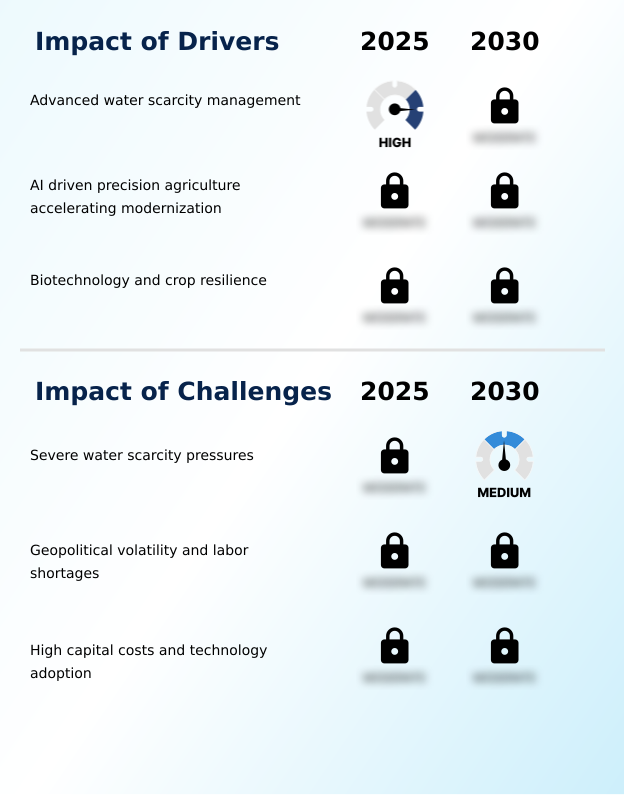
- Advanced water scarcity management serves as the primary driver propelling market growth.
- The mandate to maximize biological output per cubic meter of water constitutes a fundamental driver accelerating sector modernization.
- Expanding regional wastewater recycling infrastructure directly increases the availability of usable agricultural moisture, lowering utility procurement costs by roughly 18% for local cooperatives.
- The aggressive integration of agricultural biotechnology and climate-resilient crop breeding ensures that domestic seed portfolios maintain robust viability even as ambient soil temperatures rise.
- Simultaneously, leveraging satellite-based crop vigor monitoring enables farm operators to preemptively adjust irrigation scheduling, boosting overall harvest consistency by 20%. Advancements in microbial fermentation further support this efficiency by transforming organic byproducts into high-value agricultural inputs.
- These systemic upgrades empower farming enterprises to sustainably expand production boundaries and safeguard their competitive positioning within lucrative global export channels.
What are the market trends shaping the Israel Agriculture Industry?
- Agrovoltaics and sustainable land utilization represent the emerging market trend.
- The accelerated deployment of dual-use infrastructure fundamentally alters operational revenue models across the agriculture sector. Integrating agrovoltaic installations directly above active cultivation zones reduces ground-level moisture evaporation by 15%, concurrently generating clean energy that powers localized farm machinery.
- The widespread adoption of artificial intelligence algorithms within packing facilities has modernized post-harvest sorting, lowering export rejection rates by 22% and ensuring consistent quality control. Additionally, transforming crop residues into sustainable biochemicals allows producers to diversify income streams while shrinking their overall ecological footprint. These technological trends are driven by an absolute necessity to maximize land utility in resource-constrained environments.
- By adopting these multi-faceted solutions, farming enterprises achieve significant operational cost reductions and successfully align their supply chains with stringent international sustainability mandates.
What challenges does the Israel Agriculture Industry face during its growth?
- Severe water scarcity pressures constitute a critical challenge limiting industry expansion.
- Severe environmental limitations and high capital deployment costs represent significant structural challenges restricting rapid agricultural expansion. Persistent exposure to high soil salinity degrades arable land quality, causing a 15% reduction in baseline yields for conventional field crops.
- Implementing necessary modernization, such as precision fertilizer injection hardware and natural pheromone traps, requires substantial upfront capital that frequently overwhelms the financial capacity of independent farming cooperatives. The transition toward utilizing enzymatic hydrolysis for waste conversion and developing disease-resistant aquaculture strains demands prolonged research investments and specialized technical expertise.
- These intense economic and environmental pressures force producers to constantly balance immediate operational survival against the long-term imperative of technological upgrades, creating a persistent adoption gap between large-scale corporate entities and smaller regional agricultural networks.
Exclusive Technavio Analysis on Customer Landscape
The israel agriculture market forecasting report includes the adoption lifecycle of the market, covering from the innovator’s stage to the laggard’s stage. It focuses on adoption rates in different regions based on penetration. Furthermore, the israel agriculture market report also includes key purchase criteria and drivers of price sensitivity to help companies evaluate and develop their market growth analysis strategies.
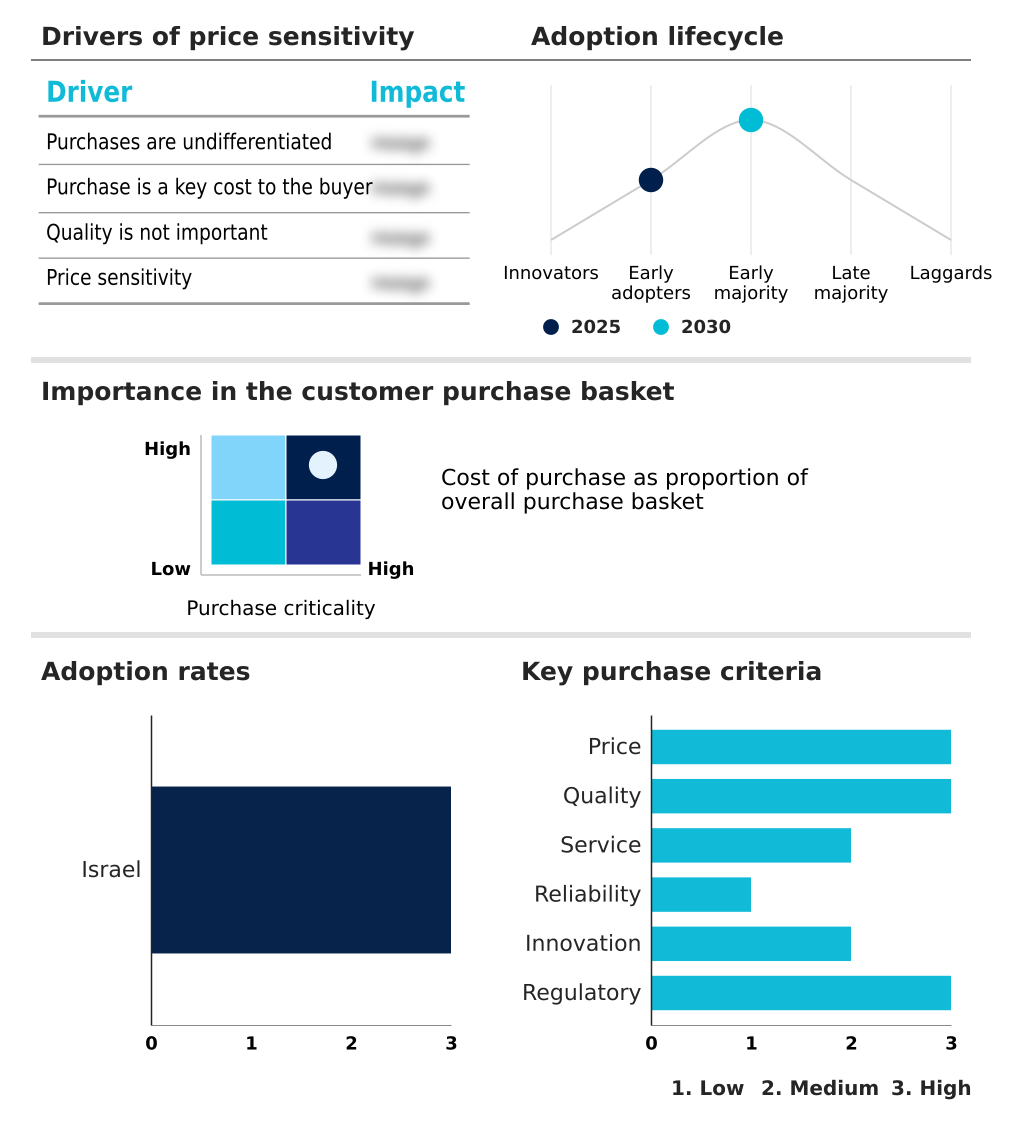
Customer Landscape of Israel Agriculture Industry
Competitive Landscape
Companies are implementing various strategies, such as strategic alliances, israel agriculture market forecast, partnerships, mergers and acquisitions, geographical expansion, and product/service launches, to enhance their presence in the industry.
Agridera Seeds and Agriculture - The vendor provides high-performance agricultural seeds, specializing in proprietary wheat, barley, tomato, and ornamental sunflower varieties designed to optimize yield and enhance resilience in demanding cultivation environments.
The industry research and growth report includes detailed analyses of the competitive landscape of the market and information about key companies, including:
- Agridera Seeds and Agriculture
- Agro Fresh Pro
- Ambar
- Aquatech Fisheries Ltd.
- Baram Group
- BeFresh Ltd.
- Ben Dor Fruits and Nurseries
- Cham Food Solutions Ltd.
- Hadiklaim Israel
- Hazera Seeds Ltd.
- Hishtil
- Mehadrin Tnuport Export L.P.
- Miloubar Agricultural Cooperative
- Negev Produce
- Origene Seeds Ltd.
- Oz and Hadar Group
- Rahan Meristem Ltd.
- Shamir Ltd.
- Yafe Seeds Production
- Yotvata Dairy
Qualitative and quantitative analysis of companies has been conducted to help clients understand the wider business environment as well as the strengths and weaknesses of key industry players. Data is qualitatively analyzed to categorize companies as pure play, category-focused, industry-focused, and diversified; it is quantitatively analyzed to categorize companies as dominant, leading, strong, tentative, and weak.
Recent Development and News in Israel agriculture market
- In the Agricultural Products and Services industry, the regulatory implementation of stringent international maximum residue limits for chemical pesticides accelerated the adoption of bioconversion protocols, directly impacting Agriculture demand by forcing growers to transition toward biological pest management.
- The rapid integration of real-time Internet of Things sensor grids within centralized packing facilities reduced post-harvest spoilage rates by 18%, significantly improving supply chain resilience across the Agriculture market.
- The technological transition toward climate-resilient crop breeding using advanced genomic mapping techniques enhanced seed durability under high soil salinity, expanding the viable production area for the Agriculture sector.
- The shift toward automated cold-storage tracking integrated with automated climate sensors improved transit shelf-life by 22%, directly increasing the export capacity and profitability of fresh produce within the Agriculture market.
Dive into Technavio’s robust research methodology, blending expert interviews, extensive data synthesis, and validated models for unparalleled Israel Agriculture Market insights. See full methodology.
| Market Scope | |
|---|---|
| Page number | 186 |
| Base year | 2025 |
| Historic period | 2020-2024 |
| Forecast period | 2026-2030 |
| Growth momentum & CAGR | Accelerate at a CAGR of 4.7% |
| Market growth 2026-2030 | USD 3057.7 million |
| Market structure | Fragmented |
| YoY growth 2025-2026(%) | 4.5% |
| Key countries | Israel |
| Competitive landscape | Leading Companies, Market Positioning of Companies, Competitive Strategies, and Industry Risks |
Research Analyst Overview
- The continuous evolution of agricultural production relies entirely on aggressive technological intervention to overcome structural environmental deficits. Commercial growers increasingly transition toward hydroponic nutrient delivery and soilless substrates, minimizing soil-borne pathogen risks and dramatically improving crop density per square meter.
- The rapid deployment of multi-spectral remote sensors enables precise anomaly detection, reducing chemical application volumes by up to 30% and significantly enhancing overall operational efficiency. Specialized breeding programs utilizing marker-assisted selection have accelerated the commercialization of drought-tolerant germplasm and heat-tolerant wheat, securing stable harvests under volatile climatic conditions.
- Furthermore, the integration of robotic harvesters addresses chronic labor shortages by automating delicate picking operations in modern orchards. These data-driven infrastructure investments directly influence boardroom-level budgetary planning, shifting capital expenditure from traditional land acquisition toward advanced digital automation.
- High-tech cultivation methodologies ensure that facilities maintain strict adherence to international export compliance standards while optimizing unit profitability across highly competitive global supply chains.
What are the Key Data Covered in this Israel Agriculture Market Research and Growth Report?
-
What is the expected growth of the Israel Agriculture Market between 2026 and 2030?
-
USD 3.06 billion, at a CAGR of 4.7%
-
-
What segmentation does the market report cover?
-
The report is segmented by Product (Oilseeds and pulses, Cereals and grains, Commercial crops, Fruits and vegetables, and Fishery consumables and meat), Distribution Channel (Supermarket, Convenience stores, and E-commerce), Type (Conventional, and Organic) and Geography (Middle East and Africa)
-
-
Which regions are analyzed in the report?
-
Middle East and Africa
-
-
What are the key growth drivers and market challenges?
-
Advanced water scarcity management, Severe water scarcity pressures
-
-
Who are the major players in the Israel Agriculture Market?
-
Agridera Seeds and Agriculture, Agro Fresh Pro, Ambar, Aquatech Fisheries Ltd., Baram Group, BeFresh Ltd., Ben Dor Fruits and Nurseries, Cham Food Solutions Ltd., Hadiklaim Israel, Hazera Seeds Ltd., Hishtil, Mehadrin Tnuport Export L.P., Miloubar Agricultural Cooperative, Negev Produce, Origene Seeds Ltd., Oz and Hadar Group, Rahan Meristem Ltd., Shamir Ltd., Yafe Seeds Production and Yotvata Dairy
-
Market Research Insights
- The agriculture sector relies heavily on continuous innovation in arid-zone agronomy to sustain commercial viability under extreme climatic constraints. Advanced controlled environment agriculture facilities have achieved a 30% reduction in total water consumption compared to traditional open-field methods. The strategic implementation of thermal stress reduction technologies within greenhouse structures improves crop survival rates by 22% during peak summer months.
- Furthermore, upcycling organic waste into high-protein animal feed supplements offsets raw material procurement costs for livestock operators by roughly 15%. These measurable efficiency gains demonstrate how technology-driven resource management directly strengthens operational profitability and aligns local supply chains with stringent international sustainability standards.
We can help! Our analysts can customize this israel agriculture market research report to meet your requirements.
 RIA -

