IT Monitoring Tools Market Analysis North America, Europe, APAC, South America, Middle East and Africa - US, China, UK, Germany, Canada - Size and Forecast 2024-2028

IT Monitoring Tools Market Analysis North America, Europe, APAC, South America, Middle East and Africa - US, China, UK, Germany, Canada - Size and Forecast 2024-2028

Published: Jul 2024 175 Pages SKU: IRTNTR70205

Market Overview at a Glance

$107.52 B
Market Opportunity
42.17%
CAGR
32.69
YoY growth 2023-2024(%)

IT Monitoring Tools Market Size 2024-2028

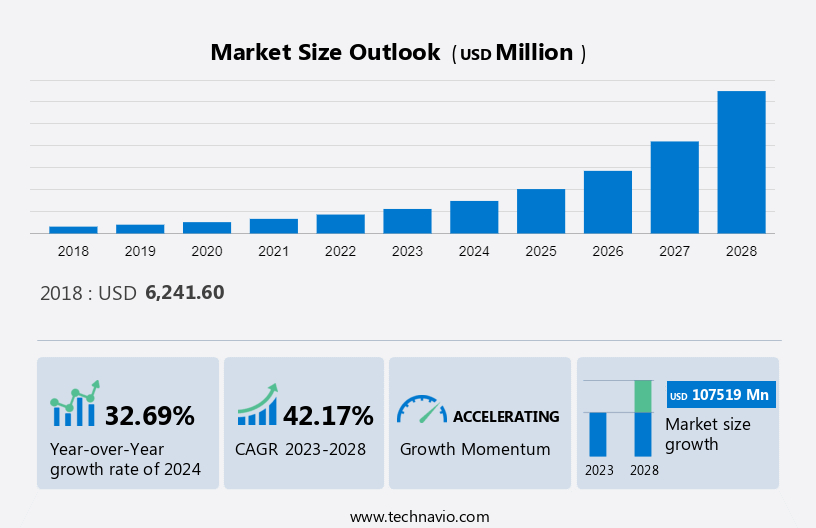
The IT monitoring tools market size is forecast to increase by USD 107.52 billion, at a CAGR of 42.17% between 2023 and 2028. The market's growth hinges on several critical factors, notably the continuous drive to enhance IT operational efficiency, spurred by the emergence of algorithmic IT operations analytics and the widespread expansion of IoT infrastructure. As organizations strive for greater agility and reliability in their IT operations, the demand for advanced monitoring tools intensifies.

These tools play a pivotal role in overseeing diverse aspects of IT infrastructure, including hardware components, data centers, and cloud-hosted environments. They provide real-time insights into the performance of websites, servers, networks, and application platforms, enabling proactive management and swift resolution of potential issues. As the digital landscape evolves, the role of IT monitoring tools becomes increasingly indispensable, driving innovation and efficiency across diverse sectors. 

What will be the IT Monitoring Tools Market Size During the Forecast Period?

It Monitoring Tools Market Size

To learn more about this IT Monitoring Tools market report, View Report Sample

IT Monitoring Tools Market Dynamics 

The market is driven by the increasing complexity of IT landscapes and the growing prevalence of cyber threats. Organizations rely on network monitoring, server monitoring, and cloud monitoring to detect disruptions and system failures proactively. Real-time monitoring and AI-driven analytics enable swift issue detection and response to security breaches. Capacity planning tools help optimize system performance, while the proliferation of connected devices introduces new challenges in monitoring and securing endpoints. As Artificial Intelligence and machine learning continue to advance, the market is poised for further innovation to address evolving IT challenges in an increasingly interconnected digital ecosystem. 

IT Monitoring Tools Market Driver

Improving the efficiency of IT operations is the key driver for the growth of the market. IT monitoring tools allow businesses to monitor the performance of critical IT infrastructure in real time, including servers, websites, and applications. Information technology monitoring tools to monitor downtime, bandwidth usage, performance metrics, hardware failures, and more. One hour of IT downtime can severely impact business profitability through loss of customers and reduced productivity. The use of such tools to help businesses maintain an online presence and improve operational efficiency. The benefit that these tools bring to businesses is increasing their adoption rate among potential end users.

Further, ITIM tools continuously monitor the availability of all connected IT infrastructure hardware hosted on-premises or in the cloud. The ITIM software also monitors the real-time availability and usage of each machine or device. The hardware devices include virtual machines, routers, network switches, processors, storage devices, databases, and hypervisors in the network. The application also identifies problems before they happen. This helps IT teams isolate failed systems and perform predictive maintenance. Thus, boosting the growth of the market during the forecast period.

IT Monitoring Tools MarketTrends

The growing adoption of software-defined data centers is a primary trend in the market. A software-defined data center refers to a data center where the infrastructure is provided as a service through the virtualization of the physical infrastructure. SDDC has three components such as software-defined networking (SDN), software-defined computing (SDC), and software-defined storage (SDS). Enterprises adopting cloud-based infrastructure are looking at the possibility of setting up SDDC to gain greater control over critical business operations and improve the management of their data center facilities.

Moreover, SDN implementations also offer key benefits for players, such as lower hardware costs, faster provisioning, protection against network failures, and the ability to easily allocate bandwidth on demand across the network. Many colocation providers, such as Digital Realty Trust, CyrusOne, and Equinix, provide connectivity to cloud platforms, such as AWS, Microsoft Azure, and Google Cloud, using a support network. SDN support network. 

IT Monitoring Tools Market Challenge 

The limited scalability of currently available tools is a challenge that affects IT monitoring tools market growth. The amount of hardware, IT infrastructure monitoring software, and network components connected to a network continue to increase as an organization grows. However, only a limited number of information technology tools are capable of auto-adapting and supporting the expanding network infrastructure. Extensive computer networks require distributed computing, distributed data management, storage technology, and a variety of parallel computing capabilities.

However, very few are capable of taking full advantage of these technologies. This limits the establishment of an effective IT monitoring system. Legacy information technology and systems cannot handle the extreme volumes of data and metrics that are required to operate IT infrastructure correctly and efficiently. This requires the development of new tools based on an extensible system architecture. Hence, these factors will affect the growth of the market during the forecast period.
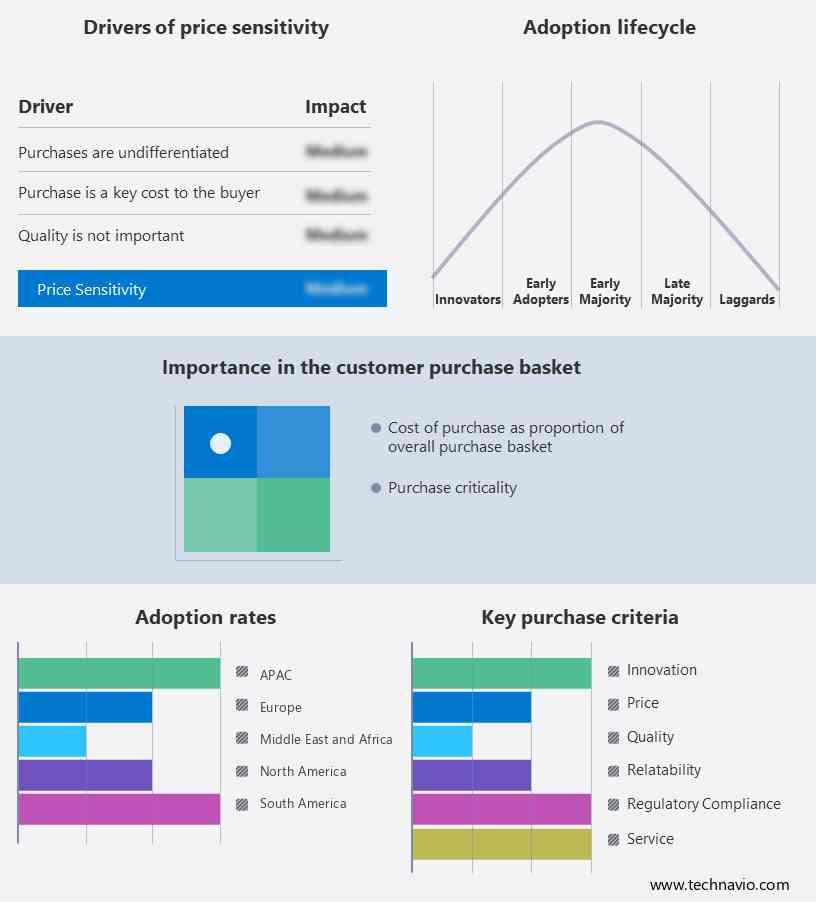
Customer Landscape

The IT monitoring tools market forecasting report includes the adoption lifecycle of the market research and growth, covering from the innovator's stage to the laggard's stage. It focuses on adoption rates in different regions based on penetration. Furthermore, the IT monitoring tools market growth analysis report also includes key purchase criteria and drivers of price sensitivity to help companies evaluate and develop their market growth and forecasting strategies.

IT Monitoring Tools Market Share by Geography

Customer Landscape

IT Monitoring Tools Market Segmentation

In the realm of IT monitoring tools, a plethora of solutions cater to diverse needs across IT landscapes. These tools encompass network monitoring, server monitoring, cloud monitoring, log monitoring, and security monitoring, providing comprehensive oversight of IT systems. With real-time monitoring capabilities and advanced algorithms powered by AI and machine learning, they enable proactive detection of disruptions, system failures, and security breaches. Capacity planning tools aid in optimizing performance by predicting resource requirements and mitigating risks. Offering deployment options for various environments, including tablets, smartphones, smart TVs, VR headsets, and connected cars, these tools empower organizations to safeguard their critical metrics and stay ahead of evolving cyber threats in today's dynamic digital landscape.

By Product 

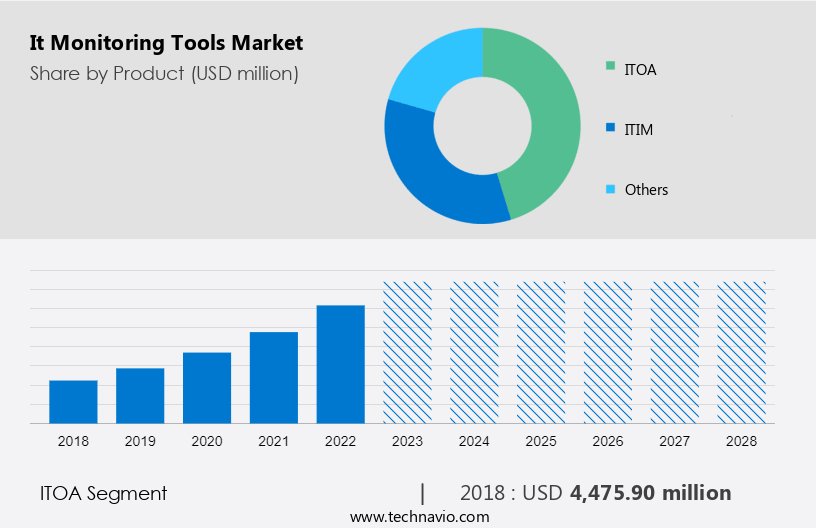
The market share growth by the ITOA segment will be significant during the forecast period. ITOA tools are used to monitor various IT activities to collect statistics and analyze data. The insights gained will help to make data-driven decisions and predict possible causes of errors and performance bottlenecks. Information collected and obtained by ITOA is sent to the IT operations management (ITOM) team for troubleshooting or to an automated ITOM toolkit for diagnostics.

It Monitoring Tools Market Size

Get a glance at the market contribution of various segments. View Free  PDF Sample

The ITOA segment was valued at USD 4.47 billion in 2018The increasing complexity of business processes is driving organizations to automate their ITOA tools. These tools can automatically learn and apply solutions to IT operating problems. Natural language processing and machine learning algorithms should be fully integrated into ITOA tools. ITOA tools will also benefit from the development of algorithmic computing tools that will facilitate the integration of different IT infrastructure monitoring software and hardware platforms. This will allow ITOA to easily manage a multi-players network of devices. Hence, these factors drive IT monitoring tools market growth during the forecast period. 

By Deployment

The main reason for adopting the on-premise deployment model is that it provides better security than the cloud-based deployment model. On-premises provides good control and information security. In on-premises deployment, data is accessible only through dedicated servers for customers, while in cloud-based deployment, data is accessible through multiple points. Several small and medium-scale healthcare organizations are adopting cloud-based IT monitoring tools. Some of the Downsides of the On-premises IT monitoring tool market include updating IT infrastructure monitoring software is difficult and time-consuming, and lack of flexibility in restructuring solutions  Hence, due to these disadvantages, the on-premise segment of the market will grow at a moderate rate during the forecast period. 

By Region

It Monitoring Tools Market Share by Geography

For more insights on the market share of various regions, Download PDF Sample now!

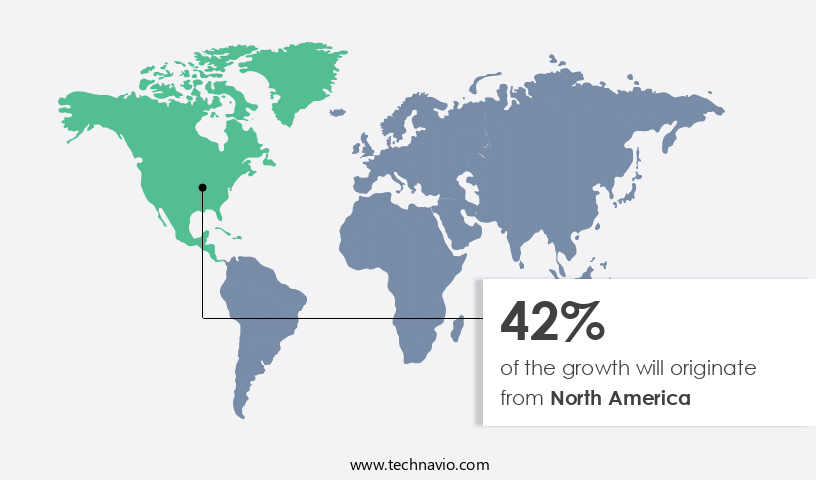
North America is estimated to contribute 42% to the IT Monitoring Tools Market growth of the global market during the forecast period. Technavio's analysts have elaborately explained the regional trends and drivers that shape the market during the forecast period. The US and Canada hold the highest share of the regional market. The US is a major hub for hosting large-scale server installations and data centers. The use of on-premises servers and digital IT infrastructure in SMEs is also common in the US, further supporting the growth of the regional market.

Furthermore, as enterprise end-users move from dedicated on-premises IT solutions to cloud and hybrid infrastructures, demand for IT infrastructure monitoring software as a service (SaaS) or cloud-based monitoring tools will also increase. Many companies still operate their operations on legacy IT infrastructure, and solutions should also upgrade their hardware/software to hybrid or cloud-based systems. This transformation will drive the growth of the market in North America during the forecast period. 

Who are the Major IT Monitoring Tools Market Companies?

Companies are implementing various strategies, such as strategic alliances, partnerships, mergers and acquisitions, geographical expansion, and product/service launches, to enhance their presence in the market.

BMC Software Inc.: The company offers IT monitoring tools such as System monitoring, Dependency monitoring, Integrated and API monitoring.

Broadcom Inc.: The company offers IT monitoring tools such as DX Virtual Network Assurance.

Circonus Inc.: The company offers IT monitoring solution for modern day enterprise that delivers crystal clear and real time observability of the behavior
EndFragment EndFragment

The IT monitoring tools research report also includes detailed analyses of the competitive landscape of the market and information about 20 market companies, including:

  • Datadog Inc.
  • Hewlett Packard Enterprise Co.
  • International Business Machines Corp.
  • ITRS Group Ltd.
  • Microsoft Corp.
  • Nagios Enterprises LLC.
  • NetScout Systems Inc.
  • New Relic Inc.
  • Open Text Corp.
  • Paessler AG
  • SAS Institute Inc.
  • SolarWinds Corp.
  • Splunk Inc.
  • VMware Inc.
  • Zabbix LLC.
  • Zenoss Inc.
  • Zoho Corp. Pvt. Ltd.

Qualitative and quantitative analysis of companies has been conducted to help clients understand the wider business environment as well as the strengths and weaknesses of key market players. Data is qualitatively analyzed to categorize companies as pure play, category-focused, industry-focused, and diversified; it is quantitatively analyzed to categorize companies as dominant, leading, strong, tentative, and weak.

Segment Overview

The IT monitoring tools market share research report provides comprehensive data (region-wise segment analysis), with forecasts and estimates in "USD billion " for the period 2024-2028, as well as historical data from 2018-2022 for the following segments.

  • Product Outlook 
    • ITOA
    • ITIM
    • Others
  • Deployment Outlook 
    • On-premise
    • Cloud-based
  • Region Outlook 
    • North America
      • The U.S.
      • Canada
    • Europe
      • The U.K.
      • Germany
      • France
      • Rest of Europe
    • APAC
      • China
      • India
    • South America
      • Chile
      • Brazil
      • Argentina
    • Middle East & Africa
      • Saudi Arabia
      • South Africa
      • Rest of the Middle East & Africa

Market Analyst Overview 

As per IT Monitoring Tools Market Analysis , the dynamic landscape of the market, customer satisfaction stands at the forefront, driving innovations to enhance resource utilization and network traffic management. These tools cater to diverse sectors, including robotics, with considerations for upfront costs, maintenance expenses, and licensing fees. Skilled personnel navigate the complexities, conducting cost-benefit analyses and tapping into untapped potential, especially in developing regions. Amid digital transformation, regulatory environments shape compatibility and interoperability, ensuring seamless integration across IT environments. With a focus on modern IT infrastructure components, data inconsistencies are addressed through standardized protocols and robust testing mechanisms. Prominent firms like SANDSTORM lead in cloud-based solutions, fortifying enterprises against security threats like ransomware and cyberattacks, particularly in financial institutions, manufacturing facilities, and healthcare systems, amidst evolving technological developments.

IT Monitoring Tools Market Scope

Report Coverage

Details

Base year

2023

Historic period

2018 - 2022

Forecast period

2024-2028

Growth momentum & CAGR

Accelerate at a CAGR of 42.17%

Market growth 2024-2028

USD 107.51 billion

Market structure

Fragmented

YoY growth 2023-2024(%)

32.69

Regional analysis

North America, Europe, APAC, South America, and Middle East and Africa

Performing market contribution

North America at 42%

Key countries

US, China, UK, Germany, and Canada

Competitive landscape

Leading Companies, Market Positioning of Companies, Competitive Strategies, and Industry Risks

Key companies profiled

BMC Software Inc., Broadcom Inc., Circonus Inc., Datadog Inc., Hewlett Packard Enterprise Co., International Business Machines Corp., ITRS Group Ltd., Microsoft Corp., Nagios Enterprises LLC., NetScout Systems Inc., New Relic Inc., Open Text Corporation, Paessler AG, SAS Institute Inc., SolarWinds Corp., Splunk Inc., VMware Inc., Zabbix LLC., Zenoss Inc., and Zoho Corp. Pvt. Ltd.

Market dynamics

Parent market analysis, Market Forecasting, Market growth inducers and obstacles, Fast-growing and slow-growing segment analysis, Market growth and Forecasting, COVID 19 impact and recovery analysis and future consumer dynamics, Market condition analysis for market forecast period

Customization purview

If our report has not included the data that you are looking for, you can reach out to our analysts and get segments customized.

View PDF Sample

What are the Key Data Covered in this IT Monitoring Tools Market Report?

  • CAGR of the market during the forecast period
  • Detailed information on factors that will drive the market growth and forecasting of the market between 2024 and 2028
  • Precise estimation of the size of the market size and its contribution to the parent market
  • Accurate predictions about upcoming market trends and analysis and changes in consumer behavior
  • Growth of the market industry across Europe, North America, APAC, South America, and Middle East and Africa
  • Thorough market growth analysis of the market's competitive landscape and detailed information about companies
  • Comprehensive market analysis and report on the factors that will challenge the market research and growth of market companies

We can help! Our analysts can customize this IT Monitoring Tools market research report to meet your requirements.

Get in touch

1 Executive Summary

  • 1.1 Market overview
    • Executive Summary - Chart on Market Overview
    • Executive Summary - Data Table on Market Overview
    • Executive Summary - Chart on Global Market Characteristics
    • Executive Summary - Chart on Market by Geography
    • Executive Summary - Chart on Market Segmentation by Product
    • Executive Summary - Chart on Market Segmentation by Deployment
    • Executive Summary - Chart on Incremental Growth
    • Executive Summary - Data Table on Incremental Growth
    • Executive Summary - Chart on Company Market Positioning

2 Market Landscape

  • 2.1 Market ecosystem
    • Parent Market
    • Data Table on - Parent Market
  • 2.2 Market characteristics
    • Market characteristics analysis
  • 2.3 Value chain analysis
    • Value Chain Analysis

3 Market Sizing

  • 3.1 Market definition
    • Offerings of companies included in the market definition
  • 3.2 Market segment analysis
    • Market segments
  • 3.3 Market size 2023
    • 3.4 Market outlook: Forecast for 2023-2028
      • Chart on Global - Market size and forecast 2023-2028 ($ million)
      • Data Table on Global - Market size and forecast 2023-2028 ($ million)
      • Chart on Global Market: Year-over-year growth 2023-2028 (%)
      • Data Table on Global Market: Year-over-year growth 2023-2028 (%)

    4 Historic Market Size

    • 4.1 Global IT Monitoring Tools Market 2018 - 2022
      • Historic Market Size - Data Table on Global IT Monitoring Tools Market 2018 - 2022 ($ million)
    • 4.2 Product segment analysis 2018 - 2022
      • Historic Market Size - Product Segment 2018 - 2022 ($ million)
    • 4.3 Deployment segment analysis 2018 - 2022
      • Historic Market Size - Deployment Segment 2018 - 2022 ($ million)
    • 4.4 Geography segment analysis 2018 - 2022
      • Historic Market Size - Geography Segment 2018 - 2022 ($ million)
    • 4.5 Country segment analysis 2018 - 2022
      • Historic Market Size - Country Segment 2018 - 2022 ($ million)

    5 Five Forces Analysis

    • 5.1 Five forces summary
      • Five forces analysis - Comparison between 2023 and 2028
    • 5.2 Bargaining power of buyers
      • Bargaining power of buyers - Impact of key factors 2023 and 2028
    • 5.3 Bargaining power of suppliers
      • Bargaining power of suppliers - Impact of key factors in 2023 and 2028
    • 5.4 Threat of new entrants
      • Threat of new entrants - Impact of key factors in 2023 and 2028
    • 5.5 Threat of substitutes
      • Threat of substitutes - Impact of key factors in 2023 and 2028
    • 5.6 Threat of rivalry
      • Threat of rivalry - Impact of key factors in 2023 and 2028
    • 5.7 Market condition
      • Chart on Market condition - Five forces 2023 and 2028

    6 Market Segmentation by Product

    • 6.1 Market segments
      • Chart on Product - Market share 2023-2028 (%)
      • Data Table on Product - Market share 2023-2028 (%)
    • 6.2 Comparison by Product
      • Chart on Comparison by Product
      • Data Table on Comparison by Product
    • 6.3 ITOA - Market size and forecast 2023-2028
      • Chart on ITOA - Market size and forecast 2023-2028 ($ million)
      • Data Table on ITOA - Market size and forecast 2023-2028 ($ million)
      • Chart on ITOA - Year-over-year growth 2023-2028 (%)
      • Data Table on ITOA - Year-over-year growth 2023-2028 (%)
    • 6.4 ITIM - Market size and forecast 2023-2028
      • Chart on ITIM - Market size and forecast 2023-2028 ($ million)
      • Data Table on ITIM - Market size and forecast 2023-2028 ($ million)
      • Chart on ITIM - Year-over-year growth 2023-2028 (%)
      • Data Table on ITIM - Year-over-year growth 2023-2028 (%)
    • 6.5 Others - Market size and forecast 2023-2028
      • Chart on Others - Market size and forecast 2023-2028 ($ million)
      • Data Table on Others - Market size and forecast 2023-2028 ($ million)
      • Chart on Others - Year-over-year growth 2023-2028 (%)
      • Data Table on Others - Year-over-year growth 2023-2028 (%)
    • 6.6 Market opportunity by Product
      • Market opportunity by Product ($ million)
      • Data Table on Market opportunity by Product ($ million)

    7 Market Segmentation by Deployment

    • 7.1 Market segments
      • Chart on Deployment - Market share 2023-2028 (%)
      • Data Table on Deployment - Market share 2023-2028 (%)
    • 7.2 Comparison by Deployment
      • Chart on Comparison by Deployment
      • Data Table on Comparison by Deployment
    • 7.3 On-premise - Market size and forecast 2023-2028
      • Chart on On-premise - Market size and forecast 2023-2028 ($ million)
      • Data Table on On-premise - Market size and forecast 2023-2028 ($ million)
      • Chart on On-premise - Year-over-year growth 2023-2028 (%)
      • Data Table on On-premise - Year-over-year growth 2023-2028 (%)
    • 7.4 Cloud-based - Market size and forecast 2023-2028
      • Chart on Cloud-based - Market size and forecast 2023-2028 ($ million)
      • Data Table on Cloud-based - Market size and forecast 2023-2028 ($ million)
      • Chart on Cloud-based - Year-over-year growth 2023-2028 (%)
      • Data Table on Cloud-based - Year-over-year growth 2023-2028 (%)
    • 7.5 Market opportunity by Deployment
      • Market opportunity by Deployment ($ million)
      • Data Table on Market opportunity by Deployment ($ million)

    8 Customer Landscape

    • 8.1 Customer landscape overview
      • Analysis of price sensitivity, lifecycle, customer purchase basket, adoption rates, and purchase criteria

    9 Geographic Landscape

    • 9.1 Geographic segmentation
      • Chart on Market share by geography 2023-2028 (%)
      • Data Table on Market share by geography 2023-2028 (%)
    • 9.2 Geographic comparison
      • Chart on Geographic comparison
      • Data Table on Geographic comparison
    • 9.3 North America - Market size and forecast 2023-2028
      • Chart on North America - Market size and forecast 2023-2028 ($ million)
      • Data Table on North America - Market size and forecast 2023-2028 ($ million)
      • Chart on North America - Year-over-year growth 2023-2028 (%)
      • Data Table on North America - Year-over-year growth 2023-2028 (%)
    • 9.4 Europe - Market size and forecast 2023-2028
      • Chart on Europe - Market size and forecast 2023-2028 ($ million)
      • Data Table on Europe - Market size and forecast 2023-2028 ($ million)
      • Chart on Europe - Year-over-year growth 2023-2028 (%)
      • Data Table on Europe - Year-over-year growth 2023-2028 (%)
    • 9.5 APAC - Market size and forecast 2023-2028
      • Chart on APAC - Market size and forecast 2023-2028 ($ million)
      • Data Table on APAC - Market size and forecast 2023-2028 ($ million)
      • Chart on APAC - Year-over-year growth 2023-2028 (%)
      • Data Table on APAC - Year-over-year growth 2023-2028 (%)
    • 9.6 South America - Market size and forecast 2023-2028
      • Chart on South America - Market size and forecast 2023-2028 ($ million)
      • Data Table on South America - Market size and forecast 2023-2028 ($ million)
      • Chart on South America - Year-over-year growth 2023-2028 (%)
      • Data Table on South America - Year-over-year growth 2023-2028 (%)
    • 9.7 Middle East and Africa - Market size and forecast 2023-2028
      • Chart on Middle East and Africa - Market size and forecast 2023-2028 ($ million)
      • Data Table on Middle East and Africa - Market size and forecast 2023-2028 ($ million)
      • Chart on Middle East and Africa - Year-over-year growth 2023-2028 (%)
      • Data Table on Middle East and Africa - Year-over-year growth 2023-2028 (%)
    • 9.8 US - Market size and forecast 2023-2028
      • Chart on US - Market size and forecast 2023-2028 ($ million)
      • Data Table on US - Market size and forecast 2023-2028 ($ million)
      • Chart on US - Year-over-year growth 2023-2028 (%)
      • Data Table on US - Year-over-year growth 2023-2028 (%)
    • 9.9 China - Market size and forecast 2023-2028
      • Chart on China - Market size and forecast 2023-2028 ($ million)
      • Data Table on China - Market size and forecast 2023-2028 ($ million)
      • Chart on China - Year-over-year growth 2023-2028 (%)
      • Data Table on China - Year-over-year growth 2023-2028 (%)
    • 9.10 UK - Market size and forecast 2023-2028
      • Chart on UK - Market size and forecast 2023-2028 ($ million)
      • Data Table on UK - Market size and forecast 2023-2028 ($ million)
      • Chart on UK - Year-over-year growth 2023-2028 (%)
      • Data Table on UK - Year-over-year growth 2023-2028 (%)
    • 9.11 Germany - Market size and forecast 2023-2028
      • Chart on Germany - Market size and forecast 2023-2028 ($ million)
      • Data Table on Germany - Market size and forecast 2023-2028 ($ million)
      • Chart on Germany - Year-over-year growth 2023-2028 (%)
      • Data Table on Germany - Year-over-year growth 2023-2028 (%)
    • 9.12 Canada - Market size and forecast 2023-2028
      • Chart on Canada - Market size and forecast 2023-2028 ($ million)
      • Data Table on Canada - Market size and forecast 2023-2028 ($ million)
      • Chart on Canada - Year-over-year growth 2023-2028 (%)
      • Data Table on Canada - Year-over-year growth 2023-2028 (%)
    • 9.13 Market opportunity by geography
      • Market opportunity by geography ($ million)
      • Data Tables on Market opportunity by geography ($ million)

    10 Drivers, Challenges, and Opportunity/Restraints

    • 10.1 Market drivers
      • 10.2 Market challenges
        • 10.3 Impact of drivers and challenges
          • Impact of drivers and challenges in 2023 and 2028
        • 10.4 Market opportunities/restraints

          11 Competitive Landscape

          • 11.1 Overview
            • 11.2 Competitive Landscape
              • Overview on criticality of inputs and factors of differentiation
            • 11.3 Landscape disruption
              • Overview on factors of disruption
            • 11.4 Industry risks
              • Impact of key risks on business

            12 Competitive Analysis

            • 12.1 Companies profiled
              • Companies covered
            • 12.2 Market positioning of companies
              • Matrix on companies position and classification
            • 12.3 BMC Software Inc.
              • BMC Software Inc. - Overview
              • BMC Software Inc. - Product / Service
              • BMC Software Inc. - Key news
              • BMC Software Inc. - Key offerings
            • 12.4 Broadcom Inc.
              • Broadcom Inc. - Overview
              • Broadcom Inc. - Business segments
              • Broadcom Inc. - Key news
              • Broadcom Inc. - Key offerings
              • Broadcom Inc. - Segment focus
            • 12.5 Circonus Inc.
              • Circonus Inc. - Overview
              • Circonus Inc. - Product / Service
              • Circonus Inc. - Key offerings
            • 12.6 Hewlett Packard Enterprise Co.
              • Hewlett Packard Enterprise Co. - Overview
              • Hewlett Packard Enterprise Co. - Business segments
              • Hewlett Packard Enterprise Co. - Key news
              • Hewlett Packard Enterprise Co. - Key offerings
              • Hewlett Packard Enterprise Co. - Segment focus
            • 12.7 International Business Machines Corp.
              • International Business Machines Corp. - Overview
              • International Business Machines Corp. - Business segments
              • International Business Machines Corp. - Key news
              • International Business Machines Corp. - Key offerings
              • International Business Machines Corp. - Segment focus
            • 12.8 ITRS Group Ltd.
              • ITRS Group Ltd. - Overview
              • ITRS Group Ltd. - Product / Service
              • ITRS Group Ltd. - Key offerings
            • 12.9 Microsoft Corp.
              • Microsoft Corp. - Overview
              • Microsoft Corp. - Business segments
              • Microsoft Corp. - Key news
              • Microsoft Corp. - Key offerings
              • Microsoft Corp. - Segment focus
            • 12.10 NetScout Systems Inc.
              • NetScout Systems Inc. - Overview
              • NetScout Systems Inc. - Product / Service
              • NetScout Systems Inc. - Key offerings
            • 12.11 New Relic Inc.
              • New Relic Inc. - Overview
              • New Relic Inc. - Product / Service
              • New Relic Inc. - Key offerings
            • 12.12 Paessler AG
              • Paessler AG - Overview
              • Paessler AG - Product / Service
              • Paessler AG - Key offerings
            • 12.13 SAS Institute Inc.
              • SAS Institute Inc. - Overview
              • SAS Institute Inc. - Product / Service
              • SAS Institute Inc. - Key news
              • SAS Institute Inc. - Key offerings
            • 12.14 SolarWinds Corp.
              • SolarWinds Corp. - Overview
              • SolarWinds Corp. - Product / Service
              • SolarWinds Corp. - Key offerings
            • 12.15 Splunk Inc.
              • Splunk Inc. - Overview
              • Splunk Inc. - Product / Service
              • Splunk Inc. - Key offerings
            • 12.16 VMware Inc.
              • VMware Inc. - Overview
              • VMware Inc. - Product / Service
              • VMware Inc. - Key offerings
            • 12.17 Zenoss Inc.
              • Zenoss Inc. - Overview
              • Zenoss Inc. - Product / Service
              • Zenoss Inc. - Key offerings

            13 Appendix

            • 13.1 Scope of the report
              • 13.2 Inclusions and exclusions checklist
                • Inclusions checklist
                • Exclusions checklist
              • 13.3 Currency conversion rates for US$
                • Currency conversion rates for US$
              • 13.4 Research methodology
                • Research methodology
              • 13.5 Data procurement
                • Information sources
              • 13.6 Data validation
                • Data validation
              • 13.7 Validation techniques employed for market sizing
                • Validation techniques employed for market sizing
              • 13.8 Data synthesis
                • Data synthesis
              • 13.9 360 degree market analysis
                • 360 degree market analysis
              • 13.10 List of abbreviations
                • List of abbreviations

              Research Methodology

              Technavio presents a detailed picture of the market by way of study, synthesis, and summation of data from multiple sources. The analysts have presented the various facets of the market with a particular focus on identifying the key industry influencers. The data thus presented is comprehensive, reliable, and the result of extensive research, both primary and secondary.

              INFORMATION SOURCES

              Primary sources

              • Manufacturers and suppliers
              • Channel partners
              • Industry experts
              • Strategic decision makers

              Secondary sources

              • Industry journals and periodicals
              • Government data
              • Financial reports of key industry players
              • Historical data
              • Press releases

              DATA ANALYSIS

              Data Synthesis

              • Collation of data
              • Estimation of key figures
              • Analysis of derived insights

              Data Validation

              • Triangulation with data models
              • Reference against proprietary databases
              • Corroboration with industry experts

              REPORT WRITING

              Qualitative

              • Market drivers
              • Market challenges
              • Market trends
              • Five forces analysis

              Quantitative

              • Market size and forecast
              • Market segmentation
              • Geographical insights
              • Competitive landscape

              Interested in this report?

              Get your sample now to see our research methodology and insights!

              Download Now

              Frequently Asked Questions

              It Monitoring Tools market growth will increase by $ 107519 mn during 2024-2028.

              The It Monitoring Tools market is expected to grow at a CAGR of 42.17% during 2024-2028.

              It Monitoring Tools market is segmented by Product( ITOA, ITIM, Others) Deployment( On-premise, Cloud-based, APAC, South America, Middle East and Africa)

              BMC Software Inc., Broadcom Inc., Circonus Inc., Datadog Inc., Hewlett Packard Enterprise Co., International Business Machines Corp., ITRS Group Ltd., Microsoft Corp., Nagios Enterprises LLC., NetScout Systems Inc., New Relic Inc., Open Text Corporation, Paessler AG, SAS Institute Inc., SolarWinds Corp., Splunk Inc., VMware Inc., Zabbix LLC., Zenoss Inc., Zoho Corp. Pvt. Ltd. are a few of the key vendors in the It Monitoring Tools market.

              North America will register the highest growth rate of 42% among the other regions. Therefore, the It Monitoring Tools market in North America is expected to garner significant business opportunities for the vendors during the forecast period.

              US, China, UK, Germany, Canada

              • Improving efficiency of IT operationsIT monitoring tools allow businesses to track the performance of critical IT infrastructure is the driving factor this market.
              • including servers is the driving factor this market.
              • websites is the driving factor this market.
              • and applications is the driving factor this market.
              • in real time. The tools monitor downtime is the driving factor this market.
              • bandwidth use is the driving factor this market.
              • performance metrics is the driving factor this market.
              • hardware outages is the driving factor this market.
              • and other issues. A single hour of IT downtime can severely affect business profitability due to customer and productivity losses. These losses may amount to several thousands of dollars. The use of monitoring tools helps businesses maintain their online presence and improve operational efficiency. The advantage that these tools provide to businesses is increasing their adoption rate among prospective end-users. ITIM tools constantly monitor the availability of all the connected IT infrastructure hardware that is hosted on-site or in the cloud. The ITIM software also keeps a check on the real-time availability status and use of each of the machines or hardware. The hardware devices include virtual machines is the driving factor this market.
              • routers is the driving factor this market.
              • network switches is the driving factor this market.
              • processors is the driving factor this market.
              • storage devices is the driving factor this market.
              • databases is the driving factor this market.
              • and hypervisors within a network. When any hardware goes offline or performance drops are detected is the driving factor this market.
              • these tools automatically alert the infrastructure operator and IT management and support teams. This helps IT managers in restoring functions within a short period is the driving factor this market.
              • reducing application downtime. Similarly is the driving factor this market.
              • ITOA applications perform analysis of historical IT operations data and analyze the impact of hardware failures and performance drops across the business. The application also identifies problems before they occur. This helps IT teams in isolating the failing systems and perform predictive maintenance. Thus is the driving factor this market.
              • boosting the growth of the market in focus during the forecast period. is the driving factor this market.

              The It Monitoring Tools market vendors should focus on grabbing business opportunities from the ITOA segment as it accounted for the largest market share in the base year.