IT Staffing Market Size 2024-2028
The IT staffing market size is forecast to increase by USD 96.8 billion at a CAGR of 8.5% between 2023 and 2028. The market is experiencing significant shifts as businesses increasingly rely on technology and data-driven recruitment strategies. Expanding collaborations between organizations and freelance workers are driving market growth, as digital transformation continues to reshape industries. To address this issue, recruitment marketing strategies, such as employer branding and HR payroll, are gaining popularity. However, the scarcity of skilled professionals poses a challenge. Human cloud services are also gaining traction, offering businesses access to a flexible workforce. Ethical data use is a critical consideration in these efforts, as intelligent algorithms and telecommunications enable more efficient job recruitment processes. By staying abreast of these trends and implementing effective recruitment strategies, businesses can navigate the market and secure the talent they need to thrive.
What will be the Size of the Market During the Forecast Period?
The market is undergoing significant changes due to the integration of advanced technologies. These innovations are revolutionizing HR activities, enabling organizations to recruit, retain, and manage IT professionals more effectively. Advanced technologies, such as AI and advanced analytics, are transforming the recruitment process. HR departments are leveraging AI to screen resumes, identify top candidates, and streamline interview scheduling. AI-powered chatbots are also being used to engage with candidates and answer their queries, providing a more personalized and efficient experience. Moreover, IT decision makers are increasingly adopting cloud services for their HR functions.
Moreover, cloud-based HR analytics tools enable organizations to gain insights into workforce productivity, performance, and retention. These tools help IT organizations make data-driven decisions, optimize their workforce, and improve overall business outcomes. The demand for cybersecurity professionals is also driving the market in the US. With the increasing number of cyber threats, organizations are investing in securing their digital assets. As a result, there is a growing need for skilled cybersecurity professionals to protect against these threats. The digitization of HR functions is also leading to the automation of routine HR tasks, freeing up HR staff to focus on more strategic initiatives.
Furthermore, this trend is particularly relevant in the context of remote work and hybrid models, which have become increasingly common due to the pandemic. However, the market in the US is facing talent shortages, particularly in niche areas such as AI and cybersecurity. To address this challenge, organizations are focusing on diversity, equity, and inclusion initiatives to broaden their talent pool. They are also investing in candidate experience to attract and retain top talent. Leading companies in the market are also offering professional services to help organizations navigate these changes. For instance, Bullhorn for Salesforce is a popular solution that streamlines hiring processes and improves talent acquisition.
Market Segmentation
The market research report provides comprehensive data (region-wise segment analysis), with forecasts and estimates in "USD billion" for the period 2024-2028, as well as historical data from 2018-2022 for the following segments.
- Type
- Temporary staffing
- Permanent placement
- Contract staffing
- Outsourced recruitment
- Executive search
- End-user
- Information technology
- BFSI
- Telecommunication
- Manufacturing
- Others
- Geography
- North America
- Canada
- US
- Europe
- Germany
- UK
- France
- APAC
- China
- India
- Japan
- South America
- Middle East and Africa
- North America
By Type Insights
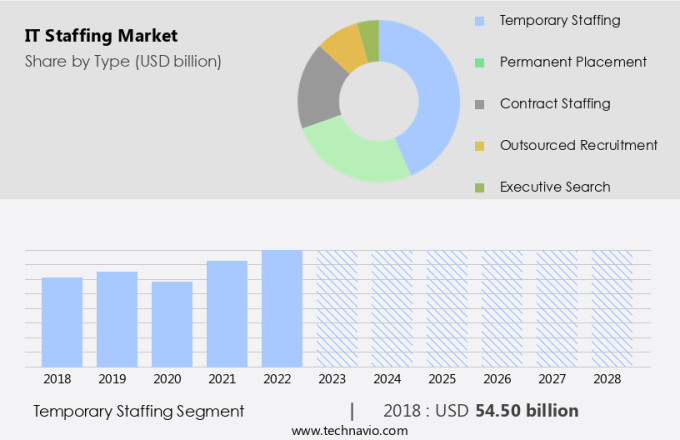
The temporary staffing segment is estimated to witness significant growth during the forecast period. The market in the US is experiencing shifts in response to emerging technologies and evolving business needs. Temporary staffing, a flexible employment model, plays a crucial role in this sector, enabling organizations to access skilled professionals for short-term assignments and adapt to project demands. The total number of temporary IT positions also saw a decline of 12.5% between these years. Automation, cloud services, and cybersecurity are key areas driving the demand for skilled employees in the IT industry.
Furthermore, as digitization continues to transform businesses, companies require professionals with expertise in these areas to maintain and optimize their technology infrastructure. Software developers and remote IT operations specialists are also in high demand, as organizations increasingly rely on technology to support their operations. Talent inventory and skills adjacency are essential considerations for organizations looking to hire temporary IT staff. Career paths in areas like artificial intelligence and machine learning offer exciting opportunities for professionals seeking to expand their skill sets and advance their careers. As the IT landscape continues to evolve, staying informed about emerging technologies and the skills required to work with them will be crucial for both employers and job seekers.
Get a glance at the market share of various segments Request Free Sample
The temporary staffing segment accounted for USD 54.50 billion in 2018 and showed a gradual increase during the forecast period.
Regional Insights
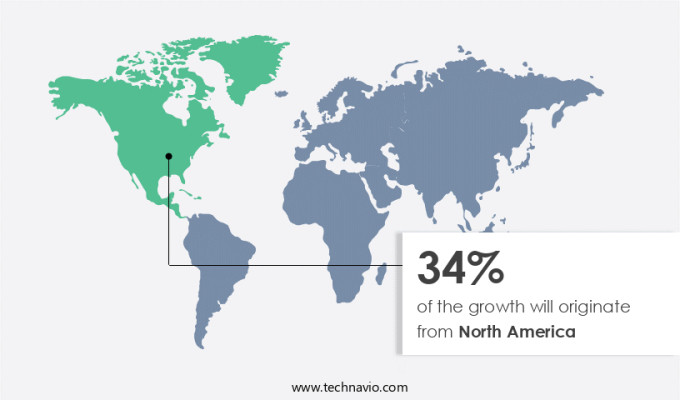
North America is estimated to contribute 34% to the growth of the global market during the forecast period. Technavio's analysts have elaborately explained the regional trends and drivers that shape the market during the forecast period.
For more insights on the market share of various regions Request Free Sample
The market in North America is a significant contributor to the global industry, with the United States and Canada leading the demand. Notable companies, including Innova Solutions, Volt, and HireGenics, have shaped the IT staffing landscape in the region. These firms offer a diverse range of services, from IT staffing to industrial solutions, demonstrating the cross-sector impact of IT capabilities. The US dominates the North American market due to its expansive technology and industrial sectors and the growing requirement for specialized talent in areas like cloud computing, cybersecurity, and data analytics.
Furthermore, in the realm of IT staffing, diversity, equity, and inclusion have become essential components of talent acquisition strategies. Leading companies prioritize these initiatives to ensure a positive candidate experience. Staffing technology plays a crucial role in streamlining the recruitment process, enhancing efficiency, and improving overall service quality. Brands are investing in developing effective branding strategies to attract top talent in a competitive market. In conclusion, the market in North America continues to thrive, driven by the US's strong technology and industrial sectors and the increasing demand for specialized talent. Companies are focusing on diversity, equity, and inclusion to enhance candidate experience and employing advanced staffing technology to improve service quality. The future of the industry lies in adapting to the evolving needs of businesses and fostering a diverse and inclusive workforce.
Our researchers analyzed the data with 2023 as the base year, along with the key drivers, trends, and challenges. A holistic analysis of drivers will help companies refine their marketing strategies to gain a competitive advantage.
Market Driver
Expanding collaborations is the key driver of the market. The market is experiencing a significant shift towards collaborative partnerships as companies strive to innovate and improve operational efficiencies. Notable industry players are making strategic moves to offer comprehensive solutions that cater to the evolving demands of the market. Furthermore, these technologies enable faster and more accurate resume screening, candidate matching, and interview scheduling. Additionally, they offer reporting and analytics capabilities, allowing recruiters to gain valuable insights into their recruitment efforts and make data-driven decisions. In conclusion, the IT staffing industry is undergoing a digital transformation, driven by the need to adapt to evolving market demands and the gig economy. Collaborative partnerships, advanced technologies, and data-driven recruitment strategies are essential components of this transformation. Companies that invest in these areas will be well-positioned to attract and retain top talent and maintain a competitive edge in the market.
Market Trends
Expansion of digital transformation is the upcoming trend in the market. The market is experiencing a significant transformation as Global Capability Centers (GCCs) expand their presence in India. Corporations in the US and North America are recognizing the value of collaborating with skilled IT professionals from leading Indian companies for their in-house projects. India's reputation as a hub for digital transformation capabilities, coupled with its cost advantages, is driving this trend. These numbers represent a substantial contribution to India's overall IT workforce of approximately 5 million.
Furthermore, this shift underscores the growing importance of IT staffing in the digital age and the role of India as a key player in the global IT landscape. Companies are recognizing the benefits of accessing a large, skilled talent pool in India to drive their digital transformation initiatives.
Market Challenge
The scarcity of skilled professionals is a key challenge affecting the market growth. The market is experiencing a significant shift due to the increasing demand for skilled professionals in response to the integration of advanced technologies such as Generative AI and automation. According to recent studies, approximately 40% of the global workforce, equating to around 1.4 billion individuals, may need to be reskilled within the next three years to meet the evolving demands of these technologies. This skills gap poses a challenge for organizations, requiring them to both recruit new talent with the necessary technical expertise and invest in the training of their existing workforce. To address this challenge, organizations are turning to data-driven recruitment strategies.
Furthermore, these strategies leverage intelligent algorithms and ethical data use to identify and attract top talent through various channels, including social media platforms, job boards, and telecommunications. Additionally, human cloud services and company management systems are becoming increasingly popular solutions for managing and optimizing the recruitment process.
Exclusive Customer Landscape
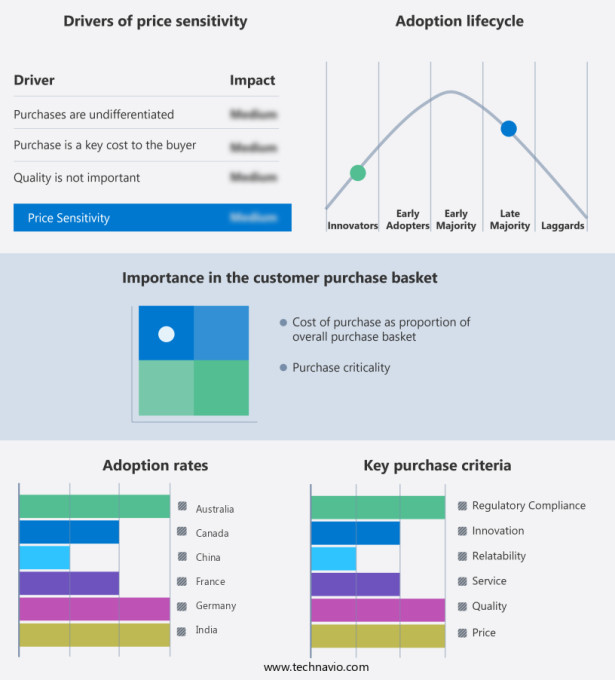
The market forecasting report includes the adoption lifecycle of the market, covering from the innovator's stage to the laggard's stage. It focuses on adoption rates in different regions based on penetration. Furthermore, the report also includes key purchase criteria and drivers of price sensitivity to help companies evaluate and develop their market growth analysis strategies.
Customer Landscape
Key Companies & Market Insights
Companies are implementing various strategies, such as strategic alliances, partnerships, mergers and acquisitions, geographical expansion, and product/service launches, to enhance their presence in the market.
AD IT Solutions LLC.: The company offers contract staffing, direct hiring, and recruitment process outsourcing services for IT roles.
The market research and growth report includes detailed analyses of the competitive landscape of the market and information about key companies, including:
- AmberIT Staffing Solutions LLC
- AND IT Tech, LLC
- Apollo Technical LLC
- CIEL HR Services Ltd.
- Damco Group
- Dexian Inc.
- Eastridge Workforce Solutions
- GlobalHunt India Pvt. Ltd.
- Hays Plc
- Insight Global, LLC
- itForte Staffing Services Pvt Ltd.
- Quess Corp. Ltd
- ROBERT HALF INC
- Scion Staffing, Inc.
- Spear Staffing LLC
- SPECTRUM TALENT MANAGEMENT LTD.
- TeamLease Services Ltd.
- TechWise Digital Pvt. Ltd.
- The Computer Merchant, Ltd.
Qualitative and quantitative analysis of companies has been conducted to help clients understand the wider business environment as well as the strengths and weaknesses of key market players. Data is qualitatively analyzed to categorize companies as pure play, category-focused, industry-focused, and diversified; it is quantitatively analyzed to categorize companies as dominant, leading, strong, tentative, and weak.
Research Analyst Overview
The market is experiencing significant changes due to the integration of advanced technologies such as artificial intelligence (AI) and advanced analytics. These technologies are revolutionizing HR activities, enabling IT professionals to focus on productivity and performance while HR teams leverage HR analytics for retention and skills adjacency. The digitization of HR processes has led to the automation of recruitment and the adoption of cloud services for talent inventory management. The demand for cybersecurity professionals is at an all-time high, driven by the increasing digitization of businesses and the need for data security. Upskilling and reskilling are becoming essential for IT infrastructure development and the implementation of cloud-based systems.
Furthermore, remote IT operations and the gig economy are transforming the workforce, leading to the need for new talent acquisition strategies. Staffing needs are evolving, and recruitment software, generative AI, and reporting tools are becoming essential for IT decision makers. The candidate experience is a top priority, and HR marketing strategies, employer branding, and social media platforms are essential for attracting skilled employees. HR teams are leveraging AI-powered tools to identify and address bias in recruitment and hiring processes (AI Recruitment). The staffing technology service market is expected to grow significantly due to economic growth, talent shortages, and the increasing adoption of hybrid models and remote work. Leading companies are investing in brand development strategies, recruitment marketing, and online recruitment platforms to meet the changing needs of businesses. HR activities (HR software market), including recruitment, performance management, and workforce planning, are being transformed through the use of these technologies. The future of staffing is digital, and IT infrastructure, business process management, and networking will continue to be key areas of focus.
|
Market Scope |
|
|
Report Coverage |
Details |
|
Page number |
215 |
|
Base year |
2023 |
|
Historic period |
2018-2022 |
|
Forecast period |
2024-2028 |
|
Growth momentum & CAGR |
Accelerate at a CAGR of 8.5% |
|
Market Growth 2024-2028 |
USD 96.8 billion |
|
Market structure |
Fragmented |
|
YoY growth 2023-2024(%) |
7.3 |
|
Regional analysis |
North America, Europe, APAC, South America, and Middle East and Africa |
|
Performing market contribution |
North America at 34% |
|
Key countries |
US, Japan, UK, Germany, The Netherlands, France, Australia, China, Canada, and India |
|
Competitive landscape |
Leading Companies, Market Positioning of Companies, Competitive Strategies, and Industry Risks |
|
Key companies profiled |
AD IT Solutions LLC., AmberIT Staffing Solutions LLC, AND IT Tech, LLC, Apollo Technical LLC, CIEL HR Services Ltd., Damco Group, Dexian Inc., Eastridge Workforce Solutions, GlobalHunt India Pvt. Ltd., Hays Plc, Insight Global, LLC, itForte Staffing Services Pvt Ltd., Quess Corp. Ltd, ROBERT HALF INC, Scion Staffing, Inc., Spear Staffing LLC, SPECTRUM TALENT MANAGEMENT LTD., TeamLease Services Ltd., TechWise Digital Pvt. Ltd., and The Computer Merchant, Ltd. |
|
Market dynamics |
Parent market analysis, market growth inducers and obstacles, market forecast, fast-growing and slow-growing segment analysis, COVID-19 impact and recovery analysis and future consumer dynamics, market condition analysis for the forecast period |
|
Customization purview |
If our market report has not included the data that you are looking for, you can reach out to our analysts and get segments customized. |
What are the Key Data Covered in this Market Research and Growth Report?
- CAGR of the market during the forecast period
- Detailed information on factors that will drive the market growth and forecasting between 2024 and 2028
- Precise estimation of the size of the market and its contribution of the market in focus to the parent market
- Accurate predictions about upcoming market growth and trends and changes in consumer behaviour
- Growth of the market across North America, Europe, APAC, South America, and Middle East and Africa
- Thorough analysis of the market's competitive landscape and detailed information about companies
- Comprehensive analysis of factors that will challenge the growth of market companies
We can help! Our analysts can customize this market research report to meet your requirements. Get in touch


