
Japan Automotive Engineering Service Providers (ESP) Market Size 2024-2028
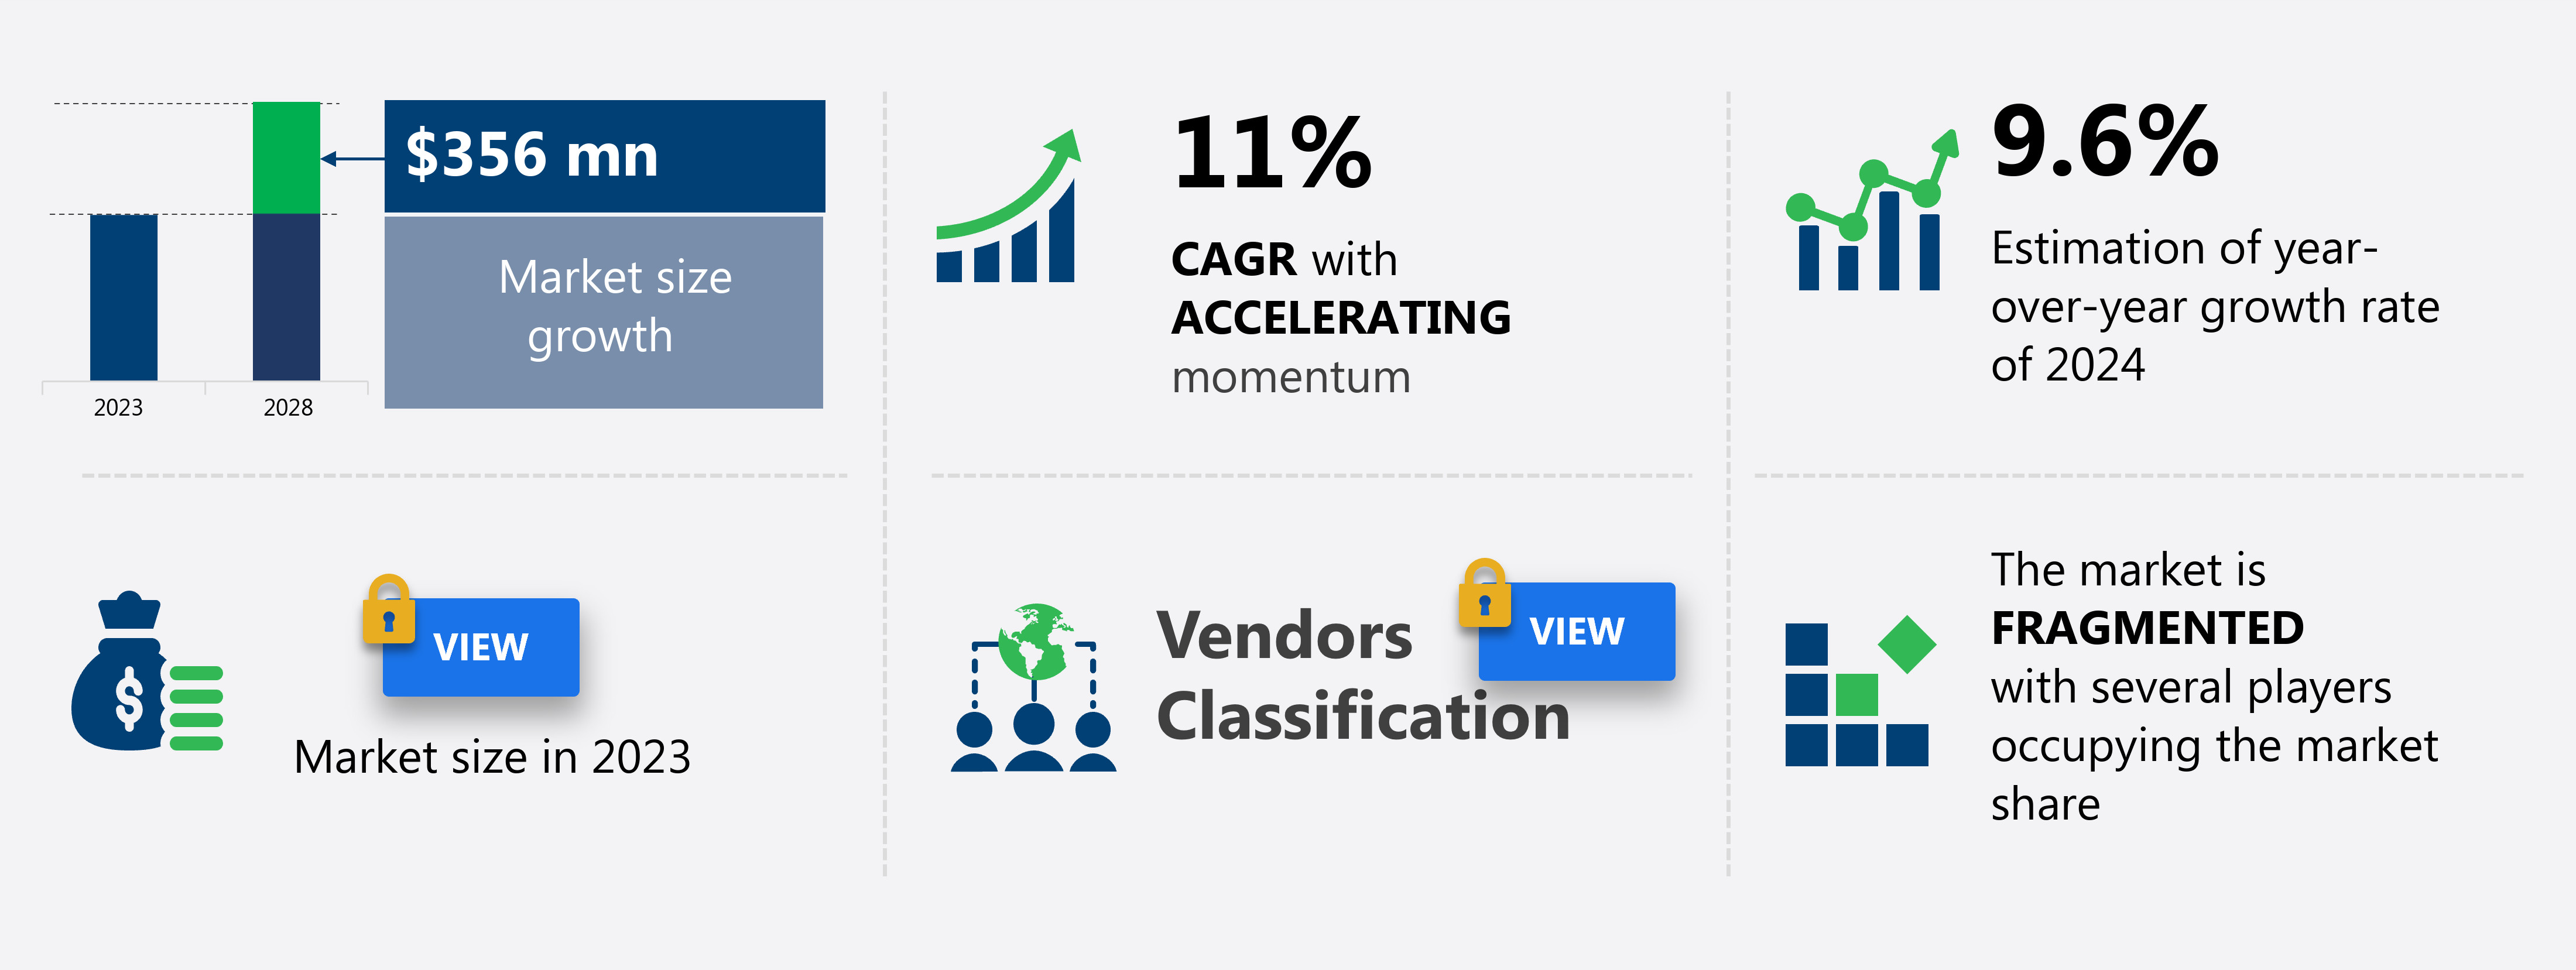
The Japan ESP market size is forecast to increase by USD 356 million at a CAGR of 11% between 2023 and 2028.
- The market is experiencing significant growth, driven by technological innovations and inorganic growth strategies. The Japanese automotive industry is renowned for its commitment to research and development, with ESPs playing a pivotal role in driving technological advancements. Advanced engineering services, such as simulation, testing, and design, enable Japanese automakers to produce vehicles that meet the evolving demands of consumers and regulatory bodies. However, the market faces challenges that require strategic navigation. Regulatory hurdles, including stringent safety and emissions standards, impact adoption of new technologies and increase operational costs. Supply chain inconsistencies, particularly in the semiconductor sector, temper growth potential.
- Furthermore, cybersecurity concerns are escalating, with the increasing digitization of vehicles and manufacturing processes. ESPs must invest in robust cybersecurity measures to protect intellectual property and maintain client trust. Despite these challenges, the market offers ample opportunities for growth. The shift towards electric and autonomous vehicles is creating a surge in demand for engineering services related to battery technology, software development, and system integration. Strategic partnerships, acquisitions, and collaborations can help ESPs expand their capabilities and tap into new markets. By addressing regulatory and supply chain challenges and capitalizing on technological trends, ESPs can effectively navigate the dynamic landscape of the Japanese automotive industry.
What will be the size of the Japan Automotive Engineering Service Providers (ESP) Market during the forecast period?
How is this market segmented?
The market research report provides comprehensive data (region-wise segment analysis), with forecasts and estimates in "USD million" for the period 2024-2028, as well as historical data from 2018-2022 for the following segments.
- Application
- In-house
- Out-source
- Product Type
- Electrical and electronics
- Powertrain
- Complete vehicle
- Others
- Vehicle Type
- Passenger cars
- Commercial vehicles
- End-User
- OEMs
- Tier-1 Suppliers
- Aftermarket
- Geography
- APAC
- Japan
- APAC
By Application Insights
The in-house segment is estimated to witness significant growth during the forecast period.
In-house automotive engineering services play a pivotal role in the Japanese automotive engineering service providers (ESP) market. These services enable manufacturers to conduct testing, inspection, and certification (TIC) activities internally, rather than outsourcing them. This approach is common in the automotive sector, where stringent quality control and assurance processes are essential. Manufacturers invest heavily in advanced test equipment and skilled personnel to carry out in-house TIC activities, which cover tasks such as testing electronic control units (ECUs) and ensuring component compliance with safety and quality standards.
In addition, in-house engineering services encompass areas like transmission design, safety engineering, connected car technologies, testing services, regulatory compliance, design services, emissions testing, manufacturing support, machine learning, vehicle engineering, chassis design, aluminum alloys, durability testing, vehicle electrification, quality assurance, engine optimization, after-sales services, reliability testing, crash testing, data analytics, computer-aided engineering (CAE), technology partnerships, electric vehicles (EV), cloud computing, advanced materials, virtual prototyping, research and development, autonomous driving, prototype development, digital twins, innovation centers, automotive component manufacturers, simulation services, powertrain engineering, carbon fiber, analysis services, and both tier 2 and tier 1 suppliers.The use of lightweight materials is also a significant trend in the market. In-house engineering services support these diverse areas, ensuring that manufacturers maintain control over their production processes and adhere to the latest industry standards.
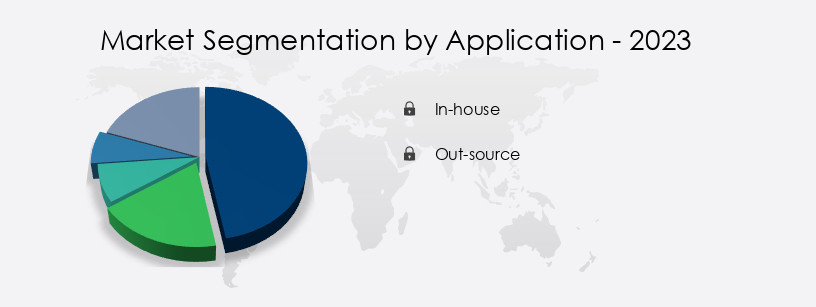
The In-house segment was valued at USD 272.40 million in 2018 and showed a gradual increase during the forecast period.
Market Dynamics
Our researchers analyzed the data with 2023 as the base year, along with the key drivers, trends, and challenges. A holistic analysis of drivers will help companies refine their marketing strategies to gain a competitive advantage.
The Japan Automotive Engineering Service Providers Market is evolving rapidly, driven by demand for automotive engineering services for electric vehicles in Japan and ADAS development services for Japanese OEMs. Providers offer advanced autonomous vehicle testing solutions in Japan and specialize in powertrain engineering for hybrid vehicles. With a focus on connectivity, firms excel in infotainment system design for connected cars and battery management system integration in Japan. Ensuring safety, vehicle cybersecurity solutions for automotive OEMs are critical. Additionally, sustainable automotive engineering services in Japan, prototyping services for autonomous driving systems, and Japan automotive R&D services for Tier 1 suppliers support innovation and growth.
What are the Japan Automotive Engineering Service Providers (ESP) Market market drivers leading to the rise in adoption of the Industry?
- Technological innovations serve as the primary catalyst for market growth, driving progress and advancement within various industries. A key example is the 2023 partnership between KPIT Technologies Ltd. and Honda to advance Honda's Software-Defined Mobility (SDM) initiative. This collaboration combines Honda's expertise in software architecture and control-safety technology with KPIT's strengths in autonomous driving, vehicle electrification, infotainment systems, and platform software.
- The integration of next-generation software is essential for safer, more efficient, and user-friendly vehicles. Advanced software supports autonomous navigation, optimizes battery performance in electric vehicles, and enhances infotainment systems for seamless connectivity. Platform software also plays a critical role by unifying vehicle systems for a cohesive driving experience.Such partnerships highlight how software-driven innovation is reshaping the automotive landscape in Japan, enabling manufacturers to deliver greater value and smarter mobility as service solutions.
What are the Japan Automotive Engineering Service Providers (ESP) Market market trends shaping the Industry?
Inorganic growth strategies, such as mergers and acquisitions or strategic partnerships, are currently gaining traction in the business world as effective methods for expanding a company's market presence and increasing revenue.
- Japan's automotive engineering service providers (ESP) market is increasingly embracing inorganic growth strategies to boost capabilities, accelerate innovation, and expand market presence. A notable example is the January 2023 Memorandum of Understanding (MoU) between SCSK Corporation and FEV Japan Co., Ltd., a subsidiary of Germany-based FEV Group. This agreement aims to deepen their collaboration in engineering services, with formalization targeted for the first half of FY2023.
- Inorganic approaches such as mergers, acquisitions, and strategic partnerships allow companies to scale quickly, access advanced technologies, and enter new markets more efficiently than through organic growth. The SCSKâFEV Japan partnership exemplifies this by combining their technical expertise to deliver more robust, integrated solutions. This shift is driven by the growing demand for sustainable and tech-forward mobility solutions in Japan. Strategic alliances are enabling companies to address complex engineering challenges, respond faster to market shifts, and stay competitive.In summary, inorganic growth is emerging as a key strategy in Japan's automotive ESP sector, with partnerships like SCSK and FEV Japan at the forefront. This trend is expected to gain further traction as firms pursue collaborative pathways to innovation and market leadership.
How does Japan Automotive Engineering Service Providers (ESP) Market market faces challenges face during its growth?
- Cybersecurity concerns represent a significant challenge to the growth of various industries, as ensuring the protection of digital information and systems has become a mandatory priority in today's interconnected business landscape.
- Cybersecurity has emerged as a critical challenge in Japan's automotive engineering service providers (ESP) market, as vehicles become more connected and software-driven. The January 2024 collaboration between the Automotive Information Sharing and Analysis Center (Auto-ISAC) and the Japan Automotive ISAC (J-Auto-ISAC) highlights the urgent need to strengthen cybersecurity across the sector.This partnership focuses on enhancing information sharing related to vehicle cybersecurity, aiming to better defend against increasingly sophisticated cyber threats. As vehicles integrate more ECUs and connected systems, the potential attack surface expands, increasing the risk of hacking, data breaches, and unauthorized system access.
- The complexity of modern automotive software and the rapid pace of technological change demand continuous security updates, proactive threat monitoring, and the adoption of advanced protective measures such as encryption and intrusion detection systems.
- The Auto-ISAC and J-Auto-ISAC alliance promotes the exchange of threat intelligence and best practices, helping ESPs build more resilient security frameworks. In summary, cybersecurity remains a top concern for automotive ESP market. As vehicles evolve, so must the industry's defense strategies making collaboration and proactive security essential to ensuring vehicle safety and reliability.
Exclusive Japan Automotive Engineering Service Providers (ESP) Market Customer Landscape
The market forecasting report includes the adoption lifecycle of the market, covering from the innovator's stage to the laggard's stage. It focuses on adoption rates in different regions based on penetration. Furthermore, the report also includes key purchase criteria and drivers of price sensitivity to help companies evaluate and develop their market growth analysis strategies.

Customer Landscape
Key Companies & Market Insights
Companies are implementing various strategies, such as strategic alliances, market forecast partnerships, mergers and acquisitions, geographical expansion, and product/service launches, to enhance their presence in the market.
The market research and growth report includes detailed analyses of the competitive landscape of the market and information about key companies, including:
- DENSO Corporation
- Aisin Seiki Co. Ltd.
- Hitachi Astemo Ltd.
- Mitsubishi Electric Corporation
- NTT Data Corporation
- Fujitsu Limited
- NEC Corporation
- Toshiba Digital Solutions Corporation
- Panasonic Automotive Systems
- Sumitomo Electric Industries Ltd.
- Yazaki Corporation
- JTEKT Corporation
- Calsonic Kansei Corporation
- Mabuchi Motor Co. Ltd.
- Nippon Seiki Co. Ltd.
- Koito Manufacturing Co. Ltd.
- Toyoda Gosei Co. Ltd.
- Stanley Electric Co. Ltd.
- NSK Ltd.
- Nidec Corporation
Qualitative and quantitative analysis of companies has been conducted to help clients understand the wider business environment as well as the strengths and weaknesses of key market players. Data is qualitatively analyzed to categorize companies as pure play, category-focused, industry-focused, and diversified; it is quantitatively analyzed to categorize companies as dominant, leading, strong, tentative, and weak.
Recent Development and News in Automotive Engineering Service Providers Market In Japan
- In February 2024, Denso Corporation, a leading automotive technology supplier in Japan, announced the launch of its new engineering service, "Denso Innovation Lab Tokyo," to provide advanced engineering solutions for connected and autonomous vehicles. This initiative aims to strengthen Denso's position in the Japanese ESP market by focusing on R&D and innovation (Denso Press Release, 2024).
- In July 2025, Toyota Motor Corporation and Panasonic Corporation entered into a strategic partnership to jointly develop and manufacture automotive batteries, aiming to reduce costs and improve battery quality for electric vehicles. This collaboration is expected to significantly impact the Japanese ESP market, as both companies are major players in the automotive and battery industries (Toyota Press Release, 2025).
- In October 2024, Hitachi Automotive Systems, Ltd. Announced the acquisition of Magna International's powertrain business in Japan, expanding Hitachi's capabilities in engine systems, transmissions, and electric motor production. This acquisition is expected to increase Hitachi's market share and strengthen its position in the Japanese ESP market (Hitachi Press Release, 2024).
- In March 2025, the Japanese government announced the "Green Car Incentive Program 2.0," providing subsidies for the purchase of electric and hydrogen fuel cell vehicles. This initiative is expected to boost demand for ESP services related to the development and production of electric and hydrogen vehicles in Japan (Japan Ministry of Economy, Trade and Industry Press Release, 2025).
Research Analyst Overview
The market continues to evolve, driven by the dynamic interplay of various sectors and emerging technologies. Transmission design, safety engineering, connected car technologies, testing services, regulatory compliance, design services, emissions testing, manufacturing support, and machine learning are integral components of this industry's ongoing evolution. Vehicle engineering encompasses chassis design, utilizing advanced materials such as aluminum alloys, and durability testing. The integration of vehicle electrification necessitates engine optimization, quality assurance, and reliability testing. After-sales services and emissions testing ensure customer satisfaction and regulatory compliance. Connected car technologies, powered by big data and cloud computing, enable data analytics and vehicle electrification.
The Japan Automotive Engineering Service Providers Market is rapidly adopting innovations like next-generation battery technologies and AI-powered diagnostic tools to enhance vehicle performance and efficiency. Providers are leveraging over-the-air (OTA) software updates and modular vehicle platforms for greater flexibility and scalability. Emphasis on sustainable material engineering and smart manufacturing processes supports environmental goals. Advanced predictive maintenance systems improve reliability, while augmented reality for design accelerates development cycles. To strengthen logistics and transparency, firms are exploring blockchain for supply chain management. Moreover, 5G-enabled vehicle connectivity is transforming communication, enabling real-time data exchange critical for autonomous and connected vehicles in Japan.
The market is characterized by a focus on product lifecycle management and innovation, driven by the need for vehicle performance improvement and electrification strategy. Data privacy is a critical concern as connected car infrastructure expands, necessitating robust security measures and intellectual property protection. Quality control and vehicle reliability remain top priorities, with advanced manufacturing techniques, such as additive manufacturing, enabling customization and cost optimization. Supply chain management is essential for maintaining fuel efficiency and ensuring safety features, while technology licensing and patent protection are key strategies for competitive advantage. Vehicle telematics and safety features are shaping the repair and maintenance landscape, with a growing emphasis on aftermarket services and automotive cybersecurity.
Sustainable mobility is a significant trend, with ESPs investing in vehicle lifecycle management and developing strategies for vehicle customization and vehicle lifecycle management. Overall, the Japanese ESP market is dynamic and innovative, with a strong focus on technology and quality.
Technology partnerships and research and development foster innovation in areas like autonomous driving, prototype development, and digital twins. Automotive component manufacturers, from Tier 1 to Tier 2 suppliers, collaborate in powertrain engineering, utilizing simulation services and carbon fiber for enhanced performance and lightweight materials. The industry's continuous dynamism is reflected in its commitment to innovation centers and the pursuit of new technologies, such as machine learning and advanced materials, to meet evolving consumer demands and regulatory requirements.
Dive into Technavio's robust research methodology, blending expert interviews, extensive data synthesis, and validated models for unparalleled Automotive Engineering Service Providers (ESP) Market in Japan insights. See full methodology.
|
Market Scope |
|
|
Report Coverage |
Details |
|
Page number |
175 |
|
Base year |
2023 |
|
Historic period |
2018-2022 |
|
Forecast period |
2024-2028 |
|
Growth momentum & CAGR |
Accelerate at a CAGR of 11% |
|
Market growth 2024-2028 |
USD 356 million |
|
Market structure |
Fragmented |
|
YoY growth 2023-2024(%) |
9.6 |
|
Competitive landscape |
Leading Companies, Market Positioning of Companies, Competitive Strategies, and Industry Risks |
What are the Key Data Covered in this Market Research Report?
- CAGR of the market during the forecast period
- Detailed information on factors that will drive the market growth and forecasting between 2024 and 2028
- Precise estimation of the size of the market and its contribution of the market in focus to the parent market
- Accurate predictions about upcoming market growth and trends and changes in consumer behaviour
- Growth of the market across Japan
- Thorough analysis of the market's competitive landscape and detailed information about companies
- Comprehensive analysis of factors that will challenge the growth of market companies
We can help! Our analysts can customize this market research report to meet your requirements Get in touch