
Japan Cloud Computing Market Size 2026-2030
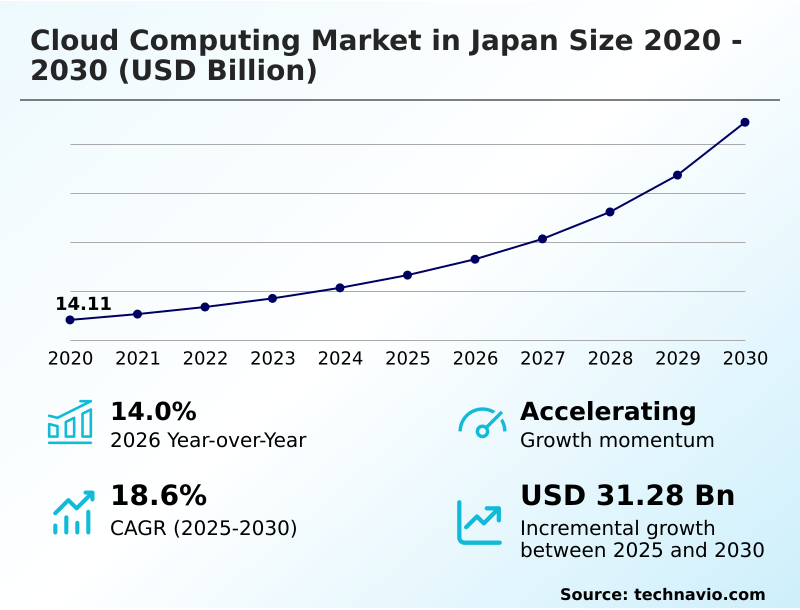
The japan cloud computing market size is valued to increase by USD 31.28 billion, at a CAGR of 18.6% from 2025 to 2030. Digital transformation initiatives across various industries will drive the japan cloud computing market.
Major Market Trends & Insights
- By Service - SaaS segment was valued at USD 11.65 billion in 2024
- By Deployment - Public cloud segment accounted for the largest market revenue share in 2024
Market Size & Forecast
- Market Opportunities: USD 40.44 billion
- Market Future Opportunities: USD 31.28 billion
- CAGR from 2025 to 2030 : 18.6%
Market Summary
- The cloud computing market in Japan is undergoing significant expansion, driven by widespread digital transformation and the need for operational agility. Key trends include the adoption of hybrid and multi-cloud strategies to balance cost, performance, and regulatory compliance, alongside a strong focus on sovereign cloud deployments to ensure data residency.
- The rapid integration of artificial intelligence, particularly generative AI, is compelling organizations to leverage scalable infrastructure-as-a-service for complex computational workloads. For instance, a manufacturing enterprise can utilize cloud platforms to modernize its supply chain, moving from rigid, on-premises systems to a flexible environment. This allows for real-time data analysis from IoT devices, enabling predictive maintenance and reducing operational downtime.
- However, the market is not without its challenges. Persistent cybersecurity threats, evolving data privacy regulations, and a significant talent shortage in specialized areas like cloud architecture and security engineering constrain the pace of adoption.
- Enterprises must navigate these complexities by investing in robust security frameworks, such as a zero-trust architecture, and fostering internal skills development to fully capitalize on the benefits of cloud technology and maintain a competitive edge.
What will be the Size of the Japan Cloud Computing Market during the forecast period?
Get Key Insights on Market Forecast (PDF) Get Free Sample
How is the Japan Cloud Computing Market Segmented?
The japan cloud computing industry research report provides comprehensive data (region-wise segment analysis), with forecasts and estimates in "USD million" for the period 2026-2030, as well as historical data from 2020-2024 for the following segments.
- Service
- SaaS
- IaaS
- PaaS
- Deployment
- Public cloud
- Private cloud
- End-user
- IT and telecommunications
- BFSI
- Government
- Others
- Sector
- SMEs
- Large enterprises
- Geography
- APAC
- Japan
- APAC
By Service Insights
The saas segment is estimated to witness significant growth during the forecast period.
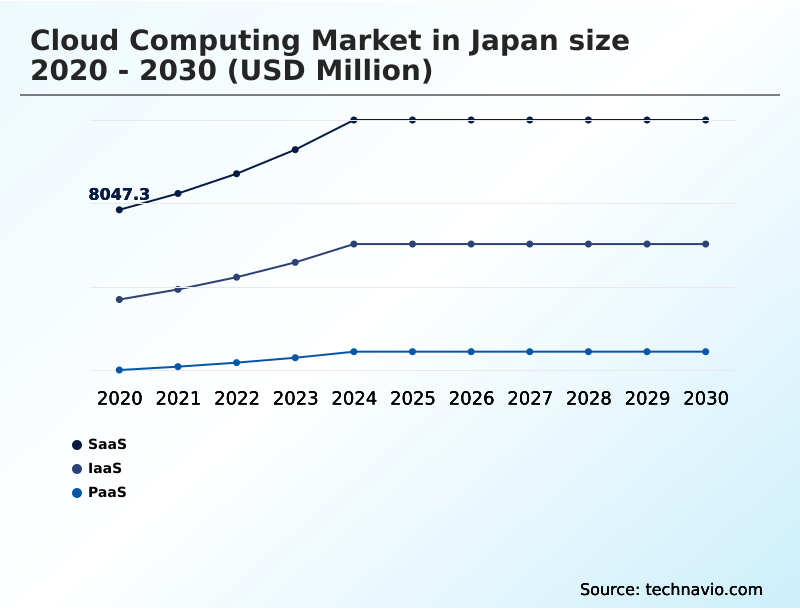
The SaaS segment leads the cloud computing market in Japan, valued for its flexible deployment and cost-effective subscription models.
Adoption is driven by enterprises seeking to replace legacy systems through mainframe migration and application refactoring, using modern architectures built on PaaS.
These platforms facilitate the development of applications using containerization and microservices, which are accessed through robust application programming interfaces (apis). The integration of sovereign AI capabilities within SaaS offerings is becoming critical, addressing data sovereignty and strengthening cloud governance.
This is supported by massive investments in underlying data center infrastructure, including specialized AI data center builds. This strategic shift has enabled a 34% adoption rate among certain SME groups, improving access to advanced tools like predictive maintenance software.
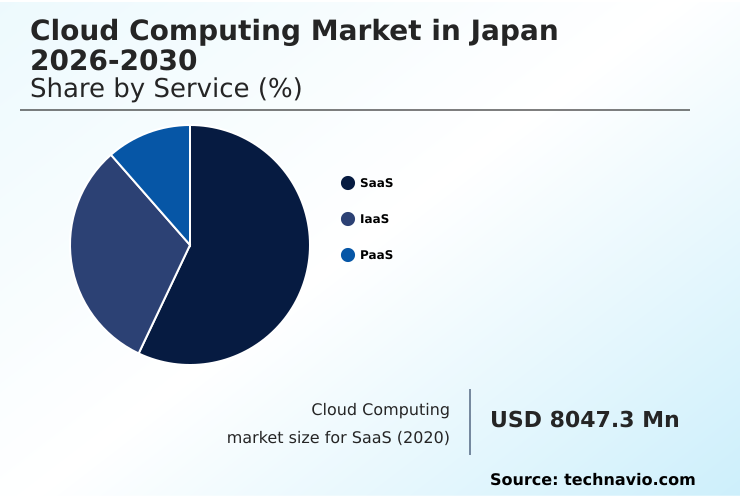
The SaaS segment was valued at USD 11.65 billion in 2024 and showed a gradual increase during the forecast period.
Market Dynamics
Our researchers analyzed the data with 2025 as the base year, along with the key drivers, trends, and challenges. A holistic analysis of drivers will help companies refine their marketing strategies to gain a competitive advantage.
- In the cloud computing market in Japan, enterprises are adopting highly specific strategies to maximize value. The use of iaas for generative ai workloads has become standard for companies needing scalable processing power without large capital outlays.
- For modernizing core business software, paas for application modernization projects provides the ideal environment, often combined with saas for enterprise resource planning to streamline operations. A key strategic focus is leveraging hybrid cloud for data sovereignty and implementing multi-cloud strategies for vendor lock-in avoidance, granting greater architectural flexibility.
- The public sector is a major adopter of sovereign cloud for public sector use cases to meet stringent data residency mandates. Operationally, organizations are implementing advanced security and management practices. Cloud security posture management (cspm) tools are critical for continuous monitoring, complemented by a proactive approach to cloud cost optimization techniques.
- The journey often begins with migrating legacy systems to cloud, a complex but necessary step for long-term agility. Specific industry applications are also gaining traction, such as the use of edge computing in manufacturing sector for real-time analytics on the factory floor. Looking ahead, quantum computing integration with cloud is an emerging frontier.
- Security remains paramount, with a focus on ai-driven cybersecurity in cloud and managing compliance in public cloud. Firms in regulated industries increasingly choose private cloud for financial services, while disaster recovery as a service (draas) ensures business continuity.
- These initiatives are guided by cloud native development best practices, including container orchestration with kubernetes, and are secured through zero-trust security model implementation. Many find the benefits of serverless architecture compelling, and teams are automating infrastructure with terraform, leading to deployment efficiencies that are twice as fast as manual methods.
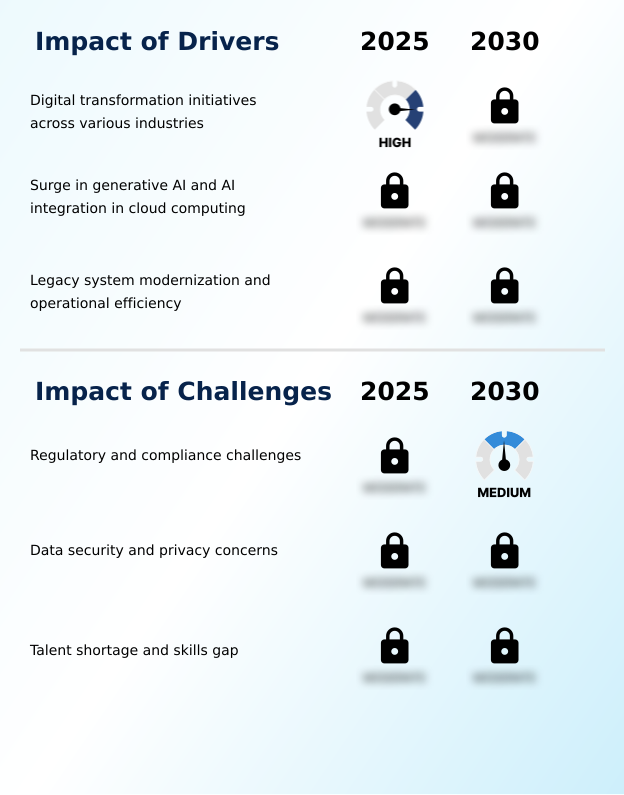
What are the key market drivers leading to the rise in the adoption of Japan Cloud Computing Industry?
- Digital transformation initiatives across various industries are a primary driver for the market's growth.
- A primary driver is widespread digital transformation, compelling enterprises to prioritize operational efficiency and technology integration. This involves extensive legacy system modernization, including mainframe migration to agile architectures.
- The surge in generative AI amplifies demand for scalable IaaS platforms capable of handling intense computational workloads and accelerating AI model training.
- To support this, organizations are building cloud native applications and leveraging infrastructure as code (iac) for automated, repeatable deployments.
- This broad cloud adoption is further fueled by significant investments in infrastructure with enhanced GPU acceleration, enabling enterprises to harness advanced analytics for a competitive edge.
What are the market trends shaping the Japan Cloud Computing Industry?
- The increasing deployment of sovereign cloud solutions is a notable trend, driven by data residency requirements and regulatory compliance needs across sensitive industries.
- The cloud computing market in Japan is increasingly shaped by the adoption of sovereign cloud solutions to meet stringent data residency and digital sovereignty requirements. This trend, coupled with hybrid cloud and multi-cloud strategies, offers organizations enhanced workload portability and helps mitigate vendor lock-in.
- Providers are offering flexible pay-as-you-go models and robust service level agreements (slas) to support these complex environments. Concurrently, the integration of quantum computing with cloud platforms is emerging, with new 256-qubit systems becoming accessible via the cloud.
- This convergence demands advanced low-latency networking and promotes sustainable computing practices through optimized resource use, ensuring data remains secure within national borders (data localization).
What challenges does the Japan Cloud Computing Industry face during its growth?
- Regulatory and compliance requirements present a significant challenge, complicating cloud deployments and affecting market growth.
- The market faces significant hurdles, including complex regulatory compliance and persistent data privacy concerns that necessitate robust compliance management. The rise in cybersecurity threats, with ransomware incidents increasing by 1.4 times, mandates advanced cloud security measures like comprehensive data encryption and a zero-trust architecture.
- While private cloud offers enhanced control, the overall ecosystem is strained by a severe talent shortage, with a reported deficit of 200,000 professionals, creating a critical skills gap in DevOps and security. This scarcity impacts the ability to manage high-performance computing (hpc) environments and protect against sophisticated ransomware protection failures.
Exclusive Technavio Analysis on Customer Landscape
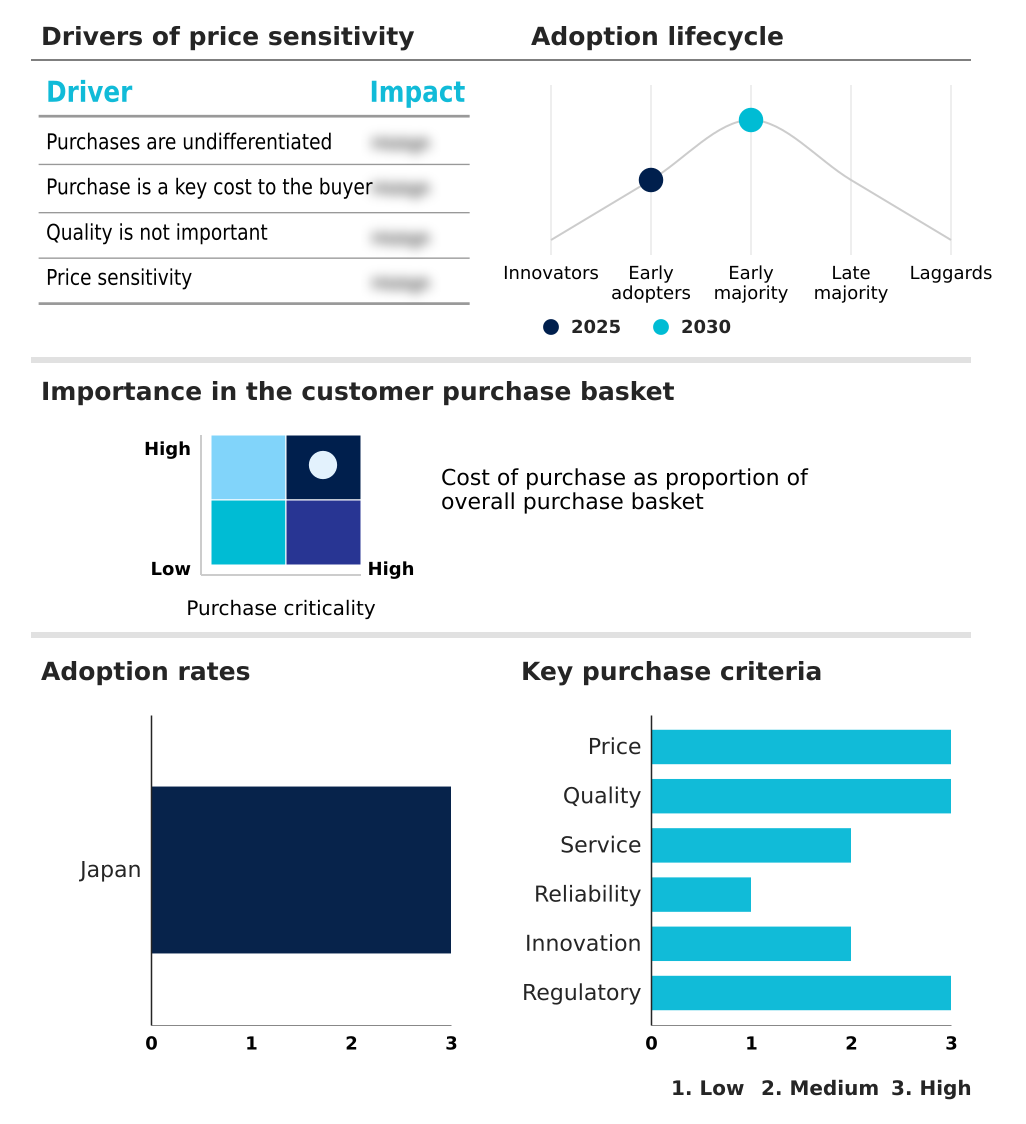
The japan cloud computing market forecasting report includes the adoption lifecycle of the market, covering from the innovator’s stage to the laggard’s stage. It focuses on adoption rates in different regions based on penetration. Furthermore, the japan cloud computing market report also includes key purchase criteria and drivers of price sensitivity to help companies evaluate and develop their market growth analysis strategies.
Customer Landscape of Japan Cloud Computing Industry
Competitive Landscape
Companies are implementing various strategies, such as strategic alliances, japan cloud computing market forecast, partnerships, mergers and acquisitions, geographical expansion, and product/service launches, to enhance their presence in the industry.
Akamai Technologies Inc. - Delivers a globally distributed cloud platform with core compute, storage, and application delivery capabilities, enabling developers to build and run low-latency edge native applications.
The industry research and growth report includes detailed analyses of the competitive landscape of the market and information about key companies, including:
- Akamai Technologies Inc.
- Amazon.com Inc.
- Coupa Software Inc.
- Dell Technologies Inc.
- DevSamurai Inc.
- DS Solution Inc.
- Fujitsu Ltd.
- Google LLC
- Huawei Technologies Co. Ltd.
- IBM Corp.
- Internet Initiative Japan Inc.
- Microsoft Corp.
- NEC Corp.
- Nutanix Inc.
- Oracle Corp.
- Rikkeisoft Corp.
- Salesforce Inc.
- The Constant Co. LLC
- VMware Inc.
Qualitative and quantitative analysis of companies has been conducted to help clients understand the wider business environment as well as the strengths and weaknesses of key industry players. Data is qualitatively analyzed to categorize companies as pure play, category-focused, industry-focused, and diversified; it is quantitatively analyzed to categorize companies as dominant, leading, strong, tentative, and weak.
Recent Development and News in Japan cloud computing market
- In August 2024, The AI Promotion Act became effective in Japan, easing certain data usage rules for training AI models and establishing a strategic body to oversee artificial intelligence advancements.
- In October 2024, Oracle partnered with NTT DATA Japan to deploy its Oracle Alloy platform in domestic facilities, enhancing the OpenCanvas platform with sovereign cloud capabilities for public and private sectors.
- In March 2025, Microsoft announced a USD 2.9 billion investment to expand its cloud and AI infrastructure in Japan, which includes adding high-performance computing capacity with advanced GPUs to its Azure platform.
- In April 2025, Fujitsu, in collaboration with RIKEN, introduced a new 256-qubit superconducting quantum computer integrated into a hybrid platform made available globally through cloud services.
Dive into Technavio’s robust research methodology, blending expert interviews, extensive data synthesis, and validated models for unparalleled Japan Cloud Computing Market insights. See full methodology.
| Market Scope | |
|---|---|
| Page number | 212 |
| Base year | 2025 |
| Historic period | 2020-2024 |
| Forecast period | 2026-2030 |
| Growth momentum & CAGR | Accelerate at a CAGR of 18.6% |
| Market growth 2026-2030 | USD 31275.1 million |
| Market structure | Fragmented |
| YoY growth 2025-2026(%) | 14.0% |
| Key countries | Japan |
| Competitive landscape | Leading Companies, Market Positioning of Companies, Competitive Strategies, and Industry Risks |
Research Analyst Overview
- The cloud computing market in Japan has matured beyond basic IaaS adoption into a sophisticated ecosystem driven by generative AI. This shift is forcing boardroom-level decisions around strategic investments in high-performance computing (hpc) and GPU acceleration within specialized AI data center facilities.
- Organizations are moving towards hybrid cloud and multi-cloud frameworks to avoid vendor lock-in, while prioritizing sovereign cloud for data sovereignty and data residency. Modernization efforts focus on replacing legacy systems via mainframe migration and building cloud native applications using containerization, microservices, and serverless computing. This is managed through DevOps practices and infrastructure as code (iac).
- The crucial boardroom consideration is balancing innovation with risk. Implementing a zero-trust architecture is now standard for robust cloud security and compliance management, which includes stringent data encryption. For business continuity, strategies for disaster recovery are essential. The adoption of PaaS and SaaS continues, supported by pay-as-you-go models.
- The entire infrastructure, from edge computing to quantum computing integrations and hybrid cooling systems, relies on low-latency networking, with some firms reporting a 30% improvement in data processing speeds after modernization.
What are the Key Data Covered in this Japan Cloud Computing Market Research and Growth Report?
-
What is the expected growth of the Japan Cloud Computing Market between 2026 and 2030?
-
USD 31.28 billion, at a CAGR of 18.6%
-
-
What segmentation does the market report cover?
-
The report is segmented by Service (SaaS, IaaS, and PaaS), Deployment (Public cloud, and Private cloud), End-user (IT and telecommunications, BFSI, Government, and Others), Sector (SMEs, and Large enterprises) and Geography (APAC)
-
-
Which regions are analyzed in the report?
-
APAC
-
-
What are the key growth drivers and market challenges?
-
Digital transformation initiatives across various industries, Regulatory and compliance challenges
-
-
Who are the major players in the Japan Cloud Computing Market?
-
Akamai Technologies Inc., Amazon.com Inc., Coupa Software Inc., Dell Technologies Inc., DevSamurai Inc., DS Solution Inc., Fujitsu Ltd., Google LLC, Huawei Technologies Co. Ltd., IBM Corp., Internet Initiative Japan Inc., Microsoft Corp., NEC Corp., Nutanix Inc., Oracle Corp., Rikkeisoft Corp., Salesforce Inc., The Constant Co. LLC and VMware Inc.
-
Market Research Insights
- The cloud computing market in Japan is defined by a strategic push for digital transformation and greater operational efficiency. Organizations are pursuing aggressive cloud adoption to achieve system scalability and better cost management, with successful migrations showing up to a 20% reduction in IT operational expenditures. This technology integration is crucial for modernizing legacy systems and optimizing business processes.
- However, navigating this landscape requires careful cloud governance to manage vendor lock-in and address data privacy concerns, as non-compliance can increase audit-related overhead by 30%. The focus on data localization and digital sovereignty is prompting investment in secure architectures, ensuring that as businesses scale, their data remains compliant and protected from evolving cybersecurity threats.
We can help! Our analysts can customize this japan cloud computing market research report to meet your requirements.
 RIA -
RIA - 
