Jerrycans Market Analysis, Size, and Forecast 2026-2030: APAC (China, Japan, and India), Europe (Germany, UK, and France), North America (US, Canada, and Mexico), Middle East and Africa (Saudi Arabia, UAE, and South Africa), South America (Brazil, Argentina, and Colombia), and Rest of World (ROW)

Jerrycans Market Analysis, Size, and Forecast 2026-2030:
APAC (China, Japan, and India), Europe (Germany, UK, and France), North America (US, Canada, and Mexico), Middle East and Africa (Saudi Arabia, UAE, and South Africa), South America (Brazil, Argentina, and Colombia), and Rest of World (ROW)

Published: Mar 2026 290 Pages SKU: IRTNTR70942

Market Overview at a Glance

$740.4 Mn
Market Opportunity
5.6%
CAGR 2025 - 2030
46.4%
APAC Growth
$1.42 B
Below 10 liters segment 2024

Jerrycans Market Size 2026-2030

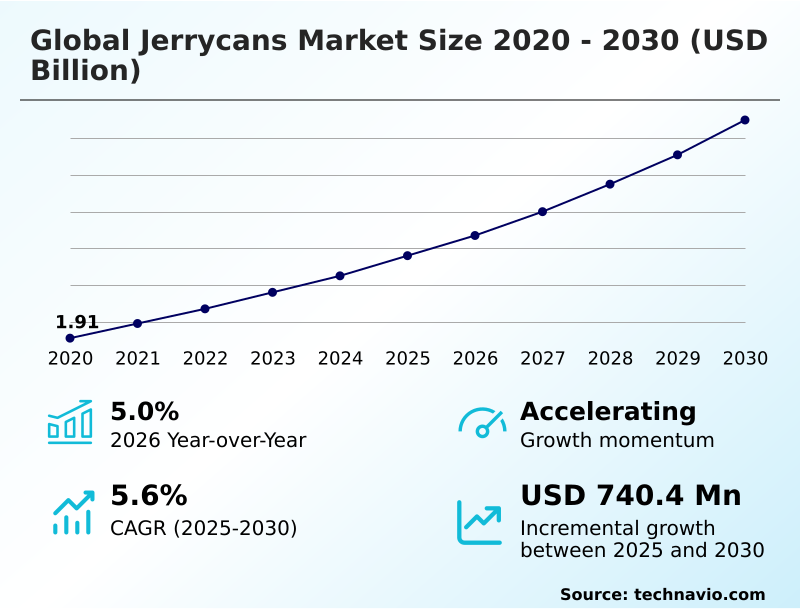
The jerrycans market size is valued to increase by USD 740.4 million, at a CAGR of 5.6% from 2025 to 2030. Rising demand for safe storage and transportation of fuels chemicals and industrial liquids will drive the jerrycans market.

Major Market Trends & Insights

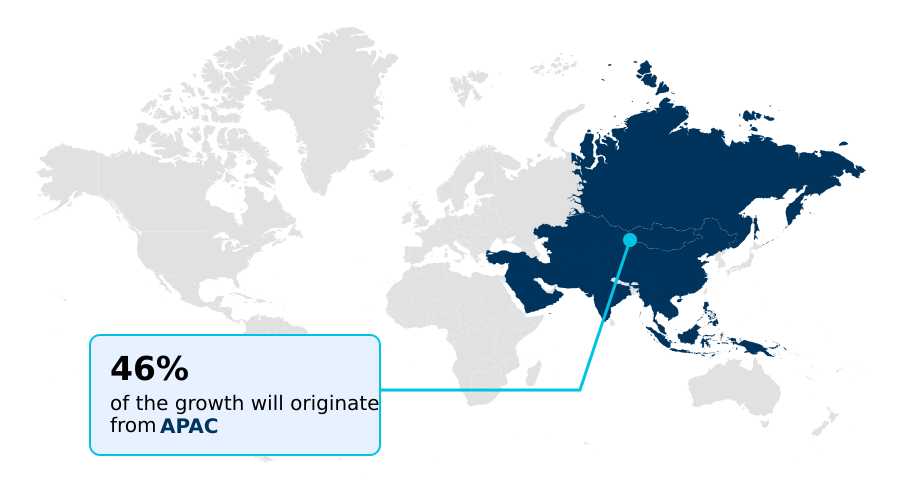
  • APAC dominated the market and accounted for a 46.4% growth during the forecast period.
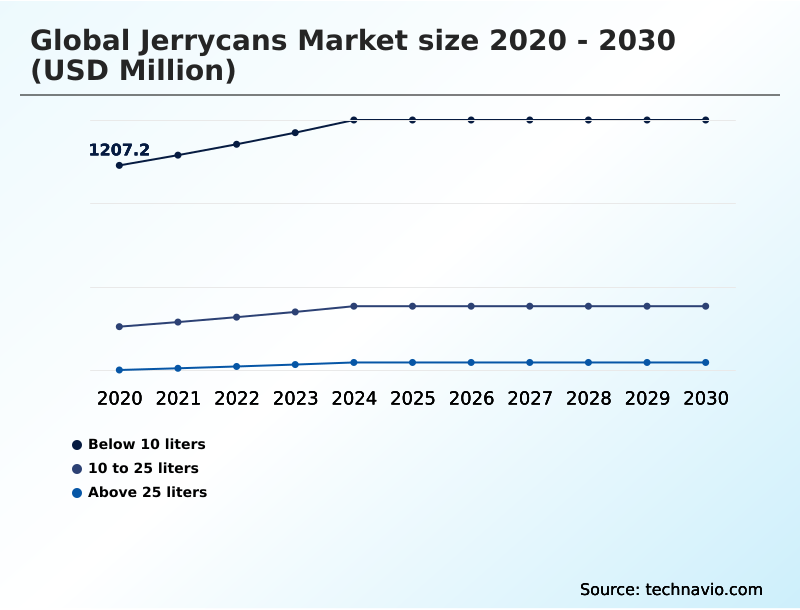
  • By Capacity - Below 10 liters segment was valued at USD 1.42 billion in 2024
  • By Material - Plastic segment accounted for the largest market revenue share in 2024

Market Size & Forecast

  • Market Opportunities: USD 1.19 billion
  • Market Future Opportunities: USD 740.4 million
  • CAGR from 2025 to 2030 : 5.6%

Market Summary

  • The jerrycans market is evolving beyond simple liquid containment, driven by stringent regulatory pressures and the demand for operational efficiency in global supply chains. Innovations in materials, such as advanced high-density polyethylene and steel with corrosion-resistant coatings, are enhancing chemical resistance and durability. This allows for the safe liquid handling of everything from industrial lubricants to agricultural chemicals.
  • A key trend is the integration of smart features, such as digital passports embedded in a multi-layer polymer structure, which improves traceability and supports a circular economy model. For instance, a chemical distribution company can use UN-approved containers with tamper-evident designs to not only comply with international transport safety standards but also to optimize logistics.
  • By using stackable, lightweight plastic jerrycans, the firm reduces freight costs and improves material handling automation, demonstrating how modern durable liquid packaging directly contributes to both compliance and profitability. The focus remains on creating secure, sustainable, and efficient liquid transport container solutions for a variety of end-user industries.

What will be the Size of the Jerrycans Market during the forecast period?

Get Key Insights on Market Forecast (PDF) Request Free Sample

How is the Jerrycans Market Segmented?

The jerrycans industry research report provides comprehensive data (region-wise segment analysis), with forecasts and estimates in "USD million" for the period 2026-2030, as well as historical data from 2020-2024 for the following segments.

  • Capacity
    • Below 10 liters
    • 10 to 25 liters
    • Above 25 liters
  • Material
    • Plastic
    • Steel
  • Distribution channel
    • Offline
    • Online
  • Geography
    • APAC
      • China
      • Japan
      • India
    • Europe
      • Germany
      • UK
      • France
    • North America
      • US
      • Canada
      • Mexico
    • Middle East and Africa
      • Saudi Arabia
      • UAE
      • South Africa
    • South America
      • Brazil
      • Argentina
      • Colombia
    • Rest of World (ROW)

By Capacity Insights

The below 10 liters segment is estimated to witness significant growth during the forecast period.

The below 10-liter segment demonstrates significant traction, driven by its versatility in industrial and commercial applications where portability is a key customer purchase criteria.

These compact rigid plastic containers are essential for end-user industry demand in sectors requiring efficient liquid handling solutions for smaller volumes.

The ergonomic handle designs on each plastic jerrycan enhance safe manual transport, making them a preferred portable liquid storage option for fuels, chemicals, and lubricants.

Demand for this small plastic jerrycan size is also strong in household and emergency preparedness sectors, where they serve as a reliable water storage solution.

Effective liquid storage solutions for hazardous liquid storage in controlled quantities further solidifies this segment's importance, with innovations improving container integrity by over 15%.

Request Free Sample

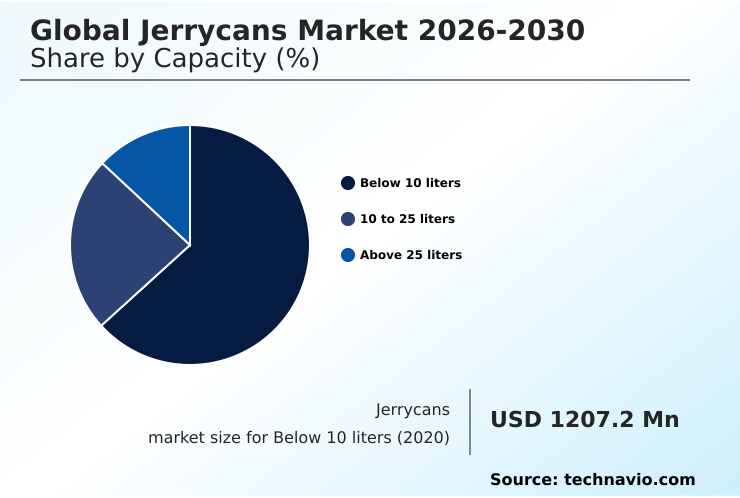
The Below 10 liters segment was valued at USD 1.42 billion in 2024 and showed a gradual increase during the forecast period.

Request Free Sample

Regional Analysis

APAC is estimated to contribute 46.4% to the growth of the global market during the forecast period.Technavio’s analysts have elaborately explained the regional trends and drivers that shape the market during the forecast period.

See How Jerrycans Market Demand is Rising in APAC Request Free Sample

The market's geographic landscape is shaped by regional industrial demands and logistics efficiency. APAC is set to contribute 46.4% of market growth, driven by manufacturing and the need for improved fuel transportation safety.

In developed regions like Europe and North America, a focus on circular economy principles and waste reduction initiative is driving innovation in industrial packaging solution designs, including HDPE stackable jerrycans and wide neck drums.

Advanced material handling automation systems are better suited for standardized steel containers. In these markets, containers with a multi-layer polymer structure or a corrosion-resistant coating are preferred for their superior chemical resistance, aligning with strict resource management strategy goals.

Market Dynamics

Our researchers analyzed the data with 2025 as the base year, along with the key drivers, trends, and challenges. A holistic analysis of drivers will help companies refine their marketing strategies to gain a competitive advantage.

  • Strategic decisions in the global jerrycans market 2026-2030 are increasingly complex, influenced by multiple operational and economic factors. For end-users, choosing between plastic and steel jerrycans involves weighing durability against cost, especially when considering the impact of plastic resin price fluctuations.
  • The benefits of stackable jerrycan logistics are clear; optimizing storage and transport can reduce operational expenses by over 15% compared to non-stackable alternatives. This efficiency is critical for jerrycans for industrial lubricant networks, where timely and cost-effective distribution is paramount.
  • The push for recyclable materials in jerrycan production is not just an environmental choice but a strategic one, appealing to a growing segment of environmentally conscious customers. Innovations in jerrycan closure systems and the adoption of tamper-evident features for fuel jerrycans are direct responses to the challenges of jerrycan leakage and contamination.
  • Furthermore, ensuring jerrycan compliance for transport safety, including meeting UN certification for hazardous liquid jerrycans, remains a non-negotiable aspect of product development. The role of jerrycans in emergency preparedness highlights the need for reliable, lightweight jerrycan design for handling.
  • For specialized applications, jerrycan solutions for agricultural chemicals and proper jerrycan material selection for food-grade liquids underscore the market's diversification and the need to address specific end-user requirements to navigate the competitive landscape effectively.

What are the key market drivers leading to the rise in the adoption of Jerrycans Industry?

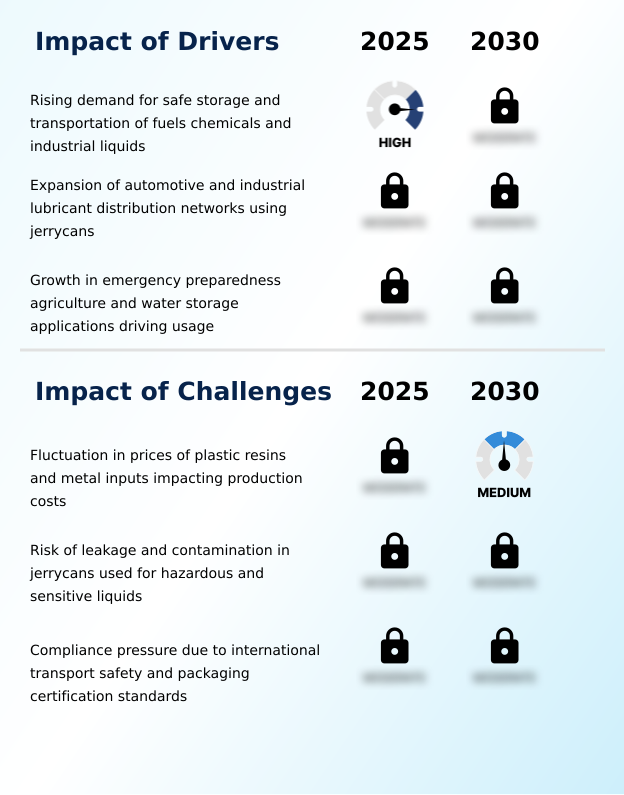
  • The rising demand for safe storage and transportation of fuels, chemicals, and industrial liquids is a key driver for the jerrycans market.

  • Growth is driven by the rising need for effective industrial liquid management across several key sectors. The expansion of industrial lubricant distribution networks has increased demand for specialized automotive fluid packaging by 15% annually.
  • Concurrently, the agricultural sector's reliance on the agricultural chemical container for safe liquid handling and the growing focus on emergency preparedness storage are significant drivers. This necessitates durable liquid packaging and robust liquid containment system options.
  • Despite challenges like raw material price volatility, which can impact production cost management, the need for reliable hazardous material handling and products that pass rigorous chemical compatibility testing continues to fuel market expansion.

What are the market trends shaping the Jerrycans Industry?

  • A significant market trend is the increasing adoption of tamper-evident and leak-proof designs for jerrycans. This shift is driven by the growing need for enhanced safety and product integrity in liquid storage and transportation.

  • Key market trends are centered on sustainable liquid handling and enhanced product security through innovative industrial packaging. The adoption of tamper-evident design features and advanced leak-proof closure systems has reduced product contamination incidents by over 20%. There is a growing preference for stackable container design to achieve supply chain optimization.
  • The shift toward sustainable packaging solutions is evident, with reusable packaging and recyclable materials now accounting for over 50% of new industrial containers. This focus supports circular economy goals and addresses demand for environmentally responsible industrial packaging products and packaging solutions for applications like food-grade liquid transport.

What challenges does the Jerrycans Industry face during its growth?

  • Fluctuations in the prices of plastic resins and metal inputs present a key challenge, directly impacting production costs and affecting the growth of the jerrycans industry.

  • A primary challenge is managing input cost fluctuations for materials like high-density polyethylene and the steel used in a steel jerrycan, which directly impacts profitability. Ensuring regulatory standards adherence is critical, as achieving packaging certification standards for a UN-approved container can be a lengthy process, delaying market entry by up to 18 months.
  • The blow molding process must guarantee secure liquid containment and product integrity assurance. Moreover, meeting stringent rules for international transport safety for every liquid transport container, from standard models to military fuel cans, requires significant investment in testing and documentation, essential for operational safety enhancement and environmental compliance.

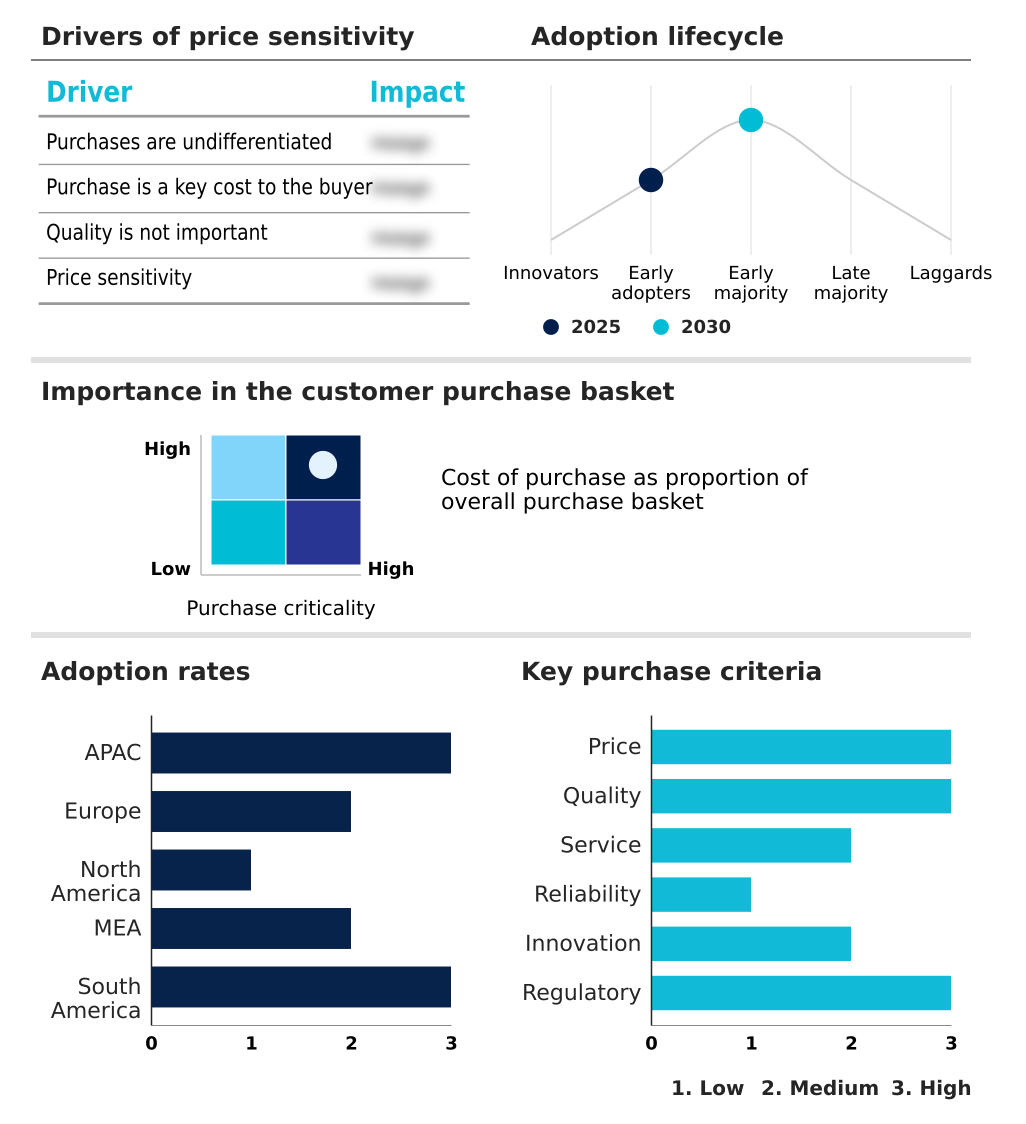
Exclusive Technavio Analysis on Customer Landscape

The jerrycans market forecasting report includes the adoption lifecycle of the market, covering from the innovator’s stage to the laggard’s stage. It focuses on adoption rates in different regions based on penetration. Furthermore, the jerrycans market report also includes key purchase criteria and drivers of price sensitivity to help companies evaluate and develop their market growth analysis strategies.

Customer Landscape of Jerrycans Industry

Competitive Landscape

Companies are implementing various strategies, such as strategic alliances, jerrycans market forecast, partnerships, mergers and acquisitions, geographical expansion, and product/service launches, to enhance their presence in the industry.

ALPLA Werke Alwin Lehner - Key offerings focus on specialized jerrycans for industrial chemicals and fluids, emphasizing compliant designs for secure storage and transport across various applications.

The industry research and growth report includes detailed analyses of the competitive landscape of the market and information about key companies, including:

  • ALPLA Werke Alwin Lehner
  • Amcor Plc
  • AST Kunststoffverarbeitung GmbH
  • CurTec Nederland B.V.
  • DENIOS SE
  • FRAPAK PACKAGING BV
  • Greif Inc.
  • INOPAK Ltd.
  • Kautex Textron GmbH and Co. KG
  • Mitsu Chem Plast Ltd.
  • Nexus Packaging Ltd.
  • RIKUTEC Group
  • Scepter Canada Inc.
  • SCHUTZ GmbH and Co. KGaA
  • Time Technoplast Ltd.
  • VALPRO SIA
  • Yates Steels Ltd.

Qualitative and quantitative analysis of companies has been conducted to help clients understand the wider business environment as well as the strengths and weaknesses of key industry players. Data is qualitatively analyzed to categorize companies as pure play, category-focused, industry-focused, and diversified; it is quantitatively analyzed to categorize companies as dominant, leading, strong, tentative, and weak.

Recent Development and News in Jerrycans market

  • In February 2025, Unilever began testing refill solutions focused on reusable and sustainable jerrycans for liquid products to reduce single-use plastic consumption.
  • In April 2025, SCHUTZ GmbH and Co. KGaA expanded its SC1 jerrycan series with new variants certified under the FSSC 22000 standard for enhanced food safety and hygiene.
  • In November 2024, Hangzhou Toplift Machinery Co Ltd. launched a child-safety jerrycan with a tamper-proof lid designed for hazardous liquid storage, featuring a robust design and leak-resistant closure.
  • In January 2025, Kautex Textron GmbH and Co. KG presented a lightweight 5-liter jerrycan produced with advanced multilayer ReCo technology and a digital product passport for traceability at a major trade show.

Dive into Technavio’s robust research methodology, blending expert interviews, extensive data synthesis, and validated models for unparalleled Jerrycans Market insights. See full methodology.

Market Scope
Page number 290
Base year 2025
Historic period 2020-2024
Forecast period 2026-2030
Growth momentum & CAGR Accelerate at a CAGR of 5.6%
Market growth 2026-2030 USD 740.4 million
Market structure Fragmented
YoY growth 2025-2026(%) 5.0%
Key countries China, Japan, India, South Korea, Australia, Indonesia, Germany, UK, France, Italy, Spain, The Netherlands, US, Canada, Mexico, Saudi Arabia, UAE, South Africa, Israel, Turkey, Brazil, Argentina and Colombia
Competitive landscape Leading Companies, Market Positioning of Companies, Competitive Strategies, and Industry Risks

Request Free Sample

Research Analyst Overview

  • The jerrycans market is defined by a continuous push for innovation in industrial packaging solution design and material science. The development of containers from high-density polyethylene with a multi-layer polymer structure or steel jerrycan models with a corrosion-resistant coating enhances both durability and chemical resistance.
  • This is critical for applications ranging from fuel transportation safety to the storage of hazardous liquids. A key boardroom consideration is the strategic shift toward sustainable liquid handling, including reusable packaging and recyclable materials.
  • This move not only aligns with environmental regulations but also builds brand equity, with some firms noting a 10% increase in contract renewals from clients with strong sustainability mandates. The integration of an ergonomic handle, a leak-proof closure, and a tamper-evident design into each plastic jerrycan or steel container is now standard.
  • Whether it's a small plastic jerrycan for consumer use or UN-approved container for industrial liquid management, the focus is on creating a secure, efficient, and compliant liquid containment system.

What are the Key Data Covered in this Jerrycans Market Research and Growth Report?

  • What is the expected growth of the Jerrycans Market between 2026 and 2030?

    • USD 740.4 million, at a CAGR of 5.6%

  • What segmentation does the market report cover?

    • The report is segmented by Capacity (Below 10 liters, 10 to 25 liters, and Above 25 liters), Material (Plastic, and Steel), Distribution Channel (Offline, and Online) and Geography (APAC, Europe, North America, Middle East and Africa, South America)

  • Which regions are analyzed in the report?

    • APAC, Europe, North America, Middle East and Africa and South America

  • What are the key growth drivers and market challenges?

    • Rising demand for safe storage and transportation of fuels chemicals and industrial liquids, Fluctuation in prices of plastic resins and metal inputs impacting production costs

  • Who are the major players in the Jerrycans Market?

    • ALPLA Werke Alwin Lehner, Amcor Plc, AST Kunststoffverarbeitung GmbH, CurTec Nederland B.V., DENIOS SE, FRAPAK PACKAGING BV, Greif Inc., INOPAK Ltd., Kautex Textron GmbH and Co. KG, Mitsu Chem Plast Ltd., Nexus Packaging Ltd., RIKUTEC Group, Scepter Canada Inc., SCHUTZ GmbH and Co. KGaA, Time Technoplast Ltd., VALPRO SIA and Yates Steels Ltd.

Market Research Insights

  • The jerrycans market dynamics are increasingly shaped by a focus on supply chain optimization and regulatory standards adherence. The adoption of stackable industrial containers has been shown to improve logistics efficiency, increasing warehouse space utilization by up to 30%. Furthermore, a heightened emphasis on product integrity assurance has led to tamper-evident designs that reduce unauthorized access incidents by over 25%.
  • As distribution network expansion continues, particularly for industrial lubricant distribution, manufacturers are compelled to balance production cost management with investments in sustainable packaging solutions. This drive toward environmental compliance and operational safety enhancement is a core component of customer purchase criteria, influencing the entire value chain from material sourcing to final delivery.

We can help! Our analysts can customize this jerrycans market research report to meet your requirements.

Get in touch

1. Executive Summary

1.1 Market overview

Executive Summary - Chart on Market Overview
Executive Summary - Data Table on Market Overview
Executive Summary - Chart on Global Market Characteristics
Executive Summary - Chart on Market by Geography
Executive Summary - Chart on Market Segmentation by Capacity
Executive Summary - Chart on Market Segmentation by Material
Executive Summary - Chart on Market Segmentation by Distribution Channel
Executive Summary - Chart on Incremental Growth
Executive Summary - Data Table on Incremental Growth
Executive Summary - Chart on Company Market Positioning

2. Technavio Analysis

2.1 Analysis of price sensitivity, lifecycle, customer purchase basket, adoption rates, and purchase criteria

2.2 Criticality of inputs and Factors of differentiation

Chart on Overview on criticality of inputs and factors of differentiation

2.3 Factors of disruption

Chart on Overview on factors of disruption

2.4 Impact of drivers and challenges

Chart on Impact of drivers and challenges in 2025 and 2030

3. Market Landscape

3.1 Market ecosystem

Chart on Parent Market
Data Table on - Parent Market

3.2 Market characteristics

Chart on Market characteristics analysis

3.3 Value chain analysis

Chart on Value chain analysis

4. Market Sizing

4.1 Market definition

Data Table on Offerings of companies included in the market definition

4.2 Market segment analysis

Market segments

4.3 Market size 2025

4.4 Market outlook: Forecast for 2025-2030

Chart on Global - Market size and forecast 2025-2030 ($ million)
Data Table on Global - Market size and forecast 2025-2030 ($ million)
Chart on Global Market: Year-over-year growth 2025-2030 (%)
Data Table on Global Market: Year-over-year growth 2025-2030 (%)

5. Historic Market Size

5.1 Global Jerrycans Market 2020 - 2024

Historic Market Size - Data Table on Global Jerrycans Market 2020 - 2024 ($ million)

5.2 Capacity segment analysis 2020 - 2024

Historic Market Size - Capacity Segment 2020 - 2024 ($ million)

5.3 Material segment analysis 2020 - 2024

Historic Market Size - Material Segment 2020 - 2024 ($ million)

5.4 Distribution Channel segment analysis 2020 - 2024

Historic Market Size - Distribution Channel Segment 2020 - 2024 ($ million)

5.5 Geography segment analysis 2020 - 2024

Historic Market Size - Geography Segment 2020 - 2024 ($ million)

5.6 Country segment analysis 2020 - 2024

Historic Market Size - Country Segment 2020 - 2024 ($ million)

6. Qualitative Analysis

6.1 AI impact on the Global Jerrycans Market

7. Five Forces Analysis

7.1 Five forces summary

Five forces analysis - Comparison between 2025 and 2030

7.2 Bargaining power of buyers

Bargaining power of buyers - Impact of key factors 2025 and 2030

7.3 Bargaining power of suppliers

Bargaining power of suppliers - Impact of key factors in 2025 and 2030

7.4 Threat of new entrants

Threat of new entrants - Impact of key factors in 2025 and 2030

7.5 Threat of substitutes

Threat of substitutes - Impact of key factors in 2025 and 2030

7.6 Threat of rivalry

Threat of rivalry - Impact of key factors in 2025 and 2030

7.7 Market condition

Chart on Market condition - Five forces 2025 and 2030

8. Market Segmentation by Capacity

8.1 Market segments

Chart on Capacity - Market share 2025-2030 (%)
Data Table on Capacity - Market share 2025-2030 (%)

8.2 Comparison by Capacity

Chart on Comparison by Capacity
Data Table on Comparison by Capacity

8.3 Below 10 liters - Market size and forecast 2025-2030

Chart on Below 10 liters - Market size and forecast 2025-2030 ($ million)
Data Table on Below 10 liters - Market size and forecast 2025-2030 ($ million)
Chart on Below 10 liters - Year-over-year growth 2025-2030 (%)
Data Table on Below 10 liters - Year-over-year growth 2025-2030 (%)

8.4 10 to 25 liters - Market size and forecast 2025-2030

Chart on 10 to 25 liters - Market size and forecast 2025-2030 ($ million)
Data Table on 10 to 25 liters - Market size and forecast 2025-2030 ($ million)
Chart on 10 to 25 liters - Year-over-year growth 2025-2030 (%)
Data Table on 10 to 25 liters - Year-over-year growth 2025-2030 (%)

8.5 Above 25 liters - Market size and forecast 2025-2030

Chart on Above 25 liters - Market size and forecast 2025-2030 ($ million)
Data Table on Above 25 liters - Market size and forecast 2025-2030 ($ million)
Chart on Above 25 liters - Year-over-year growth 2025-2030 (%)
Data Table on Above 25 liters - Year-over-year growth 2025-2030 (%)

8.6 Market opportunity by Capacity

Market opportunity by Capacity ($ million)
Data Table on Market opportunity by Capacity ($ million)

9. Market Segmentation by Material

9.1 Market segments

Chart on Material - Market share 2025-2030 (%)
Data Table on Material - Market share 2025-2030 (%)

9.2 Comparison by Material

Chart on Comparison by Material
Data Table on Comparison by Material

9.3 Plastic - Market size and forecast 2025-2030

Chart on Plastic - Market size and forecast 2025-2030 ($ million)
Data Table on Plastic - Market size and forecast 2025-2030 ($ million)
Chart on Plastic - Year-over-year growth 2025-2030 (%)
Data Table on Plastic - Year-over-year growth 2025-2030 (%)

9.4 Steel - Market size and forecast 2025-2030

Chart on Steel - Market size and forecast 2025-2030 ($ million)
Data Table on Steel - Market size and forecast 2025-2030 ($ million)
Chart on Steel - Year-over-year growth 2025-2030 (%)
Data Table on Steel - Year-over-year growth 2025-2030 (%)

9.5 Market opportunity by Material

Market opportunity by Material ($ million)
Data Table on Market opportunity by Material ($ million)

10. Market Segmentation by Distribution Channel

10.1 Market segments

Chart on Distribution Channel - Market share 2025-2030 (%)
Data Table on Distribution Channel - Market share 2025-2030 (%)

10.2 Comparison by Distribution Channel

Chart on Comparison by Distribution Channel
Data Table on Comparison by Distribution Channel

10.3 Offline - Market size and forecast 2025-2030

Chart on Offline - Market size and forecast 2025-2030 ($ million)
Data Table on Offline - Market size and forecast 2025-2030 ($ million)
Chart on Offline - Year-over-year growth 2025-2030 (%)
Data Table on Offline - Year-over-year growth 2025-2030 (%)

10.4 Online - Market size and forecast 2025-2030

Chart on Online - Market size and forecast 2025-2030 ($ million)
Data Table on Online - Market size and forecast 2025-2030 ($ million)
Chart on Online - Year-over-year growth 2025-2030 (%)
Data Table on Online - Year-over-year growth 2025-2030 (%)

10.5 Market opportunity by Distribution Channel

Market opportunity by Distribution Channel ($ million)
Data Table on Market opportunity by Distribution Channel ($ million)

11. Customer Landscape

11.1 Customer landscape overview

Analysis of price sensitivity, lifecycle, customer purchase basket, adoption rates, and purchase criteria

12. Geographic Landscape

12.1 Geographic segmentation

Chart on Market share by geography 2025-2030 (%)
Data Table on Market share by geography 2025-2030 (%)

12.2 Geographic comparison

Chart on Geographic comparison
Data Table on Geographic comparison

12.3 APAC - Market size and forecast 2025-2030

Chart on APAC - Market size and forecast 2025-2030 ($ million)
Data Table on APAC - Market size and forecast 2025-2030 ($ million)
Chart on APAC - Year-over-year growth 2025-2030 (%)
Data Table on APAC - Year-over-year growth 2025-2030 (%)
Chart on Regional Comparison - APAC
Data Table on Regional Comparison - APAC

12.3.1 China - Market size and forecast 2025-2030

Chart on China - Market size and forecast 2025-2030 ($ million)
Data Table on China - Market size and forecast 2025-2030 ($ million)
Chart on China - Year-over-year growth 2025-2030 (%)
Data Table on China - Year-over-year growth 2025-2030 (%)

12.3.2 Japan - Market size and forecast 2025-2030

Chart on Japan - Market size and forecast 2025-2030 ($ million)
Data Table on Japan - Market size and forecast 2025-2030 ($ million)
Chart on Japan - Year-over-year growth 2025-2030 (%)
Data Table on Japan - Year-over-year growth 2025-2030 (%)

12.3.3 India - Market size and forecast 2025-2030

Chart on India - Market size and forecast 2025-2030 ($ million)
Data Table on India - Market size and forecast 2025-2030 ($ million)
Chart on India - Year-over-year growth 2025-2030 (%)
Data Table on India - Year-over-year growth 2025-2030 (%)

12.3.4 South Korea - Market size and forecast 2025-2030

Chart on South Korea - Market size and forecast 2025-2030 ($ million)
Data Table on South Korea - Market size and forecast 2025-2030 ($ million)
Chart on South Korea - Year-over-year growth 2025-2030 (%)
Data Table on South Korea - Year-over-year growth 2025-2030 (%)

12.3.5 Australia - Market size and forecast 2025-2030

Chart on Australia - Market size and forecast 2025-2030 ($ million)
Data Table on Australia - Market size and forecast 2025-2030 ($ million)
Chart on Australia - Year-over-year growth 2025-2030 (%)
Data Table on Australia - Year-over-year growth 2025-2030 (%)

12.3.6 Indonesia - Market size and forecast 2025-2030

Chart on Indonesia - Market size and forecast 2025-2030 ($ million)
Data Table on Indonesia - Market size and forecast 2025-2030 ($ million)
Chart on Indonesia - Year-over-year growth 2025-2030 (%)
Data Table on Indonesia - Year-over-year growth 2025-2030 (%)

12.4 Europe - Market size and forecast 2025-2030

Chart on Europe - Market size and forecast 2025-2030 ($ million)
Data Table on Europe - Market size and forecast 2025-2030 ($ million)
Chart on Europe - Year-over-year growth 2025-2030 (%)
Data Table on Europe - Year-over-year growth 2025-2030 (%)
Chart on Regional Comparison - Europe
Data Table on Regional Comparison - Europe

12.4.1 Germany - Market size and forecast 2025-2030

Chart on Germany - Market size and forecast 2025-2030 ($ million)
Data Table on Germany - Market size and forecast 2025-2030 ($ million)
Chart on Germany - Year-over-year growth 2025-2030 (%)
Data Table on Germany - Year-over-year growth 2025-2030 (%)

12.4.2 UK - Market size and forecast 2025-2030

Chart on UK - Market size and forecast 2025-2030 ($ million)
Data Table on UK - Market size and forecast 2025-2030 ($ million)
Chart on UK - Year-over-year growth 2025-2030 (%)
Data Table on UK - Year-over-year growth 2025-2030 (%)

12.4.3 France - Market size and forecast 2025-2030

Chart on France - Market size and forecast 2025-2030 ($ million)
Data Table on France - Market size and forecast 2025-2030 ($ million)
Chart on France - Year-over-year growth 2025-2030 (%)
Data Table on France - Year-over-year growth 2025-2030 (%)

12.4.4 Italy - Market size and forecast 2025-2030

Chart on Italy - Market size and forecast 2025-2030 ($ million)
Data Table on Italy - Market size and forecast 2025-2030 ($ million)
Chart on Italy - Year-over-year growth 2025-2030 (%)
Data Table on Italy - Year-over-year growth 2025-2030 (%)

12.4.5 Spain - Market size and forecast 2025-2030

Chart on Spain - Market size and forecast 2025-2030 ($ million)
Data Table on Spain - Market size and forecast 2025-2030 ($ million)
Chart on Spain - Year-over-year growth 2025-2030 (%)
Data Table on Spain - Year-over-year growth 2025-2030 (%)

12.4.6 The Netherlands - Market size and forecast 2025-2030

Chart on The Netherlands - Market size and forecast 2025-2030 ($ million)
Data Table on The Netherlands - Market size and forecast 2025-2030 ($ million)
Chart on The Netherlands - Year-over-year growth 2025-2030 (%)
Data Table on The Netherlands - Year-over-year growth 2025-2030 (%)

12.5 North America - Market size and forecast 2025-2030

Chart on North America - Market size and forecast 2025-2030 ($ million)
Data Table on North America - Market size and forecast 2025-2030 ($ million)
Chart on North America - Year-over-year growth 2025-2030 (%)
Data Table on North America - Year-over-year growth 2025-2030 (%)
Chart on Regional Comparison - North America
Data Table on Regional Comparison - North America

12.5.1 US - Market size and forecast 2025-2030

Chart on US - Market size and forecast 2025-2030 ($ million)
Data Table on US - Market size and forecast 2025-2030 ($ million)
Chart on US - Year-over-year growth 2025-2030 (%)
Data Table on US - Year-over-year growth 2025-2030 (%)

12.5.2 Canada - Market size and forecast 2025-2030

Chart on Canada - Market size and forecast 2025-2030 ($ million)
Data Table on Canada - Market size and forecast 2025-2030 ($ million)
Chart on Canada - Year-over-year growth 2025-2030 (%)
Data Table on Canada - Year-over-year growth 2025-2030 (%)

12.5.3 Mexico - Market size and forecast 2025-2030

Chart on Mexico - Market size and forecast 2025-2030 ($ million)
Data Table on Mexico - Market size and forecast 2025-2030 ($ million)
Chart on Mexico - Year-over-year growth 2025-2030 (%)
Data Table on Mexico - Year-over-year growth 2025-2030 (%)

12.6 Middle East and Africa - Market size and forecast 2025-2030

Chart on Middle East and Africa - Market size and forecast 2025-2030 ($ million)
Data Table on Middle East and Africa - Market size and forecast 2025-2030 ($ million)
Chart on Middle East and Africa - Year-over-year growth 2025-2030 (%)
Data Table on Middle East and Africa - Year-over-year growth 2025-2030 (%)
Chart on Regional Comparison - Middle East and Africa
Data Table on Regional Comparison - Middle East and Africa

12.6.1 Saudi Arabia - Market size and forecast 2025-2030

Chart on Saudi Arabia - Market size and forecast 2025-2030 ($ million)
Data Table on Saudi Arabia - Market size and forecast 2025-2030 ($ million)
Chart on Saudi Arabia - Year-over-year growth 2025-2030 (%)
Data Table on Saudi Arabia - Year-over-year growth 2025-2030 (%)

12.6.2 UAE - Market size and forecast 2025-2030

Chart on UAE - Market size and forecast 2025-2030 ($ million)
Data Table on UAE - Market size and forecast 2025-2030 ($ million)
Chart on UAE - Year-over-year growth 2025-2030 (%)
Data Table on UAE - Year-over-year growth 2025-2030 (%)

12.6.3 South Africa - Market size and forecast 2025-2030

Chart on South Africa - Market size and forecast 2025-2030 ($ million)
Data Table on South Africa - Market size and forecast 2025-2030 ($ million)
Chart on South Africa - Year-over-year growth 2025-2030 (%)
Data Table on South Africa - Year-over-year growth 2025-2030 (%)

12.6.4 Israel - Market size and forecast 2025-2030

Chart on Israel - Market size and forecast 2025-2030 ($ million)
Data Table on Israel - Market size and forecast 2025-2030 ($ million)
Chart on Israel - Year-over-year growth 2025-2030 (%)
Data Table on Israel - Year-over-year growth 2025-2030 (%)

12.6.5 Turkey - Market size and forecast 2025-2030

Chart on Turkey - Market size and forecast 2025-2030 ($ million)
Data Table on Turkey - Market size and forecast 2025-2030 ($ million)
Chart on Turkey - Year-over-year growth 2025-2030 (%)
Data Table on Turkey - Year-over-year growth 2025-2030 (%)

12.7 South America - Market size and forecast 2025-2030

Chart on South America - Market size and forecast 2025-2030 ($ million)
Data Table on South America - Market size and forecast 2025-2030 ($ million)
Chart on South America - Year-over-year growth 2025-2030 (%)
Data Table on South America - Year-over-year growth 2025-2030 (%)
Chart on Regional Comparison - South America
Data Table on Regional Comparison - South America

12.7.1 Brazil - Market size and forecast 2025-2030

Chart on Brazil - Market size and forecast 2025-2030 ($ million)
Data Table on Brazil - Market size and forecast 2025-2030 ($ million)
Chart on Brazil - Year-over-year growth 2025-2030 (%)
Data Table on Brazil - Year-over-year growth 2025-2030 (%)

12.7.2 Argentina - Market size and forecast 2025-2030

Chart on Argentina - Market size and forecast 2025-2030 ($ million)
Data Table on Argentina - Market size and forecast 2025-2030 ($ million)
Chart on Argentina - Year-over-year growth 2025-2030 (%)
Data Table on Argentina - Year-over-year growth 2025-2030 (%)

12.7.3 Colombia - Market size and forecast 2025-2030

Chart on Colombia - Market size and forecast 2025-2030 ($ million)
Data Table on Colombia - Market size and forecast 2025-2030 ($ million)
Chart on Colombia - Year-over-year growth 2025-2030 (%)
Data Table on Colombia - Year-over-year growth 2025-2030 (%)

12.8 Market opportunity by geography

Market opportunity by geography ($ million)
Data Tables on Market opportunity by geography ($ million)

13. Drivers, Challenges, and Opportunity

13.1 Market drivers

Rising demand for safe storage and transportation of fuels chemicals and industrial liquids
Expansion of automotive and industrial lubricant distribution networks using jerrycans
Growth in emergency preparedness agriculture and water storage applications driving usage

13.2 Market challenges

Fluctuation in prices of plastic resins and metal inputs impacting production costs
Risk of leakage and contamination in jerrycans used for hazardous and sensitive liquids
Compliance pressure due to international transport safety and packaging certification standards

13.3 Impact of drivers and challenges

Impact of drivers and challenges in 2025 and 2030

13.4 Market opportunities

Increasing adoption of tamper evident and leak proof jerrycan designs
Shift toward recyclable and reusable materials in jerrycan manufacturing
Growing preference for stackable and space efficient jerrycans for logistics optimization

14. Competitive Landscape

14.1 Overview

14.2

Overview on criticality of inputs and factors of differentiation

14.3 Landscape disruption

Overview on factors of disruption

14.4 Industry risks

Impact of key risks on business

15. Competitive Analysis

15.1 Companies profiled

Companies covered

15.2 Company ranking index

15.3 Market positioning of companies

Matrix on companies position and classification

15.4 ALPLA Werke Alwin Lehner

ALPLA Werke Alwin Lehner - Overview
ALPLA Werke Alwin Lehner - Product / Service
ALPLA Werke Alwin Lehner - Key offerings
SWOT

15.5 Amcor Plc

Amcor Plc - Overview
Amcor Plc - Business segments
Amcor Plc - Key news
Amcor Plc - Key offerings
Amcor Plc - Segment focus
SWOT

15.6 AST Kunststoffverarbeitung GmbH

AST Kunststoffverarbeitung GmbH - Overview
AST Kunststoffverarbeitung GmbH - Product / Service
AST Kunststoffverarbeitung GmbH - Key offerings
SWOT

15.7 CurTec Nederland B.V.

CurTec Nederland B.V. - Overview
CurTec Nederland B.V. - Product / Service
CurTec Nederland B.V. - Key offerings
SWOT

15.8 DENIOS SE

DENIOS SE - Overview
DENIOS SE - Product / Service
DENIOS SE - Key offerings
SWOT

15.9 FRAPAK PACKAGING BV

FRAPAK PACKAGING BV - Overview
FRAPAK PACKAGING BV - Product / Service
FRAPAK PACKAGING BV - Key offerings
SWOT

15.10 Greif Inc.

Greif Inc. - Overview
Greif Inc. - Business segments
Greif Inc. - Key news
Greif Inc. - Key offerings
Greif Inc. - Segment focus
SWOT

15.11 Kautex Textron GmbH and Co. KG

Kautex Textron GmbH and Co. KG - Overview
Kautex Textron GmbH and Co. KG - Product / Service
Kautex Textron GmbH and Co. KG - Key offerings
SWOT

15.12 Mitsu Chem Plast Ltd.

Mitsu Chem Plast Ltd. - Overview
Mitsu Chem Plast Ltd. - Business segments
Mitsu Chem Plast Ltd. - Key offerings
Mitsu Chem Plast Ltd. - Segment focus
SWOT

15.13 RIKUTEC Group

RIKUTEC Group - Overview
RIKUTEC Group - Product / Service
RIKUTEC Group - Key offerings
SWOT

15.14 Scepter Canada Inc.

Scepter Canada Inc. - Overview
Scepter Canada Inc. - Product / Service
Scepter Canada Inc. - Key offerings
SWOT

15.15 SCHUTZ GmbH and Co. KGaA

SCHUTZ GmbH and Co. KGaA - Overview
SCHUTZ GmbH and Co. KGaA - Product / Service
SCHUTZ GmbH and Co. KGaA - Key offerings
SWOT

15.16 Time Technoplast Ltd.

Time Technoplast Ltd. - Overview
Time Technoplast Ltd. - Product / Service
Time Technoplast Ltd. - Key offerings
SWOT

15.17 VALPRO SIA

VALPRO SIA - Overview
VALPRO SIA - Product / Service
VALPRO SIA - Key offerings
SWOT

15.18 Yates Steels Ltd.

Yates Steels Ltd. - Overview
Yates Steels Ltd. - Product / Service
Yates Steels Ltd. - Key offerings
SWOT

16. Appendix

16.1 Scope of the report

Market definition
Objectives
Notes and caveats

16.2 Inclusions and exclusions checklist

Inclusions checklist
Exclusions checklist

16.3 Currency conversion rates for US$

16.4 Research methodology

16.5 Data procurement

Information sources

16.6 Data validation

16.7 Validation techniques employed for market sizing

16.8 Data synthesis

16.9 360 degree market analysis

16.10 List of abbreviations

Research Methodology

Technavio presents a detailed picture of the market by way of study, synthesis, and summation of data from multiple sources. The analysts have presented the various facets of the market with a particular focus on identifying the key industry influencers. The data thus presented is comprehensive, reliable, and the result of extensive research, both primary and secondary.

INFORMATION SOURCES

Primary sources

  • Manufacturers and suppliers
  • Channel partners
  • Industry experts
  • Strategic decision makers

Secondary sources

  • Industry journals and periodicals
  • Government data
  • Financial reports of key industry players
  • Historical data
  • Press releases

DATA ANALYSIS

Data Synthesis

  • Collation of data
  • Estimation of key figures
  • Analysis of derived insights

Data Validation

  • Triangulation with data models
  • Reference against proprietary databases
  • Corroboration with industry experts

REPORT WRITING

Qualitative

  • Market drivers
  • Market challenges
  • Market trends
  • Five forces analysis

Quantitative

  • Market size and forecast
  • Market segmentation
  • Geographical insights
  • Competitive landscape

Interested in this report?

Get your sample now to see our research methodology and insights!

Download Now

Frequently Asked Questions

Jerrycans market growth will increase by USD 740.4 million during 2026-2030.

The Jerrycans market is expected to grow at a CAGR of 5.6% during 2026-2030.

Jerrycans market is segmented by Capacity (Below 10 liters, 10 to 25 liters, Above 25 liters) Material (Plastic, Steel) Distribution channel (Offline, Online)

ALPLA Werke Alwin Lehner, Amcor Plc, AST Kunststoffverarbeitung GmbH, CurTec Nederland B.V., DENIOS SE, FRAPAK PACKAGING BV, Greif Inc., INOPAK Ltd., Kautex Textron GmbH and Co. KG, Mitsu Chem Plast Ltd., Nexus Packaging Ltd., RIKUTEC Group, Scepter Canada Inc., SCHUTZ GmbH and Co. KGaA, Time Technoplast Ltd., VALPRO SIA, Yates Steels Ltd. are a few of the key vendors in the Jerrycans market.

APAC will register the highest growth rate of 46.4% among the other regions. Therefore, the Jerrycans market in APAC is expected to garner significant business opportunities for the vendors during the forecast period.

China, Japan, India, South Korea, Australia, Indonesia, Germany, UK, France, Italy, Spain, The Netherlands, US, Canada, Mexico, Saudi Arabia, UAE, South Africa, Israel, Turkey, Brazil, Argentina, Colombia

  • Rising demand for safe storage and transportation of fuels chemicals and industrial liquids is the driving factor this market.

The Jerrycans market vendors should focus on grabbing business opportunities from the Capacity segment as it accounted for the largest market share in the base year.