K-12 Blended E-learning Market Analysis, Size, and Forecast 2026-2030: North America (US, Canada, and Mexico), APAC (China, India, and Japan), Europe (Germany, UK, and France), South America (Brazil and Argentina), Middle East and Africa (Saudi Arabia, UAE, and South Africa), and Rest of World (ROW)

K-12 Blended E-learning Market Analysis, Size, and Forecast 2026-2030:
North America (US, Canada, and Mexico), APAC (China, India, and Japan), Europe (Germany, UK, and France), South America (Brazil and Argentina), Middle East and Africa (Saudi Arabia, UAE, and South Africa), and Rest of World (ROW)

Published: Mar 2026 295 Pages SKU: IRTNTR43632

Market Overview at a Glance

$29.10 B
Market Opportunity
15.2%
CAGR 2025 - 2030
33.6%
APAC Growth
$11.49 B
Hardware segment 2024

K-12 Blended E-learning Market Size 2026-2030

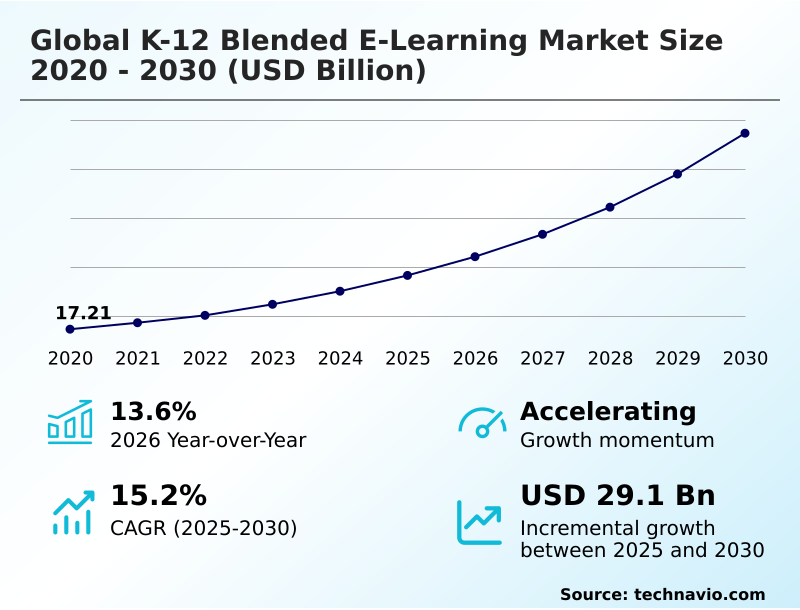
The k-12 blended e-learning market size is valued to increase by USD 29.10 billion, at a CAGR of 15.2% from 2025 to 2030. Adoption of AI for adaptive learning pathway will drive the k-12 blended e-learning market.

Major Market Trends & Insights

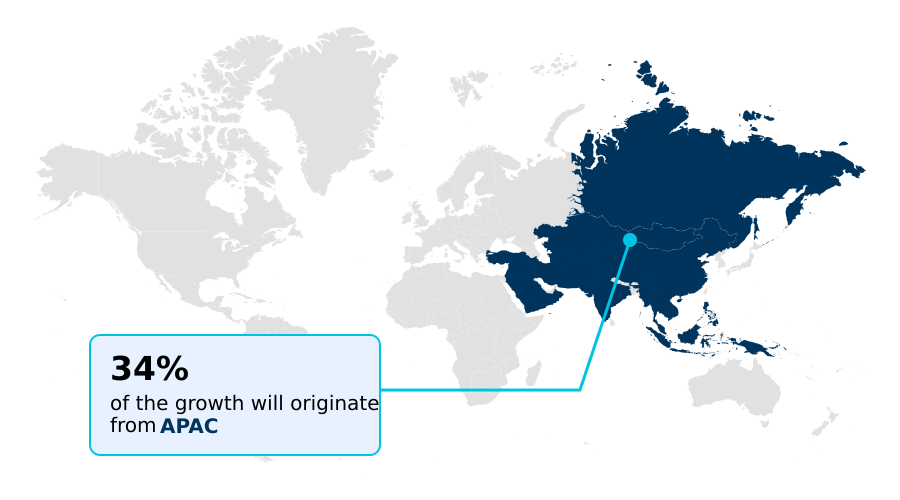
  • APAC dominated the market and accounted for a 33.6% growth during the forecast period.
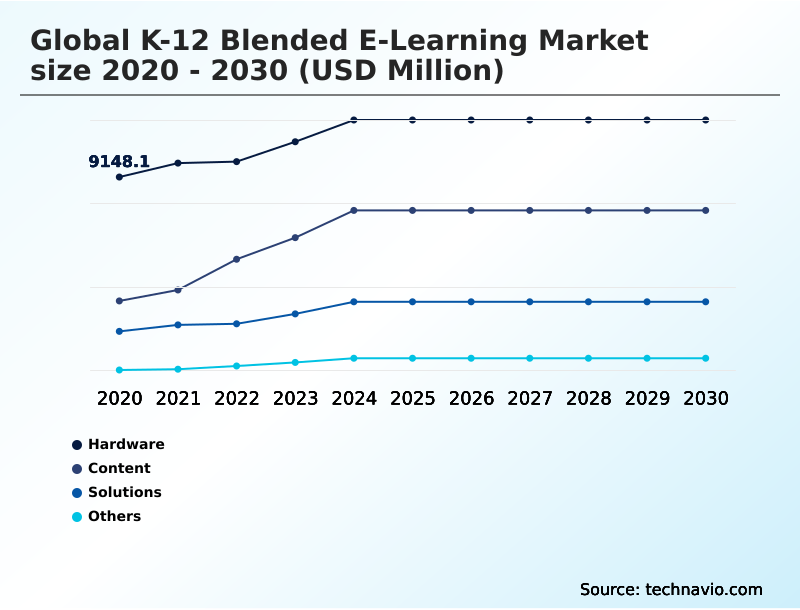
  • By Product - Hardware segment was valued at USD 11.49 billion in 2024
  • By Application - Pre-primary school segment accounted for the largest market revenue share in 2024

Market Size & Forecast

  • Market Opportunities: USD 40.09 billion
  • Market Future Opportunities: USD 29.10 billion
  • CAGR from 2025 to 2030 : 15.2%

Market Summary

  • The K-12 blended e-learning market is defined by its integration of digital platforms with traditional instruction, creating a more personalized and flexible educational environment. This evolution is driven by the need for data-driven instruction and curriculum alignment, which are facilitated by advanced machine learning algorithms.
  • A key trend is the use of a mobile-first learning strategy and interactive educational tools to increase student engagement. As a result, educational institutions are shifting from static content to dynamic systems that offer a real-time feedback mechanism and support a hybrid classroom model.
  • For instance, a school district can utilize a learning management system (LMS) to analyze student performance data, identify learning gaps in real-time, and reallocate tutoring resources to specific student groups. This approach improves outcomes and optimizes budgets without requiring additional staff, demonstrating the practical application of evidence-based digital pedagogy.
  • However, this transition requires robust educator professional development and a focus on digital citizenship education to ensure effective and secure implementation.

What will be the Size of the K-12 Blended E-learning Market during the forecast period?

Get Key Insights on Market Forecast (PDF) Request Free Sample

How is the K-12 Blended E-learning Market Segmented?

The k-12 blended e-learning industry research report provides comprehensive data (region-wise segment analysis), with forecasts and estimates in "USD million" for the period 2026-2030, as well as historical data from 2020-2024 for the following segments.

  • Product
    • Hardware
    • Content
    • Solutions
    • Others
  • Application
    • Pre-primary school
    • Primary school
    • Middle school
    • High school
  • Deployment
    • Cloud-based
    • On-premises
  • Geography
    • North America
      • US
      • Canada
      • Mexico
    • APAC
      • China
      • India
      • Japan
    • Europe
      • Germany
      • UK
      • France
    • South America
      • Brazil
      • Argentina
    • Middle East and Africa
      • Saudi Arabia
      • UAE
      • South Africa
    • Rest of World (ROW)

By Product Insights

The hardware segment is estimated to witness significant growth during the forecast period.

The hardware segment is foundational to the K-12 blended e-learning market, enabling the shift to digital instruction. This includes devices that support a bring-your-own-device (BYOD) framework and run sophisticated K-12 e-learning software and interactive educational tools.

The focus is on facilitating a hybrid learning model where students engage with an adaptive curriculum program through a cloud-based learning platform.

Modern devices are essential for delivering content via a personalized learning dashboard and supporting AI-powered formative assessment with a real-time feedback mechanism.

An effective educational technology platform depends on hardware that can support a mobile-first learning strategy and virtual classroom solution.

The contribution of these solutions to buyer budgets is high, influencing procurement decisions that prioritize system compatibility and functionality over premium specifications.

Request Free Sample

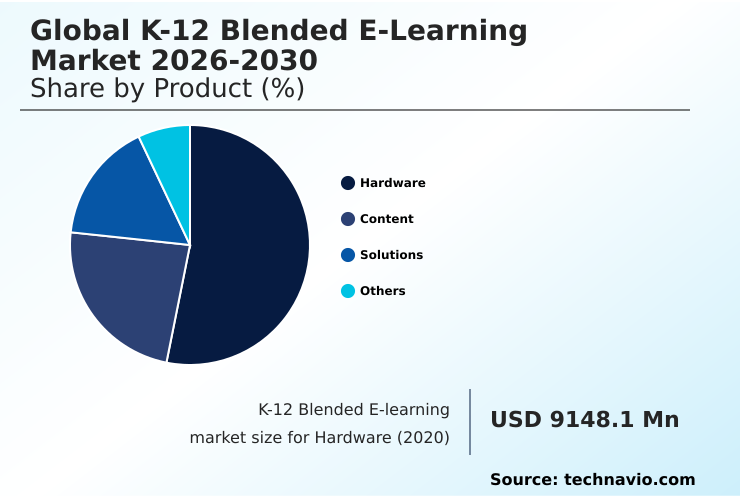
The Hardware segment was valued at USD 11.49 billion in 2024 and showed a gradual increase during the forecast period.

Request Free Sample

Regional Analysis

APAC is estimated to contribute 33.6% to the growth of the global market during the forecast period.Technavio’s analysts have elaborately explained the regional trends and drivers that shape the market during the forecast period.

See How K-12 Blended E-learning Market Demand is Rising in APAC Request Free Sample

The geographic landscape of the K-12 blended e-learning market is marked by a contrast between mature and high-growth regions. North America leads in market size, leveraging established edtech infrastructure to deploy sophisticated adaptive learning platforms and promote evidence-based digital pedagogy.

This region emphasizes curriculum alignment and the use of formative assessment tools. In contrast, APAC is the fastest-growing region, projected to contribute 33.6% of the market's incremental growth, significantly outpacing Europe's 23.77%.

This expansion is driven by government initiatives focused on digital citizenship education and the widespread adoption of gamified educational content to create an immersive learning experience.

AI in education is being used to develop personalized learning paths and digital portfolio management tools, with a strong focus on curriculum content creation that reflects regional needs.

Market Dynamics

Our researchers analyzed the data with 2025 as the base year, along with the key drivers, trends, and challenges. A holistic analysis of drivers will help companies refine their marketing strategies to gain a competitive advantage.

  • The strategic implementation of K-12 blended e-learning is increasingly nuanced, focusing on specific applications and outcomes. The use of AI for creating adaptive learning paths is becoming standard, personalizing instruction based on real-time student data. Simultaneously, the impact of BYOD policies on K-12 e-learning is forcing institutions to refine their security protocols for K-12 cloud platforms.
  • In classrooms, educators are exploring gamification techniques for middle school math and integrating AR/VR in high school science labs to make learning more engaging. A key operational debate involves comparing cloud-based vs. on-premise LMS solutions, a decision influenced by strategies for bridging the digital divide in areas with poor connectivity.
  • Deploying mobile-first learning in rural schools addresses access, while ensuring data privacy in student information systems remains a top priority. Best practices for teacher professional development are critical to address the challenges of educator readiness for edtech and to effectively use AI-powered formative assessment tools.
  • The benefits of project-based digital learning are clear, but success depends on measuring student engagement in virtual classrooms and implementing a strong digital citizenship curriculum. The focus is shifting toward using AI for personalized student feedback and creating verifiable digital credentials for students to demonstrate competencies. This highlights the varying effectiveness of synchronous vs.
  • asynchronous learning models, with growth in the APAC region contributing over 33% to market expansion, compared to just under 24% from Europe, indicating differing regional priorities and adoption rates.

What are the key market drivers leading to the rise in the adoption of K-12 Blended E-learning Industry?

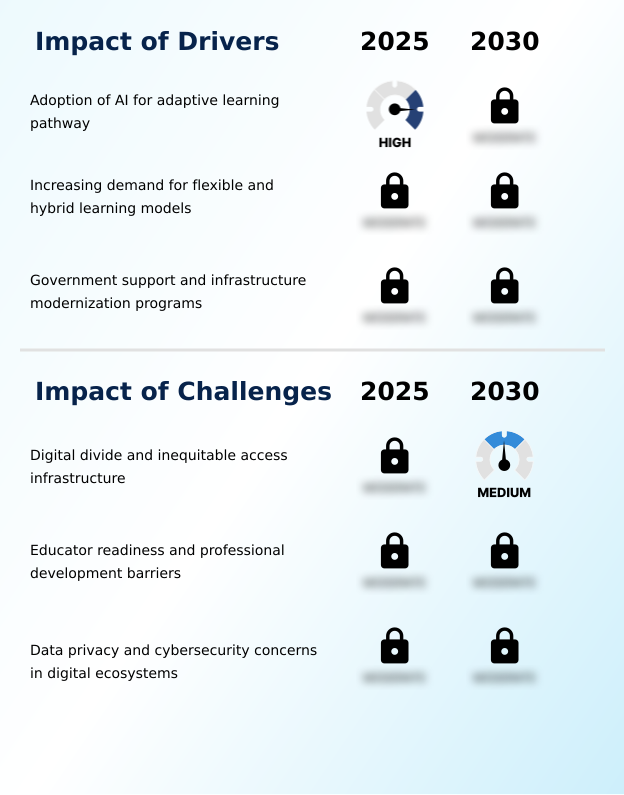
  • The adoption of artificial intelligence to enable adaptive learning pathways is a primary driver for the K-12 blended e-learning market.

  • Market growth is primarily driven by the demand for flexible, technology-enabled education. The adoption of the hybrid classroom model, which blends synchronous learning with asynchronous learning, is now standard.
  • This is supported by a unified cloud interface and collaborative software tools that facilitate a blended instructional approach and digital literacy development.
  • Governments are accelerating this shift with investments in edtech infrastructure, with initiatives in India alone upgrading over 10,000 schools for digital readiness.
  • Furthermore, with over 80% of educational organizations using AI, the demand for AI-driven tutoring systems and gamification in education is rising.
  • These tools are often delivered through a mobile learning application, integrating social-emotional learning tools to enhance the student experience and provide a verifiable digital credential for skills acquired.

What are the market trends shaping the K-12 Blended E-learning Industry?

  • The increasing adoption of mobile-first learning strategies and bring-your-own-device (BYOD) frameworks represents a significant trend shaping the K-12 blended e-learning landscape.

  • Key market trends are redefining instructional delivery through advanced technology. The integration of a virtual reality learning environment and augmented reality education is creating a more immersive learning experience, supported by a flexible learning structure. This is coupled with the expansion of digital credentialing services, which provide verifiable digital credentials for student achievements.
  • Success in this area relies on sophisticated student progress tracking and the use of a machine learning algorithm for data-driven instruction. However, these trends place greater demands on digital curriculum integration and the need for robust cybersecurity for schools to protect student data privacy.
  • As a result, comprehensive teacher training programs are essential for effective implementation, as nearly half of educators report having no formal training in advanced AI tools, while institutions face a 92% rise in ransomware attacks.

What challenges does the K-12 Blended E-learning Industry face during its growth?

  • The digital divide, characterized by inequitable access to infrastructure and resources, poses a significant challenge to industry growth.

  • Significant challenges constrain the market's potential, primarily centered on access, readiness, and security. The digital divide prevents equitable digital content delivery, limiting the effectiveness of self-paced learning modules and interactive simulations.
  • This is compounded by a lack of educator professional development, where nearly half of teachers lack formal training, hindering the use of student information system (SIS) data for blended learning analytics or to manage project-based digital learning. Consequently, institutions struggle to leverage a learning analytics dashboard for real-time student monitoring.
  • Security is a major concern, with ransomware attacks on K-12 institutions increasing by 92%. This threat complicates online program management and the use of cloud-based educational services, making the protection of a secure digital portfolio a critical but difficult operational requirement.

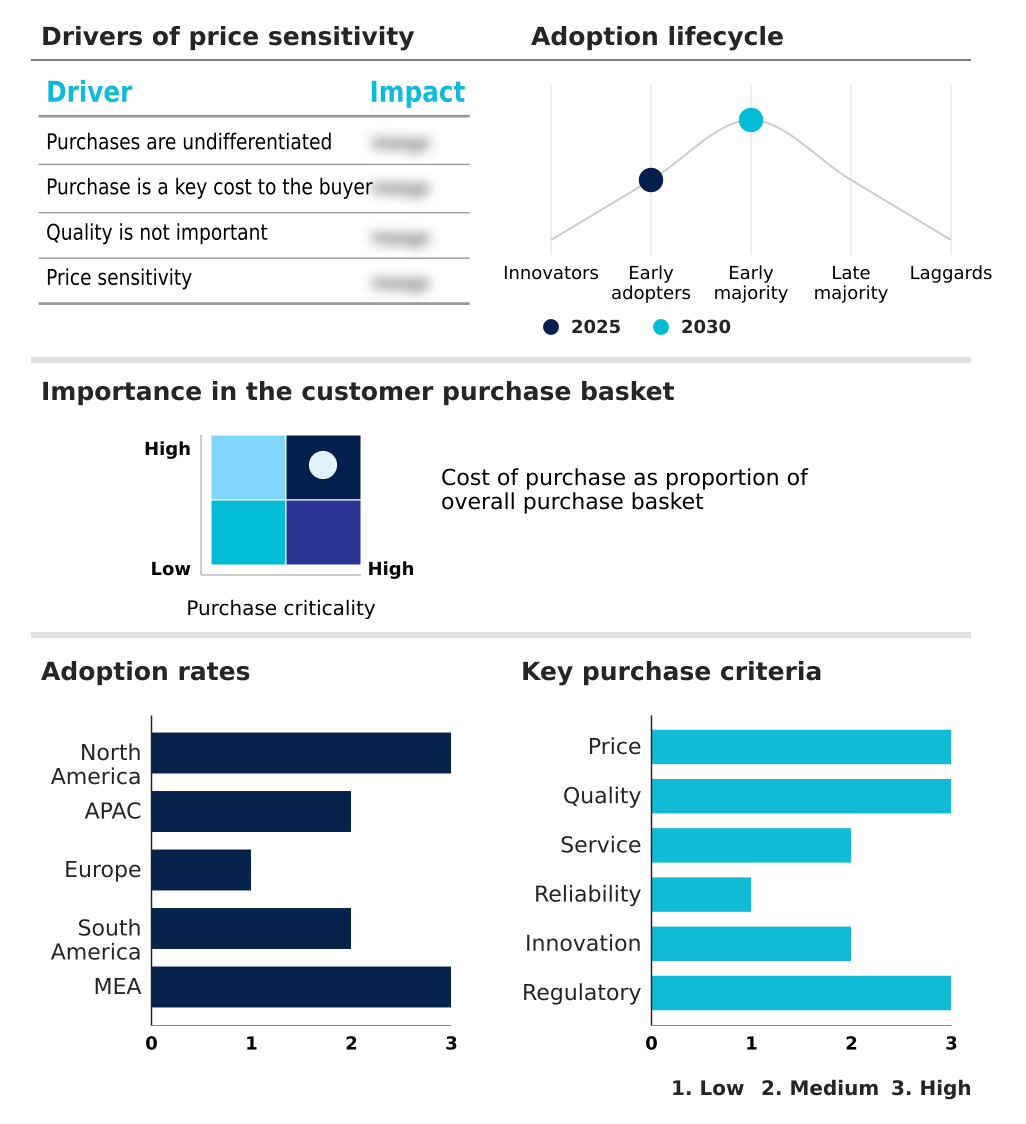
Exclusive Technavio Analysis on Customer Landscape

The k-12 blended e-learning market forecasting report includes the adoption lifecycle of the market, covering from the innovator’s stage to the laggard’s stage. It focuses on adoption rates in different regions based on penetration. Furthermore, the k-12 blended e-learning market report also includes key purchase criteria and drivers of price sensitivity to help companies evaluate and develop their market growth analysis strategies.

Customer Landscape of K-12 Blended E-learning Industry

Competitive Landscape

Companies are implementing various strategies, such as strategic alliances, k-12 blended e-learning market forecast, partnerships, mergers and acquisitions, geographical expansion, and product/service launches, to enhance their presence in the industry.

Amplify Education Inc. - Analysis indicates a focus on adaptive digital curricula and integrated assessment tools that personalize learning pathways across core K-12 subjects, enhancing instructional efficacy.

The industry research and growth report includes detailed analyses of the competitive landscape of the market and information about key companies, including:

  • Amplify Education Inc.
  • BrainPOP
  • Curriculum Associates LLC
  • D2L Corp.
  • DreamBox Learning Inc.
  • Edmentum Inc.
  • Google LLC
  • Imagine Learning LLC
  • Instructure Holdings Inc.
  • IXL Learning Inc.
  • Khan Academy Inc.
  • McGraw Hill LLC
  • Microsoft Corp.
  • Nearpod Inc.
  • Newsela
  • Pearson Plc
  • PowerSchool Holdings Inc.
  • Renaissance Learning Inc
  • Savvas Learning Co. LLC
  • Stride Inc.

Qualitative and quantitative analysis of companies has been conducted to help clients understand the wider business environment as well as the strengths and weaknesses of key industry players. Data is qualitatively analyzed to categorize companies as pure play, category-focused, industry-focused, and diversified; it is quantitatively analyzed to categorize companies as dominant, leading, strong, tentative, and weak.

Recent Development and News in K-12 blended e-learning market

  • In November, 2024, the Government of India reported that its PM SHRI program had successfully upgraded over ten thousand schools into model institutions equipped with smart infrastructure and digital classrooms to support the National Education Policy.
  • In January, 2025, the State Educational Technology Directors Association released a report identifying a persistent digital use divide in the United States, highlighting that qualitative engagement with technology varies significantly by socioeconomic background even when device access is available.
  • In February, 2025, the Government of Brazil reported a significant expansion of its digital education programs, which aim to provide tablets and high-speed internet to thousands of public schools, supporting blended learning models in remote areas.
  • In May, 2025, the Ministry of Education in the United Arab Emirates announced a new partnership to integrate advanced artificial intelligence coaching into the national curriculum, providing students with personalized digital tutors.

Dive into Technavio’s robust research methodology, blending expert interviews, extensive data synthesis, and validated models for unparalleled K-12 Blended E-learning Market insights. See full methodology.

Market Scope
Page number 295
Base year 2025
Historic period 2020-2024
Forecast period 2026-2030
Growth momentum & CAGR Accelerate at a CAGR of 15.2%
Market growth 2026-2030 USD 29095.7 million
Market structure Fragmented
YoY growth 2025-2026(%) 13.6%
Key countries US, Canada, Mexico, China, India, Japan, South Korea, Australia, Indonesia, Germany, UK, France, Italy, Spain, The Netherlands, Brazil, Argentina, Chile, Saudi Arabia, UAE, South Africa, Egypt and Nigeria
Competitive landscape Leading Companies, Market Positioning of Companies, Competitive Strategies, and Industry Risks

Request Free Sample

Research Analyst Overview

  • The K-12 blended e-learning market is evolving through the integration of sophisticated technologies aimed at personalizing education. A core component is the adaptive learning platform, which uses a machine learning algorithm for data-driven instruction and curriculum alignment. These systems, often part of a cloud-based learning platform, feature a personalized learning dashboard and a real-time feedback mechanism.
  • The push toward a hybrid classroom model is supported by a bring-your-own-device (BYOD) framework and a mobile-first learning strategy, which necessitate robust digital curriculum integration. Interactive educational tools, including gamified educational content and interactive simulations, are central to this shift. The market is also seeing the rise of the virtual reality learning environment and augmented reality education.
  • Key solutions include the learning management system (LMS), student information system (SIS), and collaborative software tools that support both synchronous learning and asynchronous learning. This blended instructional approach increasingly incorporates project-based digital learning and digital citizenship education.
  • However, the effectiveness of these systems is constrained by workforce readiness, with nearly half of educators lacking formal training in AI-powered formative assessment tools, a critical gap for strategic planning and budgeting.

What are the Key Data Covered in this K-12 Blended E-learning Market Research and Growth Report?

  • What is the expected growth of the K-12 Blended E-learning Market between 2026 and 2030?

    • USD 29.10 billion, at a CAGR of 15.2%

  • What segmentation does the market report cover?

    • The report is segmented by Product (Hardware, Content, Solutions, and Others), Application (Pre-primary school, Primary school, Middle school, and High school), Deployment (Cloud-based, and On-premises) and Geography (North America, APAC, Europe, South America, Middle East and Africa)

  • Which regions are analyzed in the report?

    • North America, APAC, Europe, South America and Middle East and Africa

  • What are the key growth drivers and market challenges?

    • Adoption of AI for adaptive learning pathway, Digital divide and inequitable access infrastructure

  • Who are the major players in the K-12 Blended E-learning Market?

    • Amplify Education Inc., BrainPOP, Curriculum Associates LLC, D2L Corp., DreamBox Learning Inc., Edmentum Inc., Google LLC, Imagine Learning LLC, Instructure Holdings Inc., IXL Learning Inc., Khan Academy Inc., McGraw Hill LLC, Microsoft Corp., Nearpod Inc., Newsela, Pearson Plc, PowerSchool Holdings Inc., Renaissance Learning Inc, Savvas Learning Co. LLC and Stride Inc.

Market Research Insights

  • The market dynamics for K-12 blended e-learning are shaped by rapid technological adoption clashing with operational realities. While over 80% of educational organizations now use generative artificial intelligence and AI-driven tutoring systems, nearly half of all educators report receiving no formal teacher training program on these tools.
  • This gap creates significant challenges in implementing a flexible learning structure and leveraging a learning analytics dashboard effectively. Furthermore, as schools adopt a hybrid learning model and increase digital content delivery, they become more vulnerable to cyber threats, with K-12 institutions seeing a 92% increase in ransomware attacks.
  • This necessitates a greater focus on cybersecurity for schools and clear policies for student data privacy, complicating the rollout of any new educational technology platform or mobile learning application.

We can help! Our analysts can customize this k-12 blended e-learning market research report to meet your requirements.

Get in touch

1. Executive Summary

1.1 Market overview

Executive Summary - Chart on Market Overview
Executive Summary - Data Table on Market Overview
Executive Summary - Chart on Global Market Characteristics
Executive Summary - Chart on Market by Geography
Executive Summary - Chart on Market Segmentation by Product
Executive Summary - Chart on Market Segmentation by Application
Executive Summary - Chart on Market Segmentation by Deployment
Executive Summary - Chart on Incremental Growth
Executive Summary - Data Table on Incremental Growth
Executive Summary - Chart on Company Market Positioning

2. Technavio Analysis

2.1 Analysis of price sensitivity, lifecycle, customer purchase basket, adoption rates, and purchase criteria

2.2 Criticality of inputs and Factors of differentiation

Chart on Overview on criticality of inputs and factors of differentiation

2.3 Factors of disruption

Chart on Overview on factors of disruption

2.4 Impact of drivers and challenges

Chart on Impact of drivers and challenges in 2025 and 2030

3. Market Landscape

3.1 Market ecosystem

Chart on Parent Market
Data Table on - Parent Market

3.2 Market characteristics

Chart on Market characteristics analysis

3.3 Value chain analysis

Chart on Value chain analysis

4. Market Sizing

4.1 Market definition

Data Table on Offerings of companies included in the market definition

4.2 Market segment analysis

Market segments

4.3 Market size 2025

4.4 Market outlook: Forecast for 2025-2030

Chart on Global - Market size and forecast 2025-2030 ($ million)
Data Table on Global - Market size and forecast 2025-2030 ($ million)
Chart on Global Market: Year-over-year growth 2025-2030 (%)
Data Table on Global Market: Year-over-year growth 2025-2030 (%)

5. Historic Market Size

5.1 Global K-12 Blended E-Learning Market 2020 - 2024

Historic Market Size - Data Table on Global K-12 Blended E-Learning Market 2020 - 2024 ($ million)

5.2 Product segment analysis 2020 - 2024

Historic Market Size - Product Segment 2020 - 2024 ($ million)

5.3 Application segment analysis 2020 - 2024

Historic Market Size - Application Segment 2020 - 2024 ($ million)

5.4 Deployment segment analysis 2020 - 2024

Historic Market Size - Deployment Segment 2020 - 2024 ($ million)

5.5 Geography segment analysis 2020 - 2024

Historic Market Size - Geography Segment 2020 - 2024 ($ million)

5.6 Country segment analysis 2020 - 2024

Historic Market Size - Country Segment 2020 - 2024 ($ million)

6. Qualitative Analysis

6.1 Impact of AI on Global K-12 Blended E-Learning Market

7. Five Forces Analysis

7.1 Five forces summary

Five forces analysis - Comparison between 2025 and 2030

7.2 Bargaining power of buyers

Bargaining power of buyers - Impact of key factors 2025 and 2030

7.3 Bargaining power of suppliers

Bargaining power of suppliers - Impact of key factors in 2025 and 2030

7.4 Threat of new entrants

Threat of new entrants - Impact of key factors in 2025 and 2030

7.5 Threat of substitutes

Threat of substitutes - Impact of key factors in 2025 and 2030

7.6 Threat of rivalry

Threat of rivalry - Impact of key factors in 2025 and 2030

7.7 Market condition

Chart on Market condition - Five forces 2025 and 2030

8. Market Segmentation by Product

8.1 Market segments

Chart on Product - Market share 2025-2030 (%)
Data Table on Product - Market share 2025-2030 (%)

8.2 Comparison by Product

Chart on Comparison by Product
Data Table on Comparison by Product

8.3 Hardware - Market size and forecast 2025-2030

Chart on Hardware - Market size and forecast 2025-2030 ($ million)
Data Table on Hardware - Market size and forecast 2025-2030 ($ million)
Chart on Hardware - Year-over-year growth 2025-2030 (%)
Data Table on Hardware - Year-over-year growth 2025-2030 (%)

8.4 Content - Market size and forecast 2025-2030

Chart on Content - Market size and forecast 2025-2030 ($ million)
Data Table on Content - Market size and forecast 2025-2030 ($ million)
Chart on Content - Year-over-year growth 2025-2030 (%)
Data Table on Content - Year-over-year growth 2025-2030 (%)

8.5 Solutions - Market size and forecast 2025-2030

Chart on Solutions - Market size and forecast 2025-2030 ($ million)
Data Table on Solutions - Market size and forecast 2025-2030 ($ million)
Chart on Solutions - Year-over-year growth 2025-2030 (%)
Data Table on Solutions - Year-over-year growth 2025-2030 (%)

8.6 Others - Market size and forecast 2025-2030

Chart on Others - Market size and forecast 2025-2030 ($ million)
Data Table on Others - Market size and forecast 2025-2030 ($ million)
Chart on Others - Year-over-year growth 2025-2030 (%)
Data Table on Others - Year-over-year growth 2025-2030 (%)

8.7 Market opportunity by Product

Market opportunity by Product ($ million)
Data Table on Market opportunity by Product ($ million)

9. Market Segmentation by Application

9.1 Market segments

Chart on Application - Market share 2025-2030 (%)
Data Table on Application - Market share 2025-2030 (%)

9.2 Comparison by Application

Chart on Comparison by Application
Data Table on Comparison by Application

9.3 Pre-primary school - Market size and forecast 2025-2030

Chart on Pre-primary school - Market size and forecast 2025-2030 ($ million)
Data Table on Pre-primary school - Market size and forecast 2025-2030 ($ million)
Chart on Pre-primary school - Year-over-year growth 2025-2030 (%)
Data Table on Pre-primary school - Year-over-year growth 2025-2030 (%)

9.4 Primary school - Market size and forecast 2025-2030

Chart on Primary school - Market size and forecast 2025-2030 ($ million)
Data Table on Primary school - Market size and forecast 2025-2030 ($ million)
Chart on Primary school - Year-over-year growth 2025-2030 (%)
Data Table on Primary school - Year-over-year growth 2025-2030 (%)

9.5 Middle school - Market size and forecast 2025-2030

Chart on Middle school - Market size and forecast 2025-2030 ($ million)
Data Table on Middle school - Market size and forecast 2025-2030 ($ million)
Chart on Middle school - Year-over-year growth 2025-2030 (%)
Data Table on Middle school - Year-over-year growth 2025-2030 (%)

9.6 High school - Market size and forecast 2025-2030

Chart on High school - Market size and forecast 2025-2030 ($ million)
Data Table on High school - Market size and forecast 2025-2030 ($ million)
Chart on High school - Year-over-year growth 2025-2030 (%)
Data Table on High school - Year-over-year growth 2025-2030 (%)

9.7 Market opportunity by Application

Market opportunity by Application ($ million)
Data Table on Market opportunity by Application ($ million)

10. Market Segmentation by Deployment

10.1 Market segments

Chart on Deployment - Market share 2025-2030 (%)
Data Table on Deployment - Market share 2025-2030 (%)

10.2 Comparison by Deployment

Chart on Comparison by Deployment
Data Table on Comparison by Deployment

10.3 Cloud-based - Market size and forecast 2025-2030

Chart on Cloud-based - Market size and forecast 2025-2030 ($ million)
Data Table on Cloud-based - Market size and forecast 2025-2030 ($ million)
Chart on Cloud-based - Year-over-year growth 2025-2030 (%)
Data Table on Cloud-based - Year-over-year growth 2025-2030 (%)

10.4 On-premises - Market size and forecast 2025-2030

Chart on On-premises - Market size and forecast 2025-2030 ($ million)
Data Table on On-premises - Market size and forecast 2025-2030 ($ million)
Chart on On-premises - Year-over-year growth 2025-2030 (%)
Data Table on On-premises - Year-over-year growth 2025-2030 (%)

10.5 Market opportunity by Deployment

Market opportunity by Deployment ($ million)
Data Table on Market opportunity by Deployment ($ million)

11. Customer Landscape

11.1 Customer landscape overview

Analysis of price sensitivity, lifecycle, customer purchase basket, adoption rates, and purchase criteria

12. Geographic Landscape

12.1 Geographic segmentation

Chart on Market share by geography 2025-2030 (%)
Data Table on Market share by geography 2025-2030 (%)

12.2 Geographic comparison

Chart on Geographic comparison
Data Table on Geographic comparison

12.3 North America - Market size and forecast 2025-2030

Chart on North America - Market size and forecast 2025-2030 ($ million)
Data Table on North America - Market size and forecast 2025-2030 ($ million)
Chart on North America - Year-over-year growth 2025-2030 (%)
Data Table on North America - Year-over-year growth 2025-2030 (%)
Chart on Regional Comparison - North America
Data Table on Regional Comparison - North America

12.3.1 US - Market size and forecast 2025-2030

Chart on US - Market size and forecast 2025-2030 ($ million)
Data Table on US - Market size and forecast 2025-2030 ($ million)
Chart on US - Year-over-year growth 2025-2030 (%)
Data Table on US - Year-over-year growth 2025-2030 (%)

12.3.2 Canada - Market size and forecast 2025-2030

Chart on Canada - Market size and forecast 2025-2030 ($ million)
Data Table on Canada - Market size and forecast 2025-2030 ($ million)
Chart on Canada - Year-over-year growth 2025-2030 (%)
Data Table on Canada - Year-over-year growth 2025-2030 (%)

12.3.3 Mexico - Market size and forecast 2025-2030

Chart on Mexico - Market size and forecast 2025-2030 ($ million)
Data Table on Mexico - Market size and forecast 2025-2030 ($ million)
Chart on Mexico - Year-over-year growth 2025-2030 (%)
Data Table on Mexico - Year-over-year growth 2025-2030 (%)

12.4 APAC - Market size and forecast 2025-2030

Chart on APAC - Market size and forecast 2025-2030 ($ million)
Data Table on APAC - Market size and forecast 2025-2030 ($ million)
Chart on APAC - Year-over-year growth 2025-2030 (%)
Data Table on APAC - Year-over-year growth 2025-2030 (%)
Chart on Regional Comparison - APAC
Data Table on Regional Comparison - APAC

12.4.1 China - Market size and forecast 2025-2030

Chart on China - Market size and forecast 2025-2030 ($ million)
Data Table on China - Market size and forecast 2025-2030 ($ million)
Chart on China - Year-over-year growth 2025-2030 (%)
Data Table on China - Year-over-year growth 2025-2030 (%)

12.4.2 India - Market size and forecast 2025-2030

Chart on India - Market size and forecast 2025-2030 ($ million)
Data Table on India - Market size and forecast 2025-2030 ($ million)
Chart on India - Year-over-year growth 2025-2030 (%)
Data Table on India - Year-over-year growth 2025-2030 (%)

12.4.3 Japan - Market size and forecast 2025-2030

Chart on Japan - Market size and forecast 2025-2030 ($ million)
Data Table on Japan - Market size and forecast 2025-2030 ($ million)
Chart on Japan - Year-over-year growth 2025-2030 (%)
Data Table on Japan - Year-over-year growth 2025-2030 (%)

12.4.4 South Korea - Market size and forecast 2025-2030

Chart on South Korea - Market size and forecast 2025-2030 ($ million)
Data Table on South Korea - Market size and forecast 2025-2030 ($ million)
Chart on South Korea - Year-over-year growth 2025-2030 (%)
Data Table on South Korea - Year-over-year growth 2025-2030 (%)

12.4.5 Australia - Market size and forecast 2025-2030

Chart on Australia - Market size and forecast 2025-2030 ($ million)
Data Table on Australia - Market size and forecast 2025-2030 ($ million)
Chart on Australia - Year-over-year growth 2025-2030 (%)
Data Table on Australia - Year-over-year growth 2025-2030 (%)

12.4.6 Indonesia - Market size and forecast 2025-2030

Chart on Indonesia - Market size and forecast 2025-2030 ($ million)
Data Table on Indonesia - Market size and forecast 2025-2030 ($ million)
Chart on Indonesia - Year-over-year growth 2025-2030 (%)
Data Table on Indonesia - Year-over-year growth 2025-2030 (%)

12.5 Europe - Market size and forecast 2025-2030

Chart on Europe - Market size and forecast 2025-2030 ($ million)
Data Table on Europe - Market size and forecast 2025-2030 ($ million)
Chart on Europe - Year-over-year growth 2025-2030 (%)
Data Table on Europe - Year-over-year growth 2025-2030 (%)
Chart on Regional Comparison - Europe
Data Table on Regional Comparison - Europe

12.5.1 Germany - Market size and forecast 2025-2030

Chart on Germany - Market size and forecast 2025-2030 ($ million)
Data Table on Germany - Market size and forecast 2025-2030 ($ million)
Chart on Germany - Year-over-year growth 2025-2030 (%)
Data Table on Germany - Year-over-year growth 2025-2030 (%)

12.5.2 UK - Market size and forecast 2025-2030

Chart on UK - Market size and forecast 2025-2030 ($ million)
Data Table on UK - Market size and forecast 2025-2030 ($ million)
Chart on UK - Year-over-year growth 2025-2030 (%)
Data Table on UK - Year-over-year growth 2025-2030 (%)

12.5.3 France - Market size and forecast 2025-2030

Chart on France - Market size and forecast 2025-2030 ($ million)
Data Table on France - Market size and forecast 2025-2030 ($ million)
Chart on France - Year-over-year growth 2025-2030 (%)
Data Table on France - Year-over-year growth 2025-2030 (%)

12.5.4 Italy - Market size and forecast 2025-2030

Chart on Italy - Market size and forecast 2025-2030 ($ million)
Data Table on Italy - Market size and forecast 2025-2030 ($ million)
Chart on Italy - Year-over-year growth 2025-2030 (%)
Data Table on Italy - Year-over-year growth 2025-2030 (%)

12.5.5 Spain - Market size and forecast 2025-2030

Chart on Spain - Market size and forecast 2025-2030 ($ million)
Data Table on Spain - Market size and forecast 2025-2030 ($ million)
Chart on Spain - Year-over-year growth 2025-2030 (%)
Data Table on Spain - Year-over-year growth 2025-2030 (%)

12.5.6 The Netherlands - Market size and forecast 2025-2030

Chart on The Netherlands - Market size and forecast 2025-2030 ($ million)
Data Table on The Netherlands - Market size and forecast 2025-2030 ($ million)
Chart on The Netherlands - Year-over-year growth 2025-2030 (%)
Data Table on The Netherlands - Year-over-year growth 2025-2030 (%)

12.6 South America - Market size and forecast 2025-2030

Chart on South America - Market size and forecast 2025-2030 ($ million)
Data Table on South America - Market size and forecast 2025-2030 ($ million)
Chart on South America - Year-over-year growth 2025-2030 (%)
Data Table on South America - Year-over-year growth 2025-2030 (%)
Chart on Regional Comparison - South America
Data Table on Regional Comparison - South America

12.6.1 Brazil - Market size and forecast 2025-2030

Chart on Brazil - Market size and forecast 2025-2030 ($ million)
Data Table on Brazil - Market size and forecast 2025-2030 ($ million)
Chart on Brazil - Year-over-year growth 2025-2030 (%)
Data Table on Brazil - Year-over-year growth 2025-2030 (%)

12.6.2 Argentina - Market size and forecast 2025-2030

Chart on Argentina - Market size and forecast 2025-2030 ($ million)
Data Table on Argentina - Market size and forecast 2025-2030 ($ million)
Chart on Argentina - Year-over-year growth 2025-2030 (%)
Data Table on Argentina - Year-over-year growth 2025-2030 (%)

12.6.3 Chile - Market size and forecast 2025-2030

Chart on Chile - Market size and forecast 2025-2030 ($ million)
Data Table on Chile - Market size and forecast 2025-2030 ($ million)
Chart on Chile - Year-over-year growth 2025-2030 (%)
Data Table on Chile - Year-over-year growth 2025-2030 (%)

12.7 Middle East and Africa - Market size and forecast 2025-2030

Chart on Middle East and Africa - Market size and forecast 2025-2030 ($ million)
Data Table on Middle East and Africa - Market size and forecast 2025-2030 ($ million)
Chart on Middle East and Africa - Year-over-year growth 2025-2030 (%)
Data Table on Middle East and Africa - Year-over-year growth 2025-2030 (%)
Chart on Regional Comparison - Middle East and Africa
Data Table on Regional Comparison - Middle East and Africa

12.7.1 Saudi Arabia - Market size and forecast 2025-2030

Chart on Saudi Arabia - Market size and forecast 2025-2030 ($ million)
Data Table on Saudi Arabia - Market size and forecast 2025-2030 ($ million)
Chart on Saudi Arabia - Year-over-year growth 2025-2030 (%)
Data Table on Saudi Arabia - Year-over-year growth 2025-2030 (%)

12.7.2 UAE - Market size and forecast 2025-2030

Chart on UAE - Market size and forecast 2025-2030 ($ million)
Data Table on UAE - Market size and forecast 2025-2030 ($ million)
Chart on UAE - Year-over-year growth 2025-2030 (%)
Data Table on UAE - Year-over-year growth 2025-2030 (%)

12.7.3 South Africa - Market size and forecast 2025-2030

Chart on South Africa - Market size and forecast 2025-2030 ($ million)
Data Table on South Africa - Market size and forecast 2025-2030 ($ million)
Chart on South Africa - Year-over-year growth 2025-2030 (%)
Data Table on South Africa - Year-over-year growth 2025-2030 (%)

12.7.4 Egypt - Market size and forecast 2025-2030

Chart on Egypt - Market size and forecast 2025-2030 ($ million)
Data Table on Egypt - Market size and forecast 2025-2030 ($ million)
Chart on Egypt - Year-over-year growth 2025-2030 (%)
Data Table on Egypt - Year-over-year growth 2025-2030 (%)

12.7.5 Nigeria - Market size and forecast 2025-2030

Chart on Nigeria - Market size and forecast 2025-2030 ($ million)
Data Table on Nigeria - Market size and forecast 2025-2030 ($ million)
Chart on Nigeria - Year-over-year growth 2025-2030 (%)
Data Table on Nigeria - Year-over-year growth 2025-2030 (%)

12.8 Market opportunity by geography

Market opportunity by geography ($ million)
Data Tables on Market opportunity by geography ($ million)

13. Drivers, Challenges, and Opportunity

13.1 Market drivers

Adoption of AI for adaptive learning pathway
Increasing demand for flexible and hybrid learning models
Government support and infrastructure modernization programs

13.2 Market challenges

Digital divide and inequitable access infrastructure
Educator readiness and professional development barriers
Data privacy and cybersecurity concerns in digital ecosystems

13.3 Impact of drivers and challenges

Impact of drivers and challenges in 2025 and 2030

13.4 Market opportunities

Adoption of mobile first learning and BYOD frameworks
Rise of immersive and gamified experiential learning environments
Expansion of verifiable digital credentials and skill portability

14. Competitive Landscape

14.1 Overview

14.2

Overview on criticality of inputs and factors of differentiation

14.3 Landscape disruption

Overview on factors of disruption

14.4 Industry risks

Impact of key risks on business

15. Competitive Analysis

15.1 Companies profiled

Companies covered

15.2 Company ranking index

15.3 Market positioning of companies

Matrix on companies position and classification

15.4 Amplify Education Inc.

Amplify Education Inc. - Overview
Amplify Education Inc. - Product / Service
Amplify Education Inc. - Key offerings
SWOT

15.5 BrainPOP

BrainPOP - Overview
BrainPOP - Product / Service
BrainPOP - Key offerings
SWOT

15.6 D2L Corp.

D2L Corp. - Overview
D2L Corp. - Product / Service
D2L Corp. - Key news
D2L Corp. - Key offerings
SWOT

15.7 DreamBox Learning Inc.

DreamBox Learning Inc. - Overview
DreamBox Learning Inc. - Product / Service
DreamBox Learning Inc. - Key offerings
SWOT

15.8 Edmentum Inc.

Edmentum Inc. - Overview
Edmentum Inc. - Product / Service
Edmentum Inc. - Key offerings
SWOT

15.9 Google LLC

Google LLC - Overview
Google LLC - Product / Service
Google LLC - Key offerings
SWOT

15.10 Imagine Learning LLC

Imagine Learning LLC - Overview
Imagine Learning LLC - Product / Service
Imagine Learning LLC - Key offerings
SWOT

15.11 Instructure Holdings Inc.

Instructure Holdings Inc. - Overview
Instructure Holdings Inc. - Product / Service
Instructure Holdings Inc. - Key news
Instructure Holdings Inc. - Key offerings
SWOT

15.12 IXL Learning Inc.

IXL Learning Inc. - Overview
IXL Learning Inc. - Product / Service
IXL Learning Inc. - Key offerings
SWOT

15.13 McGraw Hill LLC

McGraw Hill LLC - Overview
McGraw Hill LLC - Product / Service
McGraw Hill LLC - Key news
McGraw Hill LLC - Key offerings
SWOT

15.14 Microsoft Corp.

Microsoft Corp. - Overview
Microsoft Corp. - Business segments
Microsoft Corp. - Key news
Microsoft Corp. - Key offerings
Microsoft Corp. - Segment focus
SWOT

15.15 Nearpod Inc.

Nearpod Inc. - Overview
Nearpod Inc. - Product / Service
Nearpod Inc. - Key offerings
SWOT

15.16 Pearson Plc

Pearson Plc - Overview
Pearson Plc - Business segments
Pearson Plc - Key news
Pearson Plc - Key offerings
Pearson Plc - Segment focus
SWOT

15.17 PowerSchool Holdings Inc.

PowerSchool Holdings Inc. - Overview
PowerSchool Holdings Inc. - Product / Service
PowerSchool Holdings Inc. - Key offerings
SWOT

15.18 Stride Inc.

Stride Inc. - Overview
Stride Inc. - Business segments
Stride Inc. - Key offerings
Stride Inc. - Segment focus
SWOT

16. Appendix

16.1 Scope of the report

Market definition
Objectives
Notes and caveats

16.2 Inclusions and exclusions checklist

Inclusions checklist
Exclusions checklist

16.3 Currency conversion rates for US$

16.4 Research methodology

16.5 Data procurement

Information sources

16.6 Data validation

16.7 Validation techniques employed for market sizing

16.8 Data synthesis

16.9 360 degree market analysis

16.10 List of abbreviations

Research Methodology

Technavio presents a detailed picture of the market by way of study, synthesis, and summation of data from multiple sources. The analysts have presented the various facets of the market with a particular focus on identifying the key industry influencers. The data thus presented is comprehensive, reliable, and the result of extensive research, both primary and secondary.

INFORMATION SOURCES

Primary sources

  • Manufacturers and suppliers
  • Channel partners
  • Industry experts
  • Strategic decision makers

Secondary sources

  • Industry journals and periodicals
  • Government data
  • Financial reports of key industry players
  • Historical data
  • Press releases

DATA ANALYSIS

Data Synthesis

  • Collation of data
  • Estimation of key figures
  • Analysis of derived insights

Data Validation

  • Triangulation with data models
  • Reference against proprietary databases
  • Corroboration with industry experts

REPORT WRITING

Qualitative

  • Market drivers
  • Market challenges
  • Market trends
  • Five forces analysis

Quantitative

  • Market size and forecast
  • Market segmentation
  • Geographical insights
  • Competitive landscape

Interested in this report?

Get your sample now to see our research methodology and insights!

Download Now

Frequently Asked Questions

K-12 Blended E-learning market growth will increase by USD 29095.7 million during 2026-2030.

The K-12 Blended E-learning market is expected to grow at a CAGR of 15.2% during 2026-2030.

K-12 Blended E-learning market is segmented by Product (Hardware, Content, Solutions, Others) Application (Pre-primary school, Primary school, Middle school, High school) Deployment (Cloud-based, On-premises)

Amplify Education Inc., BrainPOP, Curriculum Associates LLC, D2L Corp., DreamBox Learning Inc., Edmentum Inc., Google LLC, Imagine Learning LLC, Instructure Holdings Inc., IXL Learning Inc., Khan Academy Inc., McGraw Hill LLC, Microsoft Corp., Nearpod Inc., Newsela, Pearson Plc, PowerSchool Holdings Inc., Renaissance Learning Inc, Savvas Learning Co. LLC, Stride Inc. are a few of the key vendors in the K-12 Blended E-learning market.

APAC will register the highest growth rate of 33.6% among the other regions. Therefore, the K-12 Blended E-learning market in APAC is expected to garner significant business opportunities for the vendors during the forecast period.

US, Canada, Mexico, China, India, Japan, South Korea, Australia, Indonesia, Germany, UK, France, Italy, Spain, The Netherlands, Brazil, Argentina, Chile, Saudi Arabia, UAE, South Africa, Egypt, Nigeria

  • Adoption of AI for adaptive learning pathway is the driving factor this market.

The K-12 Blended E-learning market vendors should focus on grabbing business opportunities from the Product segment as it accounted for the largest market share in the base year.