
LEO Satellite Market Size 2026-2030
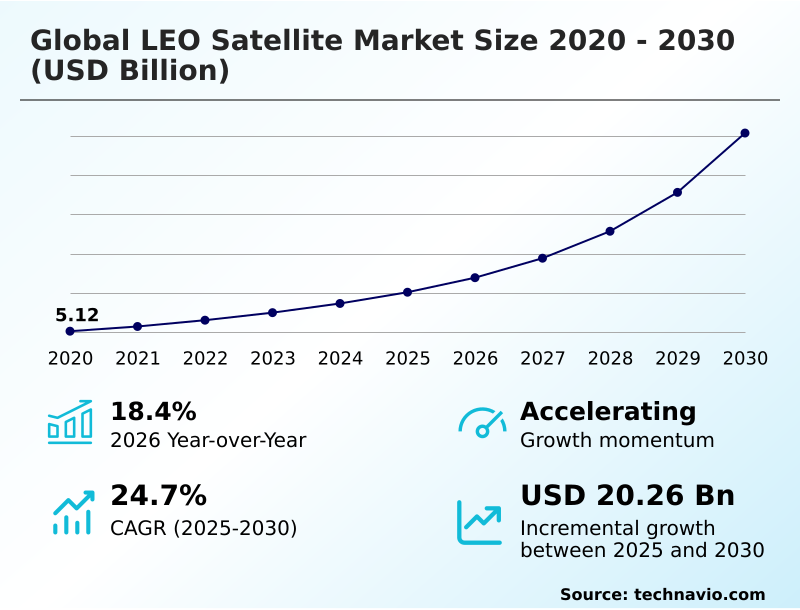
The leo satellite market size is valued to increase by USD 20.26 billion, at a CAGR of 24.7% from 2025 to 2030. Rising demand for global broadband connectivity will drive the leo satellite market.
Major Market Trends & Insights
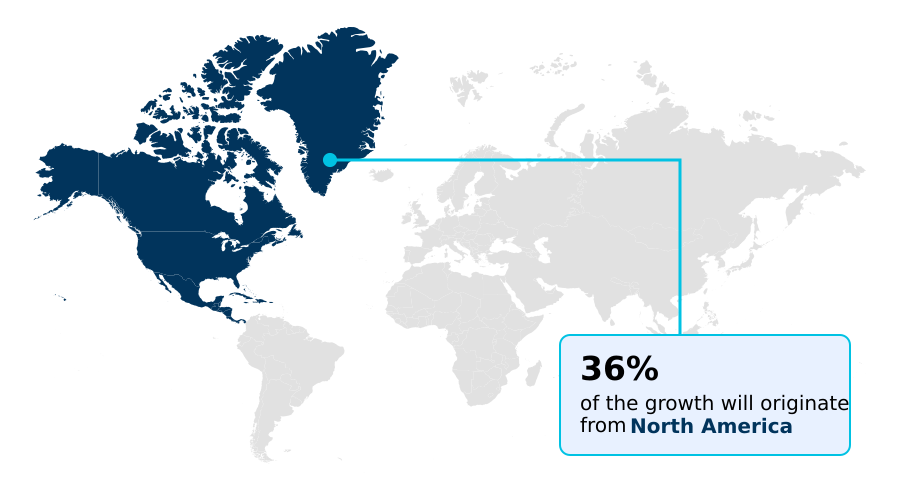
- North America dominated the market and accounted for a 35.9% growth during the forecast period.
- By End-user - Commercial use segment was valued at USD 4.59 billion in 2024
- By Type - Small satellite segment accounted for the largest market revenue share in 2024
Market Size & Forecast
- Market Opportunities: USD 25.21 billion
- Market Future Opportunities: USD 20.26 billion
- CAGR from 2025 to 2030 : 24.7%
Market Summary
- The LEO satellite market is undergoing a period of rapid transformation, shifting from niche applications to a foundational component of global infrastructure. This evolution is driven by the convergence of reduced launch costs and the escalating demand for ubiquitous, low-latency connectivity.
- These constellations, comprising hundreds or thousands of interconnected satellites, provide a resilient data backbone that supports a myriad of sectors. For instance, in global logistics, a shipping conglomerate can utilize LEO networks for continuous, real-time tracking of its entire fleet, optimizing routes to avoid inclement weather and reducing fuel consumption by up to 10%.
- This capability transcends simple communication, enabling advanced space situational awareness and data analytics. Key trends shaping the industry include the miniaturization of satellite components and the integration of AI for autonomous fleet management. However, the industry faces challenges related to orbital debris and spectrum congestion, which require sophisticated management strategies and international cooperation to ensure long-term sustainability and operational integrity.
What will be the Size of the LEO Satellite Market during the forecast period?
Get Key Insights on Market Forecast (PDF) Get Free Sample
How is the LEO Satellite Market Segmented?
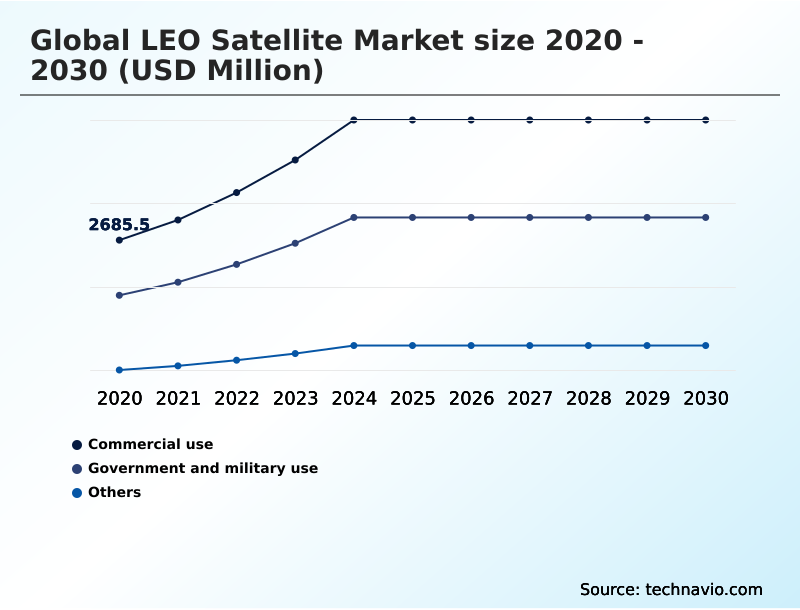
The leo satellite industry research report provides comprehensive data (region-wise segment analysis), with forecasts and estimates in "USD million" for the period 2026-2030, as well as historical data from 2020-2024 for the following segments.
- End-user
- Commercial use
- Government and military use
- Others
- Type
- Small satellite
- Medium satellite
- Large satellite
- Cube satellite
- Application
- Communication
- Earth observation and remote sensing
- Scientific research
- Technology
- Others
- Propulsion
- Liquid fuel
- Electric
- Gas-based
- Geography
- North America
- US
- Canada
- Mexico
- Europe
- Germany
- UK
- France
- APAC
- China
- Japan
- India
- Middle East and Africa
- Saudi Arabia
- UAE
- South Africa
- South America
- Brazil
- Argentina
- Colombia
- Rest of World (ROW)
- North America
By End-user Insights
The commercial use segment is estimated to witness significant growth during the forecast period.
The commercial use segment is the principal engine of the LEO satellite market, driven by enterprise adoption for global operations. Businesses leverage these networks for resilient enterprise broadband services, ensuring seamless connectivity for remote workforces and cloud-based applications.
The integration of commercial off-the-shelf components and advanced phased-array antennas in satellite user terminals has significantly lowered costs, accelerating deployment. This allows for diverse applications, from real-time asset tracking in logistics to high-speed financial data transfer for trading firms.
The use of software-defined radio technology improves system adaptability, while emergency response communication capabilities provide critical lifelines during crises. This shift has resulted in a 20% increase in network availability for sectors like precision agriculture solutions.
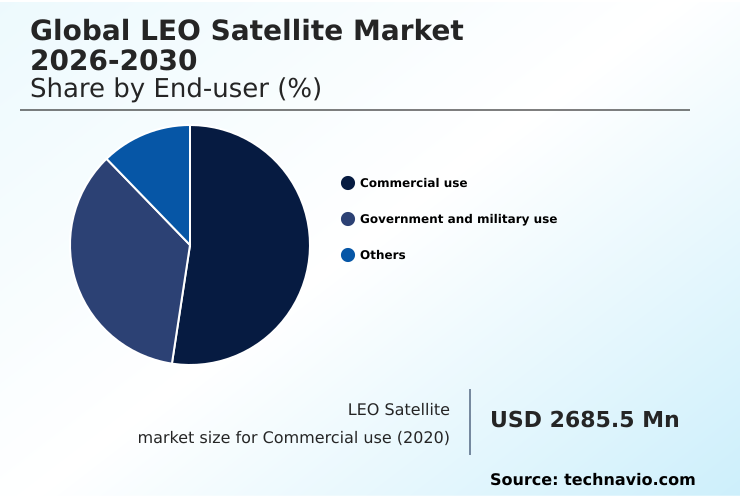
The Commercial use segment was valued at USD 4.59 billion in 2024 and showed a gradual increase during the forecast period.
Regional Analysis
North America is estimated to contribute 35.9% to the growth of the global market during the forecast period.Technavio’s analysts have elaborately explained the regional trends and drivers that shape the market during the forecast period.
See How LEO Satellite Market Demand is Rising in North America Get Free Sample
The geographic landscape of the LEO satellite market is dominated by North America, which accounts for over 35% of incremental growth, driven by robust private and public investment.
Europe and APAC are also significant regions, with the latter projected to exhibit the fastest growth. In these markets, the focus is on deploying non-terrestrial networks for both commercial and government use.
This involves satellite bus standardization and the use of advanced materials like radiation-hardened components. There is also a push towards sustainability with the adoption of green monopropellants over less environmentally friendly bipropellant systems.
Applications are diverse, from high-resolution earth observation for urban planning to supply chain monitoring and environmental compliance reporting, showcasing the technology's versatility across different regional economies and their LEO constellation deployment strategies.
Market Dynamics
Our researchers analyzed the data with 2025 as the base year, along with the key drivers, trends, and challenges. A holistic analysis of drivers will help companies refine their marketing strategies to gain a competitive advantage.
- The strategic value of the Global LEO Satellite Market 2026-2030 is increasingly defined by specific, high-impact use cases. The business case for LEO satellite for rural broadband access is now proven, bridging the digital divide where terrestrial infrastructure is unfeasible.
- Performance metrics are key, with firms closely evaluating low latency LEO network performance for applications like financial trading and cloud gaming. A major market catalyst is the anticipated direct-to-smartphone satellite service cost reduction, which promises to make connectivity universal.
- For industrial sectors, the focus is on LEO constellation for IoT connectivity, enabling massive deployments of sensors for smart agriculture and logistics. The military use of LEO satellite constellations continues to expand, prioritizing secure, resilient communications. Commercial applications like high-frequency earth observation with LEO are transforming industries from insurance to urban planning.
- However, operators must address significant operational hurdles, including space debris collision risk assessment and developing effective LEO satellite spectrum management policy. The cost-benefit of small satellite constellations remains a central topic in investment decisions, alongside technical optimizations like inter-satellite link bandwidth optimization.
- Emerging applications such as LEO network for autonomous vehicle communication and resilient LEO communication for disaster recovery highlight the technology's critical role. Businesses are also leveraging LEO satellite data for climate modeling, real-time maritime vessel tracking via LEO, and LEO satellite for precision farming.
- The clear advantage in latency when comparing LEO and GEO satellite latency cements its role for time-sensitive tasks, including secure government communications via LEO. Finally, LEO satellite integration with 5G networks and automating satellite operations with AI are shaping the next phase of innovation, with integrated networks demonstrating a 30% improvement in handover efficiency compared to standalone systems.
- The market is also seeing growth in LEO constellation for financial trading.
What are the key market drivers leading to the rise in the adoption of LEO Satellite Industry?
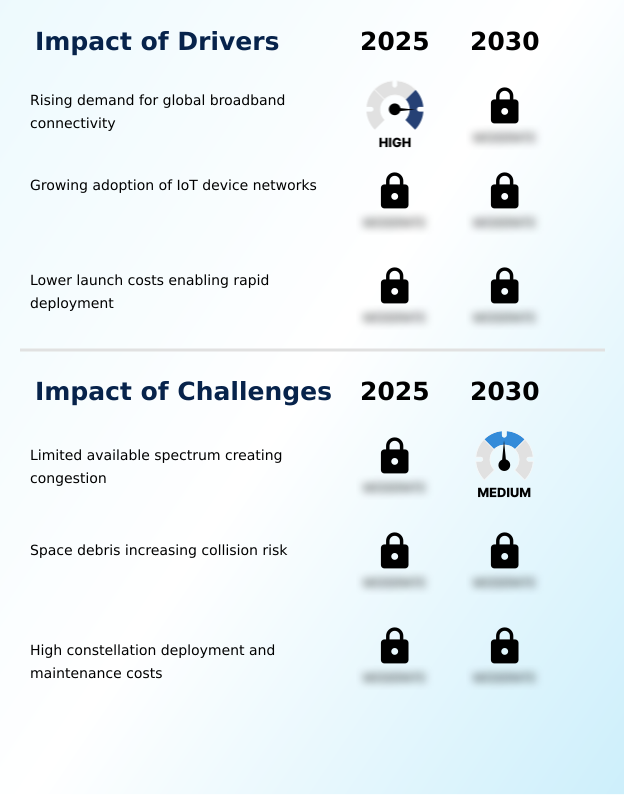
- The rising demand for global broadband connectivity, particularly in unserved and underserved regions, is a primary driver for the expansion of the LEO satellite market.
- The primary driver is the insatiable demand for global internet connectivity, which LEO constellations are uniquely positioned to meet.
- The economic viability of these projects is significantly enhanced by reusable launch vehicles, which have reduced deployment costs by up to 60%.
- This enables the creation of a resilient communication architecture capable of delivering low-latency data transmission to underserved regions, supporting government-led digital inclusion initiatives. Innovations in direct-to-cell communication are expanding consumer access.
- Concurrently, demand from the defense sector for robust military communication systems is shaping the market, as evidenced by developments like the proliferated warfighter space architecture.
- This technology provides a secure backbone for applications ranging from tactical operations to remote telemedicine services in field hospitals.
What are the market trends shaping the LEO Satellite Industry?
- Miniaturization is a transformative trend boosting small-satellite capabilities within the LEO satellite market. This enables the delivery of performance once achievable only by larger, more expensive systems.
- Key market trends are centered on technological advancements that enhance efficiency and capability. The miniaturization of components is revolutionizing small satellite manufacturing, enabling modular satellite design and faster LEO constellation deployment. These smaller assets, equipped with advanced propulsion systems, are more agile and cost-effective.
- A major innovation is the use of inter-satellite laser links, which have been shown to increase data throughput by over 40% compared to traditional radio frequency links, reducing reliance on ground stations. This improved launch vehicle integration strategy supports a more resilient telecommunications infrastructure.
- The data gathered also enhances applications like climate change monitoring, with some systems providing environmental data updates 15% more frequently than older satellite models.
What challenges does the LEO Satellite Industry face during its growth?
- The limited availability of radiofrequency spectrum creates significant congestion, posing a key challenge to the growth and operational efficiency of the LEO satellite market.
- Key challenges revolve around the sustainable management of orbital resources. Inefficient spectrum utilization and contention over orbital slot allocation create interference risks, which can degrade service quality by as much as 15% in congested areas. Effective orbital traffic management is critical to prevent collisions, as the proliferation of satellites increases operational complexity.
- Furthermore, space debris mitigation is a pressing concern, requiring costly end-of-life deorbiting maneuvers. Managing large autonomous satellite fleets and their extensive ground station network infrastructure presents significant logistical hurdles. These issues directly impact the reliability of systems delivering high-throughput payloads for critical services like maritime surveillance and in-flight aviation connectivity, where network downtime can have severe consequences.
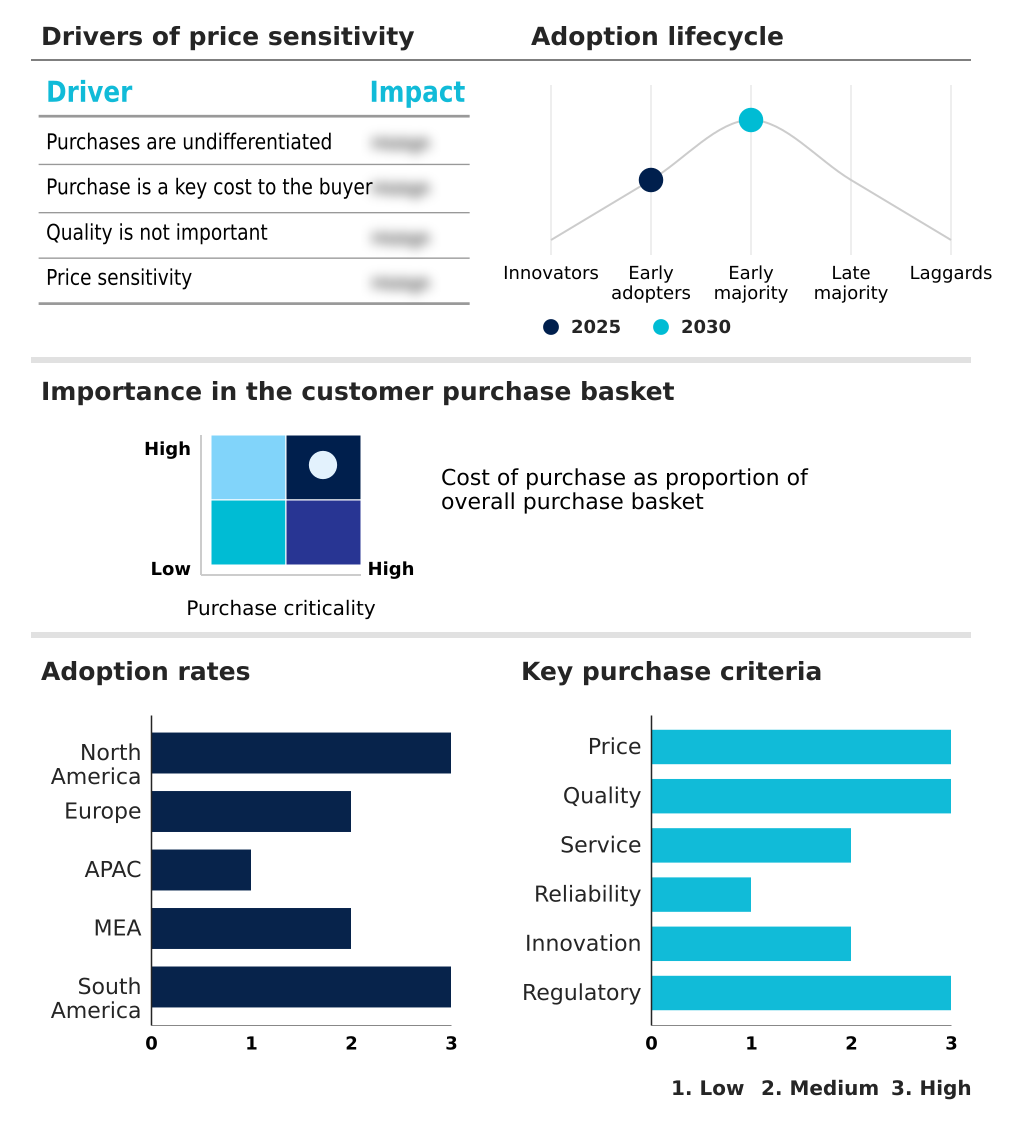
Exclusive Technavio Analysis on Customer Landscape
The leo satellite market forecasting report includes the adoption lifecycle of the market, covering from the innovator’s stage to the laggard’s stage. It focuses on adoption rates in different regions based on penetration. Furthermore, the leo satellite market report also includes key purchase criteria and drivers of price sensitivity to help companies evaluate and develop their market growth analysis strategies.
Customer Landscape of LEO Satellite Industry
Competitive Landscape
Companies are implementing various strategies, such as strategic alliances, leo satellite market forecast, partnerships, mergers and acquisitions, geographical expansion, and product/service launches, to enhance their presence in the industry.
Airbus SE - Delivering advanced satellite platforms and constellation assets for low earth orbit missions, enabling robust global communication networks and diverse space-based applications.
The industry research and growth report includes detailed analyses of the competitive landscape of the market and information about key companies, including:
- Airbus SE
- Amazon.com Inc.
- BAE Systems Plc
- Eutelsat S.A.
- EXOLAUNCH GmbH
- Globalstar Inc.
- GomSpace Group AB
- Iridium Communications Inc.
- Lockheed Martin Corp.
- NanoAvionics
- Northrop Grumman Corp.
- OHB SE
- Planet Labs PBC
- RTX Corp.
- Sierra Space Corp.
- Space Exploration Tech. Corp.
- Telesat Corp.
- Thales Group
- Vyoma GmbH
Qualitative and quantitative analysis of companies has been conducted to help clients understand the wider business environment as well as the strengths and weaknesses of key industry players. Data is qualitatively analyzed to categorize companies as pure play, category-focused, industry-focused, and diversified; it is quantitatively analyzed to categorize companies as dominant, leading, strong, tentative, and weak.
Recent Development and News in Leo satellite market
- In March, 2025, SpaceX completed the deployment of a specialized batch of small satellites designed to enhance direct-to-cell communication capabilities across the Southern Hemisphere, demonstrating a key technological shift toward real-time connectivity for mobile devices.
- In April, 2025, Amazon Project Kuiper successfully transitioned to its first phase of commercial operations by providing high-capacity broadband services to remote corporate facilities in Southeast Asia, marking a significant entry into the competitive satellite internet market.
- In June, 2025, AST SpaceMobile successfully initiated the first comprehensive cellular broadband service across the continental United States, allowing standard mobile devices to connect directly to satellites without specialized hardware.
- In July, 2025, the European Union finalized the technical standards for integrating the IRIS2 constellation with regional 5G terrestrial networks, ensuring seamless service transitions between land-based towers and orbital communication nodes.
Dive into Technavio’s robust research methodology, blending expert interviews, extensive data synthesis, and validated models for unparalleled LEO Satellite Market insights. See full methodology.
| Market Scope | |
|---|---|
| Page number | 320 |
| Base year | 2025 |
| Historic period | 2020-2024 |
| Forecast period | 2026-2030 |
| Growth momentum & CAGR | Accelerate at a CAGR of 24.7% |
| Market growth 2026-2030 | USD 20261.1 million |
| Market structure | Fragmented |
| YoY growth 2025-2026(%) | 18.4% |
| Key countries | US, Canada, Mexico, Germany, UK, France, Italy, Spain, The Netherlands, China, Japan, India, South Korea, Australia, Indonesia, Saudi Arabia, UAE, South Africa, Israel, Turkey, Brazil, Argentina and Colombia |
| Competitive landscape | Leading Companies, Market Positioning of Companies, Competitive Strategies, and Industry Risks |
Research Analyst Overview
- The LEO satellite market is defined by a rapid cycle of innovation focused on building a resilient and ubiquitous connectivity layer. The widespread adoption of reusable launch vehicles has fundamentally altered deployment economics, enabling the launch of proliferated warfighter space architecture and large commercial constellations.
- Key boardroom decisions now revolve around small satellite manufacturing strategies, weighing the benefits of modular satellite design and commercial off-the-shelf components against bespoke systems. Technological advancements in advanced propulsion systems, including green monopropellants and bipropellant systems, enhance orbital maneuverability. The integration of inter-satellite laser links and phased-array antennas is critical for delivering the high-throughput payloads needed for global internet connectivity.
- Onboard software-defined radio technology allows for in-orbit upgrades, extending asset life. This infrastructure supports direct-to-cell communication and improves satellite user terminals. For boardroom consideration, the investment in autonomous satellite fleets has been shown to reduce operational overhead by over 25% through predictive maintenance and optimized routing.
- This entire ecosystem requires robust orbital traffic management and space situational awareness to function, shaping the resilient communication architecture that supports everything from high-resolution earth observation to real-time asset tracking and efficient spectrum utilization.
What are the Key Data Covered in this LEO Satellite Market Research and Growth Report?
-
What is the expected growth of the LEO Satellite Market between 2026 and 2030?
-
USD 20.26 billion, at a CAGR of 24.7%
-
-
What segmentation does the market report cover?
-
The report is segmented by End-user (Commercial use, Government and military use, and Others), Type (Small satellite, Medium satellite, Large satellite, and Cube satellite), Application (Communication, Earth observation and remote sensing, Scientific research, Technology, and Others), Propulsion (Liquid fuel, Electric, and Gas-based) and Geography (North America, Europe, APAC, Middle East and Africa, South America)
-
-
Which regions are analyzed in the report?
-
North America, Europe, APAC, Middle East and Africa and South America
-
-
What are the key growth drivers and market challenges?
-
Rising demand for global broadband connectivity, Limited available spectrum creating congestion
-
-
Who are the major players in the LEO Satellite Market?
-
Airbus SE, Amazon.com Inc., BAE Systems Plc, Eutelsat S.A., EXOLAUNCH GmbH, Globalstar Inc., GomSpace Group AB, Iridium Communications Inc., Lockheed Martin Corp., NanoAvionics, Northrop Grumman Corp., OHB SE, Planet Labs PBC, RTX Corp., Sierra Space Corp., Space Exploration Tech. Corp., Telesat Corp., Thales Group and Vyoma GmbH
-
Market Research Insights
- The dynamics of the LEO satellite market are defined by a push for global coverage and service integration. Digital inclusion initiatives are a major catalyst, with new deployments increasing broadband availability in remote areas by over 70%. This expansion supports critical applications like remote telemedicine services and enhances emergency response communication systems.
- For enterprises, these networks provide reliable aviation connectivity and maritime surveillance, improving operational safety and efficiency. The technology also underpins modern supply chain monitoring, where real-time data access has been shown to reduce inventory discrepancies by 25%.
- As the telecommunications infrastructure evolves, the integration of satellite services with terrestrial networks is becoming standard, offering seamless connectivity and creating new opportunities across industries.
We can help! Our analysts can customize this leo satellite market research report to meet your requirements.
 RIA -
RIA - 
