Lepidolite Market Size 2024-2028
The lepidolite market size is estimated to grow by USD 55,929.5 thousand at a CAGR of 46.12% between 2023 and 2028. The market is experiencing significant growth due to a surge in demand from various applications, including electric vehicles and renewable energy storage systems. The EV industry's increasing adoption of lithium-ion batteries as the preferred power source is driving market growth. Furthermore, the rise in demand from developing countries, where electricity access is limited, is fueling the market's expansion. These countries are investing heavily in renewable energy and EV infrastructure, leading to an increased demand for reliable and efficient energy storage solutions. The lithium-ion battery market is expected to continue its upward trajectory, with innovative technologies and advancements in battery chemistry further enhancing its appeal.
What will be the Size of the Market During the Forecast Period?
For More Highlights About this Report, Request Free Sample
Market Dynamic and Customer Landscape
Lepidolite is a mica mineral known for its pink to purple hue and is a lithium aluminum silicate. It is often found in granite and pegmatite rocks and contains significant amounts of lithium, making it an essential mineral for various industries. Lepidolite is primarily used for industrial purposes, such as the production of lithium for batteries and other applications. In mineralogy and geology, it is valued as a mineral specimen and ornamental stone. The primary use of lepidolite is in the production of lithium for batteries, particularly lithium-ion batteries used in hybrid cars, mobile phones, and laptops. Lepidolite is also used as a heat insulator and in the production of lithium metal and lithium polymer batteries. The mineral's unique properties make it a valuable resource in the growing market for advanced technologies. In addition to its industrial uses, lepidolite is also used in the jewelry industry for its luxurious and status-enhancing qualities. It is believed to have various health benefits, including the ability to improve skin health, connective tissues, and nerve-related disorders, making it a popular addition to skincare products and traditional medicine.
The global lepidolite market is expected to grow due to the increasing demand for lithium in batteries and other high-tech applications. The mineral's unique properties and potential health benefits make it a valuable resource for various industries and applications. The market for lepidotite is driven by the growing demand for advanced technologies, particularly in the automotive and electronics industries. The mineral's use in the jewelry industry is also expected to contribute to the market's growth, as consumers continue to seek out unique and luxurious materials for their personal adornments. In conclusion, lepidolite is a valuable mineral with a wide range of applications, from industrial uses in battery production to ornamental and health-related applications. Its unique properties and growing demand make it a promising market for various industries and applications, particularly in the areas of advanced technologies and luxury goods. The global lepidolite market is expected to continue to grow in the coming years, driven by the increasing demand for lithium and other high-value applications. Our researchers analyzed the data with 2023 as the base year, along with the key drivers, trends, and challenges. A holistic analysis of drivers will help companies refine their marketing strategies to gain a competitive advantage.
Key Market Driver
Surge in demand from diversified applications is notably driving the market growth. Lepidolite, a mineral rich in potassium ions, holds significant value in various industries due to its unique properties. In the medical field, it is known for its potential benefits on the skin, connective tissues, and the immune system. In the jewelry industry, it is prized for its luxurious and status-enhancing appeal. However, the primary commercial use of Lepidolite is in the lithium processing industry. The rising demand for lithium in applications such as glass and ceramics, lubricants, power grid storage, and lithium-ion batteries is driving market growth. Lithium compounds, including Lepidolite, are used in the production of enamels and glazes, reducing thermal expansion and firing temperatures while increasing strength.
Furthermore, the expansion of the residential and non-residential building sectors in Asia Pacific countries, particularly China, India, Indonesia, and the Philippines, is fueling the demand for lithium. Additionally, the increasing popularity of consumer electronic devices, such as mobile phones, laptops, power banks, digital cameras, and notebook PCs, is contributing to the market growth due to the high energy-to-weight ratios, slow loss of charge, lightweight, and lack of memory effect of lithium-ion batteries. Thus, such factors are driving the growth of the market during the forecast period.
Significant Market Trends
Rise in preference for renewable energy is the key trend in the market. The Lepidolite market is experiencing significant growth due to the increasing demand for lithium-ion batteries in various industries, particularly in renewable energy. The extensive utilization of lithium-ion batteries in renewable energy storage solutions is being driven by the rising adoption of renewable energy sources worldwide. These batteries are used in hybrid wind turbines and solar panels to store energy produced from solar and wind power.
Furthermore, the immune system, connective tissues, and nerve-related disorders are believed to benefit from the presence of potassium ions, a component of Lepidolite. However, the primary driver of the market is the luxury jewelry industry, where Lepidolite is used for its unique color and status symbol value. Production units for Lepidolite are primarily located in countries with significant lithium deposits, and the lithium processing and extraction industries are integral to the supply chain. The increasing demand for lithium-ion batteries in renewable energy storage solutions is expected to continue, further boosting the market for Lepidolite. Thus, such trends will shape the growth of the market during the forecast period
Major Market Challenge
Lithium extraction challenges is the major challenge that affects the growth of the market. Lepidolite, a mica mineral, contains significant amounts of potassium ions, making it an essential source for various industries. However, its primary use is in the extraction of lithium ions, which are in high demand due to their application in the production of connective tissues, nerve related disorders, and the luxury jewelry industry for their status symbol. Lithium extraction from lepidolite involves roasting methods, which have disadvantages such as high energy consumption, harsh operating conditions, and stringent environmental restrictions. These challenges make lithium extraction from low-grade ores like lepidolite less viable, leading to environmental concerns. The extraction process of lithium from lepidolite results in various environmental impacts.
Furthermore, it pollutes water sources, increases carbon dioxide emissions, wastes gallons of water, depletes fertile land, causes respiratory problems, reduces the water table, produces massive mining wastes, tampers with the water cycle, and more. These environmental concerns necessitate stringent regulations, which may hinder the growth of the lepidolite market during the forecast period. The lithium processing industry is under scrutiny for its environmental footprint, and efforts are underway to develop more sustainable methods for lithium extraction. Hence, the above factors will impede the growth of the market during the forecast period
Exclusive Customer Landscape
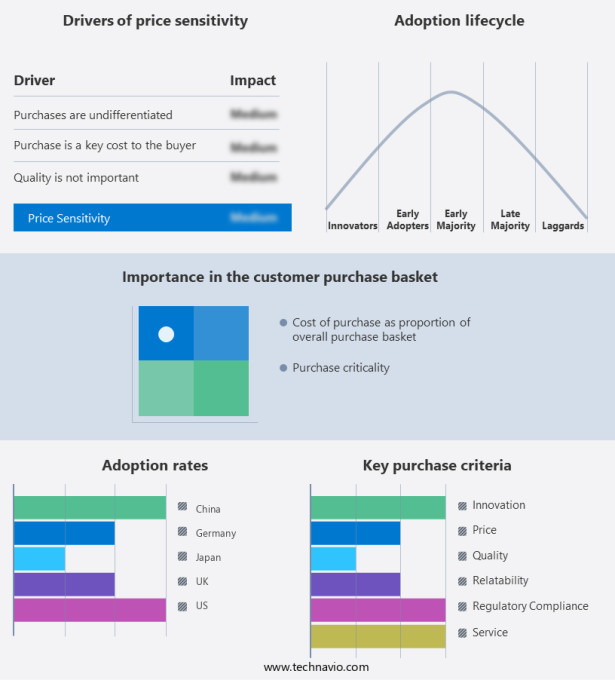
The market forecasting report includes the adoption lifecycle of the market, covering from the innovator’s stage to the laggard’s stage. It focuses on adoption rates in different regions based on penetration. Furthermore, the report also includes key purchase criteria and drivers of price sensitivity to help companies evaluate and develop their market growth analysis strategies.
Customer Landscape
Key Companies & Market Insights
Companies are implementing various strategies, such as strategic alliances, partnerships, mergers and acquisitions, geographical expansion, and product/service launches, to enhance their presence in the market.
Hallgarten and Co. Ltd. - The company offers lepidolite project which is Coolgardie Rare Metals Venture, a joint initiative with lithium Australia to explore lithium prospective holdings in the southern goldfields of Western Australia.
The market research and growth report also includes detailed analyses of the competitive landscape of the market and information about key companies, including:
- Eastern Resources
- Ganfeng Lithium Group Co., Ltd
- Hallgarten and Co. Ltd.
- J and H CHEM Co. Ltd.
- LEPICICO Ltd.
- Lepidolite
- Lithium Australia Ltd.
- Merck and Co. Inc.
- SVS Chemical Corp. LLP
- The Gemstone Factory
- Triveni Interchem Pvt. Ltd.
Qualitative and quantitative analysis of companies has been conducted to help clients understand the wider business environment as well as the strengths and weaknesses of key market players. Data is qualitatively analyzed to categorize companies as pure play, category-focused, industry-focused, and diversified; it is quantitatively analyzed to categorize companies as dominant, leading, strong, tentative, and weak.
Market Segmentation
By End-user
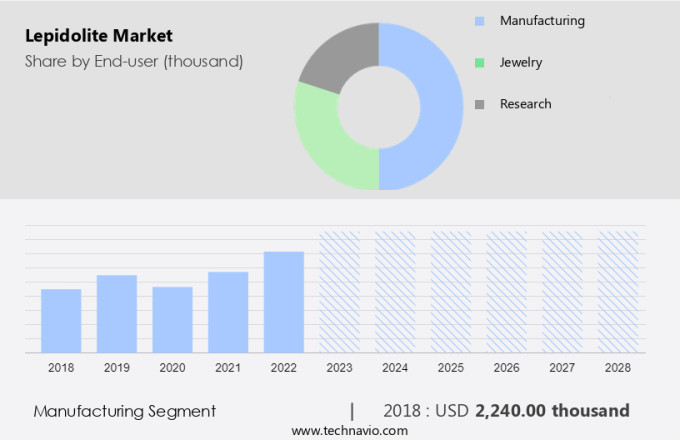
The market share growth by the Manufacturing segment will be significant during the forecast period. Lepidolite is a mineral in the mica group, specifically a lithium aluminum silicate. It is recognized for its pink to purple hue and is often used as an ornamental stone. However, its primary industrial value lies in its lithium content. Lithium is extracted from lepidolite through a process involving mixed grinding with sodium sulfide followed by water leaching. This lithium is then utilized in the production of lithium metal, which is essential for the manufacture of lithium-ion and lithium polymer batteries.
Get a glance at the market share of various regions Download the PDF Sample
The manufacturing segment showed a gradual increase in the market share of USD 2,240 thousand in 2018. These batteries are widely used in hybrid cars, mobile phones, laptops, and other portable devices. Lithium also finds applications in various industries such as ceramics, glass, lubrication, and pharmaceuticals. In the ceramics and glass industries, lithium lowers the melting points, enhancing the manufacturing process. Lithium-ion batteries, particularly lithium iron phosphate batteries, are the preferred energy storage systems for electric vehicles due to their high energy density, long cycle time, and safety features. Lepidolite reserves are crucial for the extraction of lithium, which is an integral component of sustainable energy sources such as hybrid wind turbines and solar panels. Additionally, lithium is used in the aerospace and electronics industries, as well as in the production of jewelry.
By Region
For more insights on the market share of various regions Download PDF Sample now!
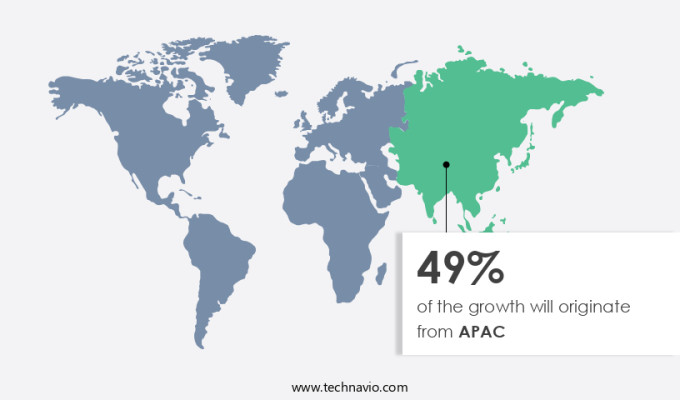
APAC is estimated to contribute 49% to the growth of the global market during the forecast period. Technavio’s analysts have elaborately explained the regional trends and drivers that shape the market during the forecast period.
Lepidolite, a lithium aluminum silicate mineral belonging to the mica group, is renowned for its pink to purple hue and hexagonal crystal structure. This mineral is primarily found in granite and pegmatite rocks, making it a valuable resource for both industrial purposes and mineral specimen collection. Lepidolite contains significant amounts of lithium, a critical element in various industries, including batteries, thermal insulation, geological research, lubricants, ceramics, glass industries, and sustainable energy sources. Lepidolite reserves are essential for lithium extraction methods, which are crucial for the production of lithium ion batteries used in hybrid wind turbines, solar panels, hybrid cars, mobile phones, laptops, portable devices, and consumer goods. The mineral is also used in the aerospace and electronics industries due to its lightweight and high heat insulation properties. In addition, Lepidolite has applications in the jewellery industry, adding a touch of prosperity and elegance to ornamental use. The geology and mineralogy of Lepidolite continue to intrigue scientists and researchers, making it a subject of ongoing study.
Segment Overview
The market research report provides comprehensive data (region-wise segment analysis), with forecasts and estimates in "USD thousand " for the period 2024-2028, as well as historical data from 2018-2022 for the following segments.
- End-user Outlook
- Manufacturing
- Jewelry
- Research
- Region Outlook
- North America
- The U.S.
- Canada
- Europe
- The U.K.
- Germany
- France
- Rest of Europe
- APAC
- China
- India
- Middle East & Africa
- Saudi Arabia
- South Africa
- Rest of the Middle East & Africa
- South America
- Argentina
- Brazil
- Chile
- North America
You may also interested in below market reports:
-
Rubidium Market: by Application and Geography - Forecast and Analysis
-
Cesium Market: Analysis North America, APAC, Europe, Middle East and Africa, South America - US, Canada, China, Zimbabwe, Germany - Size and Forecast
-
Sodium Bromide Market: Analysis APAC, North America, Europe, Middle East and Africa, South America - China, US, India, Saudi Arabia, Norway - Size and Forecast
Market Analyst Overview
Lepidolite is a lithium-aluminum silicate mineral, belonging to the mica group, known for its pink to purple hue. This mineral is often found in granite and pegmatite rocks, and its primary uses include industrial purposes and ornamental applications. In industrial settings, Lepidolite is primarily used for lithium extraction due to its high lithium content. Lithium is a valuable element used in various industries, including batteries, thermal insulation, lubricants, ceramics, and glass industries. For lithium extraction, Lepidolite reserves are mined and processed using various methods. The extracted lithium is then used to produce lithium ion batteries, which are essential components of sustainable energy sources such as hybrid wind turbines and solar panels. Lithium is also used in the production of lithium metal and lithium polymer batteries, which are widely used in hybrid cars, mobile phones, laptops, and portable devices. In the ornamental stone market,
Lepidolite is valued for its unique color and attractive appearance. It is often used as a mineral specimen and in the jewelry industry, where it is used to create beautiful and unique jewelry pieces. The mineralogy and geology of Lepidolite continue to be subjects of interest for researchers and enthusiasts alike. In summary, Lepidolite is a versatile mineral with a wide range of applications, from industrial uses such as lithium extraction to ornamental applications in the jewelry industry. Its unique properties make it a valuable resource for the production of sustainable energy sources, consumer goods, and various industries, including aerospace, electronics, and manufacturing.
|
Market Scope |
|
|
Report Coverage |
Details |
|
Page number |
135 |
|
Base year |
2023 |
|
Historic period |
2018-2022 |
|
Forecast period |
2024-2028 |
|
Growth momentum & CAGR |
Accelerate at a CAGR of 46.12% |
|
Market growth 2024-2028 |
USD 55,929.5 thousand |
|
Market structure |
Concentrated |
|
YoY growth 2023-2024(%) |
32.84 |
|
Regional analysis |
APAC, Europe, North America, South America, and Middle East and Africa |
|
Performing market contribution |
APAC at 49% |
|
Key countries |
China, US, Japan, Germany, and UK |
|
Competitive landscape |
Leading Companies, Market Positioning of Companies, Competitive Strategies, and Industry Risks |
|
Key companies profiled |
Eastern Resources, Ganfeng Lithium Group Co., Ltd, Hallgarten and Co. Ltd., J and H CHEM Co. Ltd., LEPICICO Ltd., Lepidolite, Lithium Australia Ltd., Merck and Co. Inc., SVS Chemical Corp. LLP, The Gemstone Factory, and Triveni Interchem Pvt. Ltd. |
|
Market dynamics |
Parent market analysis, Market Forecasting, Market growth inducers and obstacles, Fast-growing and slow-growing segment analysis, COVID-19 impact and recovery analysis and future consumer dynamics, Market condition analysis for market forecast period |
|
Customization purview |
If our report has not included the data that you are looking for, you can reach out to our analysts and get segments customized. |
What are the Key Data Covered in this Market Report?
- CAGR of the market during the forecast period
- Detailed information on factors that will drive the market growth and forecasting of the market between 2024 and 2028
- Precise estimation of the size of the market size and its contribution to the parent market
- Accurate predictions about upcoming market trends and analysis and changes in consumer behavior
- Growth of the market industry across Europe, North America, APAC, South America, and Middle East and Africa
- Thorough market growth analysis of the market’s competitive landscape and detailed information about companies
- Comprehensive market analysis and report on the factors that will challenge the market research and growth of market companies


