Lice Treatment Market Size 2025-2029
The lice treatment market size is forecast to increase by USD 124.6 million at a CAGR of 5.8% between 2024 and 2029.
- The market is driven by the increasing prevalence of lice infestations and the growing population of children. With the rise in the number of cases, there is a significant demand for effective lice treatment solutions. However, the high cost of healthcare poses a significant challenge for many consumers, limiting their access to these treatments. The high cost of healthcare and the desire for affordable personal items further fuel the market's growth. As a result, there is a growing trend towards the development of affordable and over-the-counter lice treatment options. Companies in the market can capitalize on this trend by offering cost-effective solutions while ensuring their products are safe and effective.
- Additionally, the market presents opportunities for innovation through the development of new treatment methods and technologies. However, navigating regulatory requirements and addressing the growing issue of lice developing resistance to existing treatments are key challenges that companies must address to maintain a competitive edge. In response, manufacturers are developing innovative solutions, including lice prevention products like shampoos, conditioners, and combs, as well as hats and other accessories designed to minimize the risk of infestations.
What will be the Size of the Lice Treatment Market during the forecast period?

Explore in-depth regional segment analysis with market size data - historical 2019-2023 and forecasts 2025-2029 - in the full report.
Request Free Sample
The market encompasses various diagnostic methods for lice infestation, prevention products, and treatment solutions. Lice prevention measures, such as regular head checks and the use of lice prevention techniques, are crucial in mitigating infestations. The frequency of lice treatment depends on the severity and persistence of infestations, with some requiring prolonged treatment durations. Effective lice removal products and techniques are essential for successful eradication, while compliance with treatment plans is vital for managing lice infestations. Lice control techniques and strategies, including monitoring and surveillance, ensure timely intervention and prevent the spread of infestations. Lice treatment availability and accessibility are crucial factors influencing market trends, with an increasing focus on affordable and safe treatment options.
The development of advanced lice control products and methods aims to improve treatment effectiveness and reduce the need for frequent interventions. Lice prevention education plays a vital role in reducing the incidence of infestations, with strategies emphasizing early detection and consistent application of prevention measures. The market for lice treatment continues to evolve, driven by advancements in technology and a growing awareness of the importance of effective lice infestation management. Natural lice remedies, such as essential oils and vinegar, are gaining popularity as effective and safe alternatives to chemical-based treatments.
How is this Lice Treatment Industry segmented?
The lice treatment industry research report provides comprehensive data (region-wise segment analysis), with forecasts and estimates in "USD million" for the period 2025-2029, as well as historical data from 2019-2023 for the following segments.
- Distribution Channel
- Hospitals and clinics
- Online
- Retail pharmacies
- Product Type
- OTC products
- Prescription medications
- Route Of Administration
- Topical
- Oral
- Geography
- North America
- US
- Canada
- Europe
- France
- Germany
- Italy
- UK
- APAC
- China
- India
- Japan
- South America
- Brazil
- Rest of World (ROW)
- North America
By Distribution Channel Insights
The Hospitals and Clinics segment is estimated to witness significant growth during the forecast period. Head lice infestations persist as a common health concern, particularly among school-aged children. Public health organizations continue to raise awareness, leading to increased demand for accessible and effective lice treatment solutions. Over-the-counter (OTC) options, such as topical treatments, shampoos, lotions, and sprays, have gained popularity due to their convenience and affordability. These products often include essential oils like lavender and tea tree oil, as well as medicated shampoos and conditioners. Despite their widespread use, side effects and costs can be concerns for some consumers. Social stigma surrounding lice infestations can also discourage individuals from seeking treatment, leading to potential health risks and the spread of infestations.
Industry regulations ensure the safety and efficacy of OTC treatments, while combination treatments and natural remedies offer alternatives for those seeking non-chemical options. Scalp hygiene and lice control practices, such as regular combing and repellents, are essential for preventing infestations. Lice eggs, or nits, can be challenging to remove, necessitating the use of specialized combs and prescription treatments in some cases. Pubic lice, or crabs, require different treatment methods. Product marketing and consumer education play significant roles in the market. Brands strive to differentiate themselves through product efficacy, packaging, and customer satisfaction, while pricing strategies cater to various income levels.
Home remedies, such as neem oil, rosemary oil, and vinegar, also remain popular alternatives. Clinical trials and product labeling ensure transparency and safety for consumers. Despite advancements, challenges persist, including unequal access to healthcare in low-income communities and the psychological impact of lice infestations. The market continues to evolve, with a focus on innovation, consumer needs, and public health concerns. Lice infestations are common in schools and daycare centers, leading to increased awareness and the need for effective lice treatment and prevention solutions.
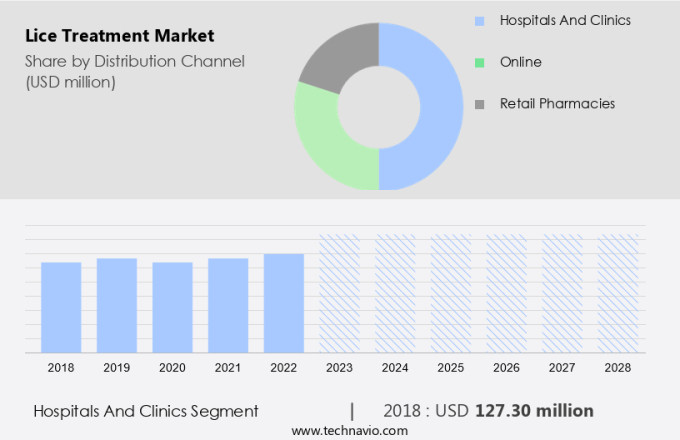
The Hospitals and clinics segment was valued at USD 132.90 million in 2019 and showed a gradual increase during the forecast period.
The Lice Treatment Market is experiencing steady growth due to rising demand for effective and natural remedies. Key products such as lice shampoos remain the most widely used solutions, offering quick relief and ease of application. Natural alternatives like lavender oil are gaining popularity for their gentle yet effective properties, particularly among health-conscious consumers. The availability of over-the-counter (OTC) treatments has made lice management more accessible, eliminating the need for prescriptions and promoting self-care. Innovative product packaging is also playing a pivotal role, with brands emphasizing user-friendly designs and clear instructions to enhance customer satisfaction. In addition, there is a growing concern for the use of eco-friendly personal items, such as hats, in preventing lice infestations in schools and other childcare facilities.
Regional Analysis
North America is estimated to contribute 33% to the growth of the global market during the forecast period. Technavio's analysts have elaborately explained the regional trends and drivers that shape the market during the forecast period.

The market in North America remains significant due to the high prevalence of head lice among children and advanced healthcare infrastructure. According to the Centers for Disease Control and Prevention (CDC), approximately 6-12 million lice infestations occur annually in the US among children aged 3-11. Public health initiatives, such as awareness campaigns and school-based screening programs, have led to early detection and intervention. The market is witnessing a shift towards non-toxic and pesticide-free treatments, driven by consumer preferences for safer alternatives. Over-the-counter and prescription treatments cater to the demand for accessible lice management solutions. Innovations in topical treatments, essential oils like lavender and rosemary, and combination therapies have expanded the product offerings.
Industry regulations ensure safety standards, while pricing strategies cater to various consumer segments. Despite the psychological impact of lice infestations, customer loyalty is fostered through effective product marketing and brand reputation. Public awareness and consumer education continue to influence market trends, with a growing emphasis on scalp hygiene and lice control. Lice eggs, repellents, combs, and sprays are essential components of the market, along with medicated shampoos, conditioners, and natural remedies. Clinical trials and product labeling ensure transparency and product efficacy. The market for lice treatments is dynamic, with ongoing research and development in chemical and non-chemical treatments. Sports activities and sleepovers can increase the risk of lice infestations, leading to a higher demand for accessible and affordable OTC lice treatment products.
Market Dynamics
Our researchers analyzed the data with 2024 as the base year, along with the key drivers, trends, and challenges. A holistic analysis of drivers will help companies refine their marketing strategies to gain a competitive advantage.
What are the Lice Treatment market drivers leading to the rise in the adoption of Industry?
- The rising prevalence of lice infestations serves as the primary market driver. Head lice infestations continue to pose a significant public health issue, particularly among school-aged children. Symptoms range from mild itching to severe dermatological reactions, including allergic responses and secondary infections. These complications can disrupt sleep, concentration, and lead to social stigma and absenteeism. To address this concern, the market is witnessing increased demand. Early detection and treatment, coupled with hygiene education, are crucial in preventing lice infestations.
- Industry regulations ensure the safety and efficacy of prescription treatments. The market's growth is driven by the rising awareness of lice infestations and the need for effective and safe treatment options. Consumers' preference for non-chemical treatments and consumer education initiatives will further fuel market expansion during the forecast period. Consumers are increasingly seeking combination treatments, natural remedies, and non-chemical alternatives, such as scalp hygiene, lice repellents, and lice combs.
What are the Lice Treatment market trends shaping the Industry?
- The increasing population of children represents a significant market trend. This demographic cohort presents numerous opportunities for businesses, particularly in sectors such as education, healthcare, and consumer goods. Head lice infestations remain a significant health concern, particularly among children, due to their close interactions and limited hygiene awareness. A systematic review published in BMC Public Health revealed that the prevalence of head lice among primary school children in low- and middle-income countries remains high. Factors such as female gender, previous infestation history, and larger family size increase susceptibility. Children from nomadic communities are particularly vulnerable due to inadequate hygiene facilities and limited awareness. Effective lice removal and prevention are essential to mitigate the psychological impact of infestations and prevent the spread of this infectious disease.
- Neem oil and rosemary oil are popular essential oils used in lice sprays for their efficacy. Product marketing and packaging play a crucial role in customer satisfaction and ensuring product efficacy. Physical treatments, such as manual nit-picking, remain the most common method for lice removal. However, the use of lice sprays and essential oils has gained popularity due to their ease of use and effectiveness. Hair care practices, such as regular washing and avoiding head-to-head contact, can help prevent infestations. Public health interventions and education programs are necessary to reduce transmission and improve treatment outcomes. These efforts should focus on increasing awareness of personal hygiene practices and providing access to effective lice removal and prevention products.
How does Lice Treatment market face challenges during its growth?
- The escalating costs of healthcare represent a significant challenge that hinders the industry's growth trajectory. Lice infestations pose a common health concern, affecting individuals across developed and developing regions. In the US and Europe, high healthcare costs act as a significant barrier to accessing professional lice treatment services, leading many families to opt for over-the-counter (OTC) products or home remedies. Tea tree oil, medicated shampoos, and lice conditioners are popular choices due to their availability and affordability. However, safety standards and product labeling are crucial considerations for consumers. Clinical trials and research are essential to ensure the efficacy and safety of chemical treatments.
- In developing nations like India, Brazil, and Indonesia, limited healthcare infrastructure and funding further restrict access to professional treatment, making OTC treatments and home remedies the preferred options. Pricing strategies play a vital role in increasing brand awareness and market penetration. Brands must prioritize safety, efficacy, and affordability to cater to diverse consumer needs. By addressing the root causes of head lice infestations, we can help protect children and improve their overall health and wellbeing.
Exclusive Customer Landscape
The lice treatment market forecasting report includes the adoption lifecycle of the market, covering from the innovator's stage to the laggard's stage. It focuses on adoption rates in different regions based on penetration. Furthermore, the lice treatment market report also includes key purchase criteria and drivers of price sensitivity to help companies evaluate and develop their market growth analysis strategies.
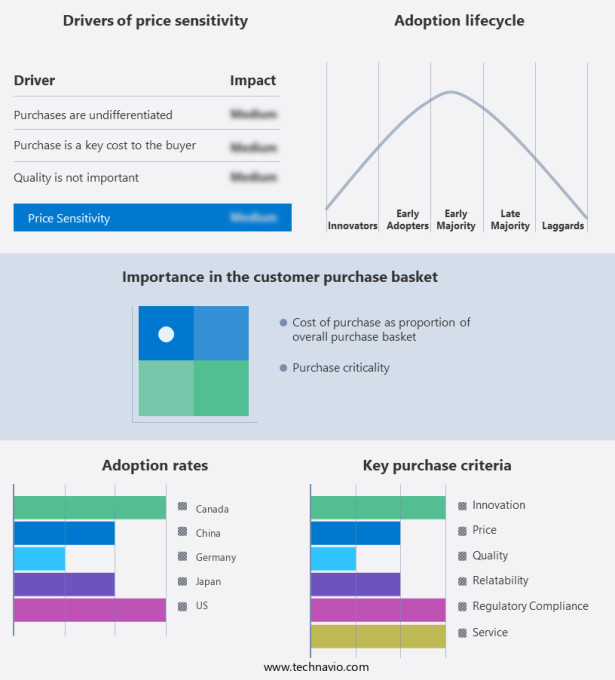
Customer Landscape
Key Companies & Market Insights
Companies are implementing various strategies, such as strategic alliances, lice treatment market forecast, partnerships, mergers and acquisitions, geographical expansion, and product/service launches, to enhance their presence in the industry.
Alliance Pharma PLC - This company specializes in providing lice treatment services, including Kelo-cote, Nizoral, and Amberen, for treating various conditions such as lice infestations and hormonal imbalances.
The industry research and growth report includes detailed analyses of the competitive landscape of the market and information about key companies, including:
- Alliance Pharma PLC
- American Vanguard Corp.
- Arbor Pharmaceuticals LLC
- Bayer AG
- Elanco Animal Health Inc.
- Fleming Medical Ltd.
- Johnson and Johnson Services Inc.
- Logic Product Group LLC
- Marico Ltd.
- Merck and Co. Inc.
- Nix Pharma Pvt. Ltd.
- ParaPRO LLC
- Perrigo Co. Plc
- Prestige Consumer Healthcare Inc.
- SHIONOGI Co. Ltd.
- TecLabs Inc.
- Teva Pharmaceutical Industries Ltd.
- Thornton and Ross
Qualitative and quantitative analysis of companies has been conducted to help clients understand the wider business environment as well as the strengths and weaknesses of key industry players. Data is qualitatively analyzed to categorize companies as pure play, category-focused, industry-focused, and diversified; it is quantitatively analyzed to categorize companies as dominant, leading, strong, tentative, and weak.
Recent Development and News in Lice Treatment Market
- In January 2024, Pfizer Consumer Healthcare announced the FDA approval of its over-the-counter (OTC) lice treatment product, Rid Sensitive Skin, which is free of common irritants and fragrances, addressing the growing demand for gentle lice treatment solutions (Pfizer Press Release).
- In March 2024, Merck Animal Health and Virbac entered into a strategic partnership to co-develop and commercialize a new line of veterinary lice treatments, expanding their offerings in the animal health sector (Merck Animal Health Press Release).
- In May 2024, Stryker Medical acquired the lice treatment business of Sunevia, a leading player in the professional market, bolstering its position in the sector and gaining access to Sunevia's innovative product portfolio (Stryker Press Release).
- In April 2025, the European Commission approved the marketing authorization for LiceAid's new lice treatment product, Prontospray, which utilizes a unique, plant-based formula, marking a significant technological advancement in the market (LiceAid Press Release).
Research Analyst Overview
The market continues to evolve, driven by the persistent challenge of managing lice infestations across various sectors. From body lice to head lice and pubic lice, the market responds to the ongoing unfolding of market dynamics. Lice prevention remains a priority, with topical treatments, lice sprays, and neem oil gaining popularity as natural remedies. However, the psychological impact of lice infestations persists, fueling demand for effective solutions. Product marketing and customer satisfaction are key considerations, with brand reputation and awareness playing a significant role in consumer decision-making. Oral treatments, lice lotions, and medicated shampoos are among the offerings, each with unique product efficacy and side effects.
The cost of treatment, safety standards, and pricing strategies also shape market activities. Public health and school health remain critical sectors, driving the need for effective lice control measures. Public awareness campaigns and consumer education initiatives continue to influence market trends. The environmental impact of chemical treatments and the rise of non-chemical treatments, such as essential oils like lavender and rosemary, further complicate the landscape. Regulations and industry standards shape the market, with a focus on product labeling, clinical trials, and product distribution. Combination treatments and lice repellents are emerging as viable options, while lice combs and prescription treatments cater to specific customer needs. The evolving nature of the market ensures a dynamic and complex business environment.
The Lice Treatment Market is expanding rapidly with growing awareness around head lice detection and accurate lice infestation diagnosis. Consumers now seek solutions that ensure optimal lice treatment duration and appropriate lice treatment frequency for maximum lice treatment effectiveness. Emphasis on lice treatment safety and managing lice treatment cost has driven innovation toward more accessible and efficient remedies. Enhanced lice treatment accessibility and improved lice treatment compliance support wider reach across populations. Preventive care has also evolved, with targeted lice prevention strategies and reliable lice prevention products. Modern lice control methods, including advanced lice removal techniques and user-friendly lice removal tools, bolster efforts in lice infestation control, lice infestation treatment, and full lice infestation eradication, supported by ongoing lice infestation monitoring and lice infestation surveillance.
Dive into Technavio's robust research methodology, blending expert interviews, extensive data synthesis, and validated models for unparalleled Lice Treatment Market insights. See full methodology.
|
Market Scope |
|
|
Report Coverage |
Details |
|
Page number |
202 |
|
Base year |
2024 |
|
Historic period |
2019-2023 |
|
Forecast period |
2025-2029 |
|
Growth momentum & CAGR |
Accelerate at a CAGR of 5.8% |
|
Market growth 2025-2029 |
USD 124.6 million |
|
Market structure |
Fragmented |
|
YoY growth 2024-2025(%) |
5.5 |
|
Key countries |
US, China, UK, Germany, France, India, Canada, Japan, Brazil, and Italy |
|
Competitive landscape |
Leading Companies, Market Positioning of Companies, Competitive Strategies, and Industry Risks |
What are the Key Data Covered in this Lice Treatment Market Research and Growth Report?
- CAGR of the Lice Treatment industry during the forecast period
- Detailed information on factors that will drive the growth and forecasting between 2025 and 2029
- Precise estimation of the size of the market and its contribution of the industry in focus to the parent market
- Accurate predictions about upcoming growth and trends and changes in consumer behaviour
- Growth of the market across North America, Europe, Asia, and Rest of World (ROW)
- Thorough analysis of the market's competitive landscape and detailed information about companies
- Comprehensive analysis of factors that will challenge the lice treatment market growth of industry companies
We can help! Our analysts can customize this lice treatment market research report to meet your requirements.