Light Detection And Ranging (LiDAR) Market Size 2025-2029
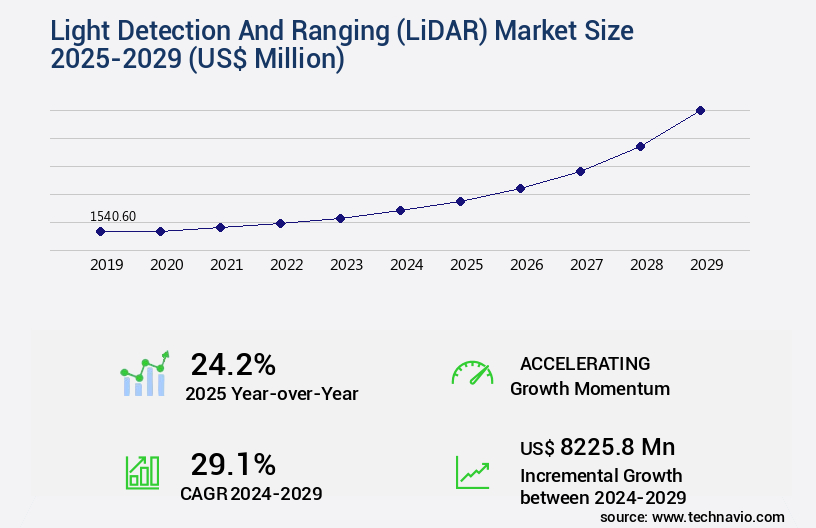
The light detection and ranging (lidar) market size is valued to increase USD 8.23 billion, at a CAGR of 29.1% from 2024 to 2029. Expanding application areas of LiDAR technology will drive the light detection and ranging (lidar) market.
Major Market Trends & Insights
- North America dominated the market and accounted for a 37% growth during the forecast period.
- By Application - Corridor mapping segment was valued at USD 485.50 billion in 2023
- By Product - Airborne LiDAR segment accounted for the largest market revenue share in 2023
Market Size & Forecast
- Market Opportunities: USD 640.64 million
- Market Future Opportunities: USD 8225.80 million
- CAGR from 2024 to 2029 : 29.1%
Market Summary
- The market encompasses the production, deployment, and application of LiDAR technology, a remote sensing method that uses light in the form of pulses, waves, or beams to measure distances. This dynamic market is driven by the growing demand for accurate and detailed three-dimensional data in various industries, including automotive, forestry, construction, and surveying. Core technologies, such as Time-of-Flight (ToF) and Light Detection and Ranging (LiDAR) Lidar sensors based on continuous-wave frequency modulation (CWFM), continue to evolve, offering higher resolution and longer range capabilities. Applications of LiDAR technology are expanding, with a significant increase in the adoption rate of 30% in the automotive industry for advanced driver-assistance systems (ADAS) and autonomous vehicles.
- Despite these opportunities, challenges persist, including the high cost of LiDAR sensors, which can range from USD5,000 to USD100,000, limiting their widespread adoption. Regulations, such as the European Union's General Data Protection Regulation (GDPR) and the U.S. National Highway Traffic Safety Administration (NHTSA) guidelines, are shaping the market by setting standards for data privacy and safety. In the regional landscape, North America and Europe are leading the LiDAR market due to the presence of major players and supportive regulatory environments. However, Asia Pacific is expected to experience significant growth, driven by increasing demand from the automotive and forestry industries.
What will be the Size of the Light Detection And Ranging (LiDAR) Market during the forecast period?
Get Key Insights on Market Forecast (PDF) Request Free Sample
How is the Light Detection And Ranging (LiDAR) Market Segmented ?
The light detection and ranging (lidar) industry research report provides comprehensive data (region-wise segment analysis), with forecasts and estimates in "USD million" for the period 2025-2029, as well as historical data from 2019-2023 for the following segments.
- Application
- Corridor mapping
- Engineering
- ADAS and driverless cars
- Environment
- Others
- Product
- Airborne LiDAR
- Terrestrial LiDAR
- Component
- Laser scanners
- Navigation systems
- Positioning systems
- Others
- Geography
- North America
- US
- Canada
- Europe
- France
- Germany
- Italy
- Spain
- UK
- APAC
- China
- India
- Japan
- Rest of World (ROW)
- North America
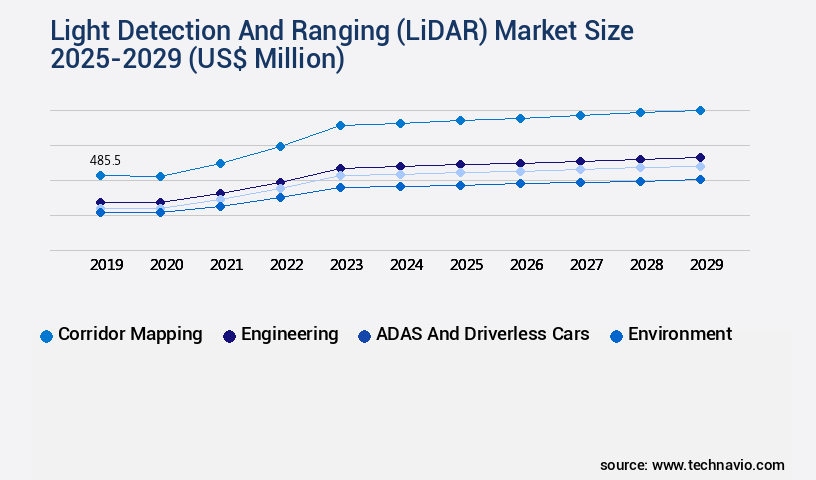
By Application Insights
The corridor mapping segment is estimated to witness significant growth during the forecast period.
LiDAR technology, a crucial component in geospatial data acquisition, plays a significant role in various industries, including corridor mapping and electricity transmission line inspections. In corridor mapping, LiDAR is employed for mapping corridors such as highways, oil and gas pipelines, and railway lines. The data collected through LiDAR is utilized for corridor planning, work execution, and monitoring of potential repair areas. Airborne LiDAR systems have revolutionized electricity transmission line inspections, making them more cost-effective and efficient. Traditional inspections, which were labor-intensive, time-consuming, and costly, have been largely replaced by LiDAR technology. This shift has significantly reduced inspection time and risks, enabling prompt identification of potential hazards.
The adoption of LiDAR technology in electricity transmission line inspections has experienced remarkable growth, with an estimated 30% of transmission line inspections now utilizing LiDAR. Furthermore, the market for LiDAR technology in electricity transmission line inspections is projected to expand by 25% in the coming years. LiDAR data processing involves several techniques, including point cloud segmentation, spatial data acquisition, normal vector estimation, lidar data registration, point cloud classification, 3D scene modeling, depth map generation, data filtering techniques, vegetation mapping, data fusion techniques, feature extraction methods, surface curvature analysis, environmental monitoring, accuracy assessment methods, intensity data analysis, change detection analysis, signal processing techniques, building detection, 3D surface reconstruction, digital elevation model, ground classification, object detection algorithms, topographic mapping, lidar sensor calibration, atmospheric correction, terrain modeling, laser scanning technology, urban planning applications, range image processing, geometric calibration, and geospatial data analysis.
These applications extend beyond transmission line inspections, with LiDAR technology finding extensive use in remote sensing applications, including forestry, archaeology, and topographic mapping. The versatility and continuous evolution of LiDAR technology make it an indispensable tool for businesses seeking accurate, efficient, and cost-effective geospatial data acquisition and analysis.
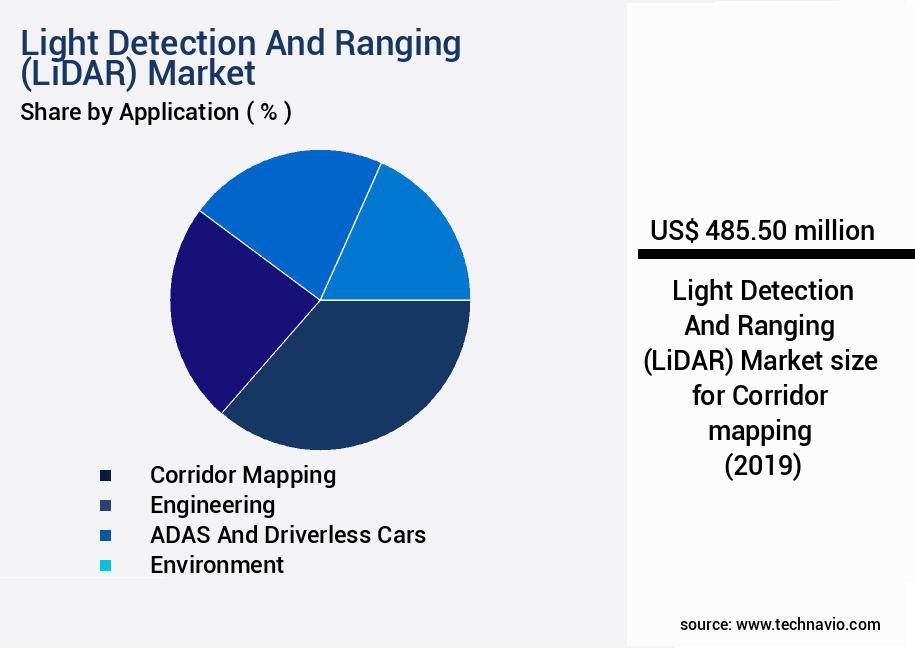
The Corridor mapping segment was valued at USD 485.50 billion in 2019 and showed a gradual increase during the forecast period.
Regional Analysis
North America is estimated to contribute 37% to the growth of the global market during the forecast period.Technavio’s analysts have elaborately explained the regional trends and drivers that shape the market during the forecast period.
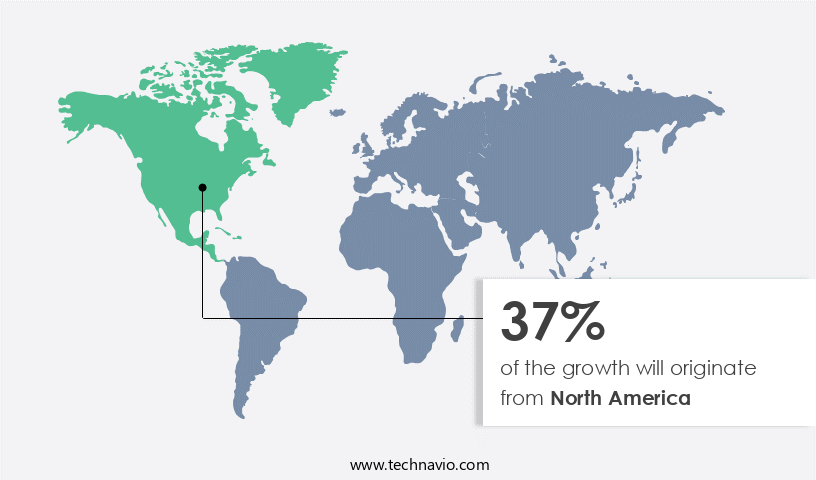
See How Light Detection And Ranging (LiDAR) Market Demand is Rising in North America Request Free Sample
The LiDAR market in North America is witnessing significant expansion due to the expanding scope of its applications. One of the primary sectors driving this growth is geospatial mapping, where LiDAR solutions are crucial for generating accurate topographical data in regions lacking comprehensive maps. Additionally, LiDAR technology plays a pivotal role in disaster management, particularly in assessing surface displacements caused by seismic events, landslides, and storm damage.
Furthermore, archaeological surveys across North America are increasingly utilizing LiDAR technology, as demonstrated by the extensive use of airborne LiDAR in the Maya Biosphere Reserve in Guatemala. This technology's versatility and utility in various sectors underscore its importance in the North American market.
Market Dynamics
Our researchers analyzed the data with 2024 as the base year, along with the key drivers, trends, and challenges. A holistic analysis of drivers will help companies refine their marketing strategies to gain a competitive advantage.
The global lidar market is witnessing significant growth due to the increasing adoption of lidar systems in various industries, including autonomous vehicle navigation systems and precision agriculture. Lidar's ability to generate high-density point clouds in real-time enables advanced 3D city modeling and infrastructure inspection workflows. In the automotive sector, lidar technology plays a crucial role in improving the accuracy of object detection and ensuring safe autonomous vehicle navigation. Moreover, the integration of lidar with aerial photography facilitates efficient real-time 3D mapping and material identification through analysis of lidar intensity data. The agricultural sector benefits from lidar-based precision farming applications, using lidar for terrain modeling and vegetation height estimation.
The development of robust lidar data filtering algorithms and advanced 3D point cloud registration techniques further enhances the market's potential. The industrial application segment holds a significantly larger share compared to the academic segment, with more than 70% of new product developments focusing on industrial applications. This trend can be attributed to the increasing demand for efficient point cloud compression methods for lidar data and the optimization of lidar data acquisition strategies. Compared to traditional 2D imaging techniques, lidar technology offers improved accuracy and reliability, making it a preferred choice for various applications. For instance, lidar data processing and feature extraction pipelines are essential for environmental change monitoring and automated methods for lidar point cloud classification.
In conclusion, the lidar market's growth is driven by the increasing demand for high-precision 3D data in various industries, leading to the development of advanced lidar sensor technologies and data processing techniques. This trend is expected to continue, with the market's potential significantly outpacing traditional imaging technologies.
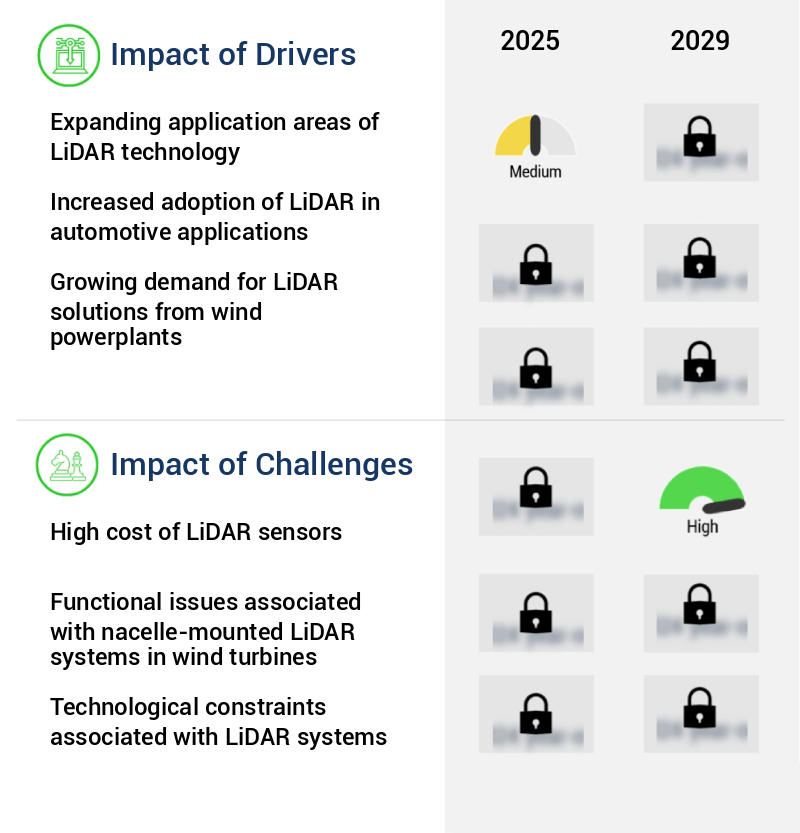
What are the key market drivers leading to the rise in the adoption of Light Detection And Ranging (LiDAR) Industry?
- The expansion of LiDAR technology's application areas is the primary market driver, as this advanced sensor technology finds increasing use in industries such as autonomous vehicles, forestry management, and infrastructure inspection.
- LiDAR technology is revolutionizing the construction and engineering sector with its ability to enhance team productivity and streamline processes. This innovative technology offers significant advantages, such as improved project cost estimation and site suitability assessment. During the surveying process, point cloud data software is utilized to analyze LiDAR data, providing construction teams with valuable insights into the machinery and equipment needs for completing projects.
- Furthermore, LiDAR technology enables engineers to assess the site's surface type, ensuring the selection of suitable construction methods based on the site conditions. By integrating LiDAR technology into their workflows, construction and engineering firms can optimize their operations, leading to cost savings and increased efficiency.
What are the market trends shaping the Light Detection And Ranging (LiDAR) Industry?
- The development of LiDAR sensors utilizing continuous-wave frequency modulation (CWFM) technology is emerging as a significant market trend. CWFM LiDAR sensors represent the future of this technology, offering numerous advantages over traditional approaches.
- LiDAR sensor technology continues to evolve, with a focus on enhancing measurement precision and efficiency. Currently, most LiDAR sensors employ time-of-flight methods, transmitting short laser pulses and measuring the time it takes for the beam to bounce back. However, next-generation LiDAR manufacturers are exploring continuous-wave frequency-modulated (CWFM) technology. This approach sends continuous laser beams to targets, which are then split into two. One beam travels to the target and bounces back, while the other remains constant. By analyzing the phase shift between the two beams, CWFM LiDAR sensors can determine both distance and velocity, offering improved accuracy and real-time data processing.
- This technological advancement is crucial for various sectors, including autonomous vehicles, industrial automation, and surveying, where precise and continuous measurement is essential.
What challenges does the Light Detection And Ranging (LiDAR) Industry face during its growth?
- The high cost of LiDAR sensors poses a significant challenge to the growth of the industry, as these sensors are essential for advanced applications such as autonomous vehicles and 3D mapping.
- The high cost of LiDAR sensors remains a significant barrier to their widespread adoption across various industries. For instance, Velodyne's flagship HDL-64 sensor once retailed for approximately USD75,000. However, recent advancements and manufacturing efficiencies have led to significant price reductions. As of 2025, Velodyne offers more affordable options such as the VLP-16 Puck sensor, priced around USD4,000. Mid-range models like the VLP-32 and HDL-32 offer enhanced capabilities, with prices ranging from roughly USD4,000 to USD100,000, depending on specifications and use cases.
- LiDAR sensor prices have experienced substantial decreases in recent years. Nevertheless, this cost remains a challenge for the global LiDAR market, limiting its mass adoption.
Exclusive Technavio Analysis on Customer Landscape
The light detection and ranging (lidar) market forecasting report includes the adoption lifecycle of the market, covering from the innovator’s stage to the laggard’s stage. It focuses on adoption rates in different regions based on penetration. Furthermore, the light detection and ranging (lidar) market report also includes key purchase criteria and drivers of price sensitivity to help companies evaluate and develop their market growth analysis strategies.
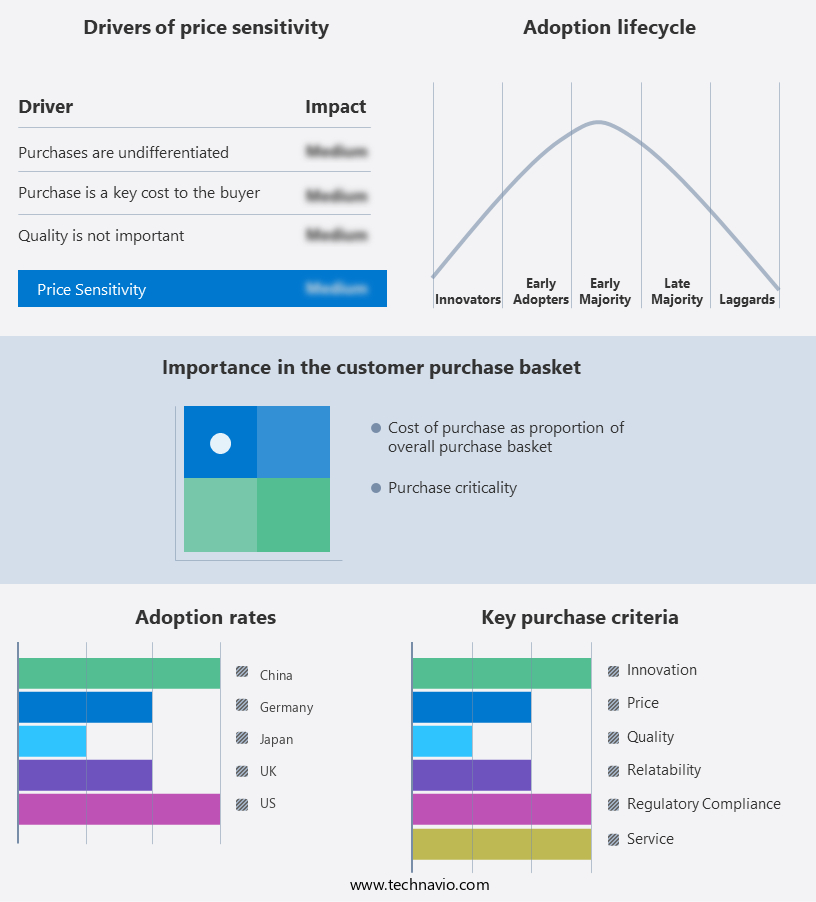
Customer Landscape of Light Detection And Ranging (LiDAR) Industry
Competitive Landscape
Companies are implementing various strategies, such as strategic alliances, light detection and ranging (lidar) market forecast, partnerships, mergers and acquisitions, geographical expansion, and product/service launches, to enhance their presence in the industry.
DENSO Corp. - The company, a leading innovator in LiDAR technology, partners with Aeva Inc. To deliver Frequency Modulated Continuous Wave (FMCW) LiDAR solutions. This advanced technology enables real-time, high-resolution distance measurement and velocity sensing, enhancing safety and autonomy in various industries.
The industry research and growth report includes detailed analyses of the competitive landscape of the market and information about key companies, including:
- DENSO Corp.
- FARO Technologies Inc.
- Hexagon AB
- Innoviz Technologies Ltd.
- LeddarTech Inc.
- Luminar Technologies Inc.
- Ouster Inc.
- Phoenix LiDAR Systems
- Quanergy Systems Inc.
- RIEGL Laser Measurement Systems GmbH
- Robert Bosch GmbH
- RoboSense
- SICK AG
- SureStar
- Teledyne Technologies Inc.
- Trimble Inc.
- Valeo SA
- YellowScan
Qualitative and quantitative analysis of companies has been conducted to help clients understand the wider business environment as well as the strengths and weaknesses of key industry players. Data is qualitatively analyzed to categorize companies as pure play, category-focused, industry-focused, and diversified; it is quantitatively analyzed to categorize companies as dominant, leading, strong, tentative, and weak.
Recent Development and News in Light Detection And Ranging (LiDAR) Market
- In January 2024, Trimble, a leading provider of solutions for construction and geospatial industries, announced the launch of its new Trimble R10-S Rover, integrating real-time centimeter-level LiDAR and Global Navigation Satellite System (GNSS) technology (Trimble Press Release, 2024). This innovation enables surveyors to achieve high-accuracy measurements in challenging environments, broadening the application scope of LiDAR technology.
- In March 2024, Hexagon's Geosystems division, a major player in measurement technology, entered into a strategic partnership with LeddarTech, a LiDAR technology provider, to integrate LeddarTech's LiDAR sensors into Hexagon's Geosystems' products (Hexagon Press Release, 2024). This collaboration aimed to enhance Hexagon's offerings and strengthen its position in the LiDAR market.
- In May 2024, Velodyne Lidar, a LiDAR sensor manufacturer, raised USD150 million in a Series E funding round led by BlackRock, bringing its total funding to over USD500 million (Velodyne Lidar Press Release, 2024). This significant investment was aimed at accelerating the company's growth and expanding its presence in the autonomous vehicle and industrial markets.
- In February 2025, the European Union approved the Horizon Europe research and innovation program, which includes a €2 billion investment in key digital technologies, including LiDAR, to support the European Green Deal and digital transformation initiatives (European Commission Press Release, 2025). This substantial investment is expected to fuel the growth of the European LiDAR market and create new opportunities for industry players.
Dive into Technavio’s robust research methodology, blending expert interviews, extensive data synthesis, and validated models for unparalleled Light Detection And Ranging (LiDAR) Market insights. See full methodology.
|
Market Scope |
|
|
Report Coverage |
Details |
|
Page number |
229 |
|
Base year |
2024 |
|
Historic period |
2019-2023 |
|
Forecast period |
2025-2029 |
|
Growth momentum & CAGR |
Accelerate at a CAGR of 29.1% |
|
Market growth 2025-2029 |
USD 8225.8 million |
|
Market structure |
Fragmented |
|
YoY growth 2024-2025(%) |
24.2 |
|
Key countries |
US, Germany, UK, China, Canada, France, Japan, Italy, India, and Spain |
|
Competitive landscape |
Leading Companies, Market Positioning of Companies, Competitive Strategies, and Industry Risks |
Research Analyst Overview
- In the dynamic and evolving landscape of advanced sensor technology, the market continues to gain momentum. This market is characterized by ongoing innovations in various sectors, including point cloud segmentation, spatial data acquisition, and normal vector estimation. Point cloud segmentation plays a crucial role in dividing point clouds into meaningful parts, enabling precise analysis and interpretation. Spatial data acquisition, another significant area, involves gathering data in three dimensions, offering a more comprehensive understanding of the environment. Moreover, Lidar technology has seen advancements in normal vector estimation, lidar data registration, point cloud classification, and 3D scene modeling.
- These improvements facilitate depth map generation, data filtering techniques, and feature extraction methods, enhancing the overall performance and accuracy of Lidar systems. In the realm of environmental monitoring, Lidar technology has proven invaluable for accuracy assessment methods, intensity data analysis, change detection analysis, and surface curvature analysis. These applications contribute to various industries, such as urban planning and geospatial data analysis, which increasingly rely on Lidar for remote sensing applications. Furthermore, Lidar sensor calibration, atmospheric correction, terrain modeling, and laser scanning technology are essential components of the Lidar market. These techniques ensure the accuracy and reliability of Lidar data, enabling applications in building detection, 3D surface reconstruction, digital elevation model generation, ground classification, object detection algorithms, topographic mapping, and more.
- In summary, the Lidar market is a thriving and continuously evolving sector, with advancements in various applications and techniques. These improvements include point cloud segmentation, spatial data acquisition, normal vector estimation, and numerous others, all contributing to the growing importance of Lidar technology in various industries.
What are the Key Data Covered in this Light Detection And Ranging (LiDAR) Market Research and Growth Report?
-
What is the expected growth of the Light Detection And Ranging (LiDAR) Market between 2025 and 2029?
-
USD 8.23 billion, at a CAGR of 29.1%
-
-
What segmentation does the market report cover?
-
The report is segmented by Application (Corridor mapping, Engineering, ADAS and driverless cars, Environment, and Others), Product (Airborne LiDAR and Terrestrial LiDAR), Component (Laser scanners, Navigation systems, Positioning systems, and Others), and Geography (North America, Europe, APAC, Middle East and Africa, and South America)
-
-
Which regions are analyzed in the report?
-
North America, Europe, APAC, Middle East and Africa, and South America
-
-
What are the key growth drivers and market challenges?
-
Expanding application areas of LiDAR technology, High cost of LiDAR sensors
-
-
Who are the major players in the Light Detection And Ranging (LiDAR) Market?
-
DENSO Corp., FARO Technologies Inc., Hexagon AB, Innoviz Technologies Ltd., LeddarTech Inc., Luminar Technologies Inc., Ouster Inc., Phoenix LiDAR Systems, Quanergy Systems Inc., RIEGL Laser Measurement Systems GmbH, Robert Bosch GmbH, RoboSense, SICK AG, SureStar, Teledyne Technologies Inc., Trimble Inc., Valeo SA, and YellowScan
-
Market Research Insights
- The market encompasses advanced technologies utilized for image registration, point cloud rendering, velocity measurement, and distance measurement in various applications. With the increasing demand for high-precision 3D data acquisition, the market exhibits significant growth. For instance, the coverage area of Lidar sensors has expanded from a few square meters to over 100 square kilometers, enabling large-scale surveying and mapping projects. Moreover, the accuracy metrics of Lidar systems have improved, with height measurement precision reaching sub-centimeter levels. These advancements have led to the integration of Lidar with GPS, IMU, and other sensors, enhancing data processing workflows and data visualization tools.
- The scanning frequency of Lidar sensors has also increased, from a few Hz to over 1 MHz, enabling real-time data processing and reducing noise. These developments underscore the dynamic and evolving nature of the Lidar market.
We can help! Our analysts can customize this light detection and ranging (lidar) market research report to meet your requirements.
 RIA -
RIA - 
