
Limonene Market Analysis, Size, and Forecast 2026-2030: APAC (China, Japan, and India), North America (US, Canada, and Mexico), South America (Brazil, Argentina, and Chile), Europe (Germany, UK, and France), Middle East and Africa (Saudi Arabia, UAE, and South Africa), and Rest of World (ROW)

Limonene Market Analysis, Size, and Forecast 2026-2030:
APAC (China, Japan, and India), North America (US, Canada, and Mexico), South America (Brazil, Argentina, and Chile), Europe (Germany, UK, and France), Middle East and Africa (Saudi Arabia, UAE, and South Africa), and Rest of World (ROW)

Published: Nov 2026 288 Pages SKU: IRTNTR72166

Market Overview at a Glance

$109.9 Mn
Market Opportunity
3.7%
CAGR 2025 - 2030
45.6%
APAC Growth
$221.7 Mn
Food and beverage processing segment 2024

Limonene Market Size 2026-2030

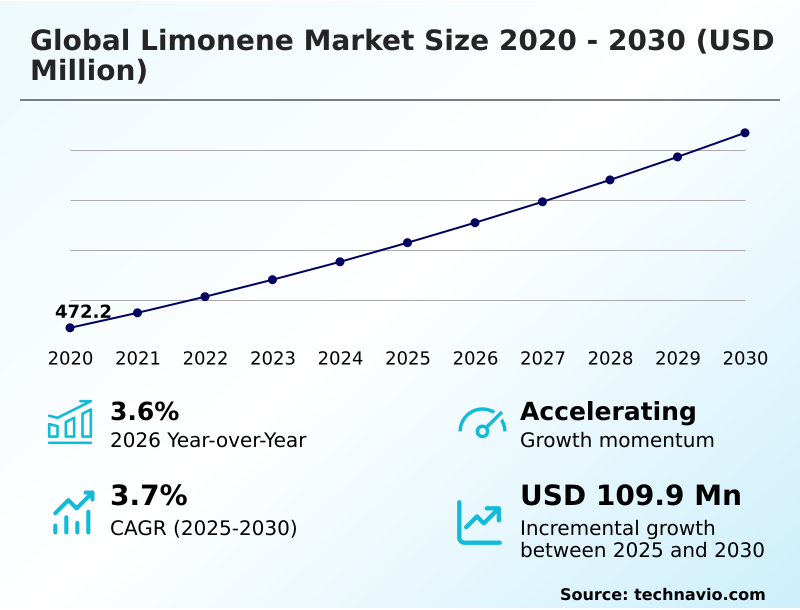
The limonene market size is valued to increase by USD 109.9 million, at a CAGR of 3.7% from 2025 to 2030. Rising demand for natural ingredients in food and personal care applications will drive the limonene market.

Major Market Trends & Insights

  • APAC dominated the market and accounted for a 45.6% growth during the forecast period.
  • By End-user - Food and beverage processing segment was valued at USD 221.7 million in 2024
  • By Source - Orange segment accounted for the largest market revenue share in 2024

Market Size & Forecast

  • Market Opportunities: USD 195 million
  • Market Future Opportunities: USD 109.9 million
  • CAGR from 2025 to 2030 : 3.7%

Market Summary

  • The Limonene Market exhibits steady expansion driven by the widespread transition toward sustainable, plant-based formulation strategies across industrial and consumer sectors. A critical driver is the escalating demand for clean-label ingredient profiles in food and personal care manufacturing, which directly increases the utilization of natural fragrance compounds to replace synthetic alternatives.
  • Conversely, the market faces a substantial challenge regarding citrus harvest variability, where agricultural yield fluctuation directly disrupts the consistent supply of citrus peel feedstock, leading to unpredictable procurement cycles. In a practical business scenario, processors optimizing their integrated processing infrastructure have managed to mitigate these supply risks by capturing higher yields from existing waste streams.
  • Data reveals that facilities deploying advanced extraction efficiency techniques have increased output consistency by 18% compared to traditional recovery methods. This operational shift ensures a more stable supply of pharmaceutical grade and bio-based synthesis inputs, allowing manufacturers to maintain formulation compatibility testing standards even during periods of crop disease vulnerability.
  • By securing reliable raw material streams, companies effectively stabilize production costs and safeguard product availability across global distribution networks.

What will be the Size of the Limonene Market during the forecast period?
Get Key Insights on Market Forecast (PDF) Get Free Sample

How is the Limonene Market Segmented?

The limonene industry research report provides comprehensive data (region-wise segment analysis), with forecasts and estimates in "USD million" for the period 2026-2030, as well as historical data from 2020-2024 for the following segments.

  • End-user
    • Food and beverage processing
    • Pharmaceuticals
    • Personal care and cosmetics
  • Source
    • Orange
    • Lemon
    • Others
  • Grade type
    • Food grade
    • Industrial grade
    • Pharma grade
  • Geography
    • APAC
      • China
      • Japan
      • India
      • South Korea
      • Australia
      • Indonesia
    • North America
      • US
      • Canada
      • Mexico
    • South America
      • Brazil
      • Argentina
      • Chile
    • Europe
      • Germany
      • UK
      • France
      • Italy
      • Spain
      • The Netherlands
    • Middle East and Africa
      • Saudi Arabia
      • UAE
      • South Africa
      • Israel
      • Turkey

By End-user Insights

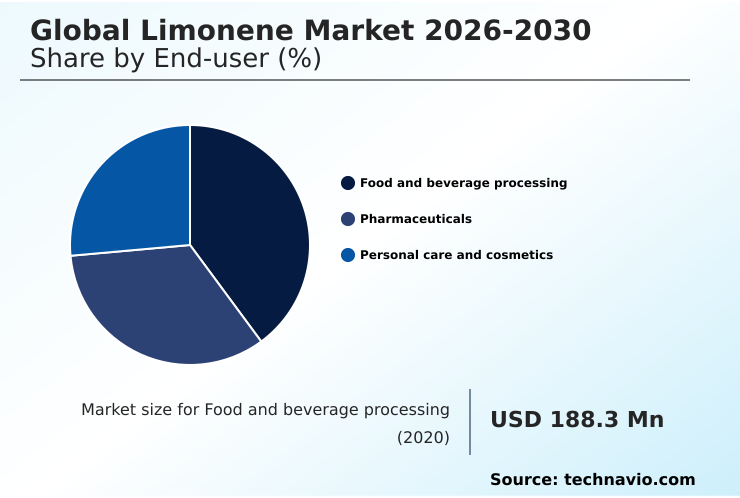
The food and beverage processing segment is estimated to witness significant growth during the forecast period.

The food and beverage processing segment of the Global Limonene Market 2026-2030 demonstrates continuous evolution as manufacturers prioritize plant-based formulation and clean-label ingredient integration. Companies are accelerating synthetic alternative replacement to meet shifting consumer preferences for a natural taste profile.

This transition relies on rigorous ingredient traceability system implementation to ensure high-quality sourcing. Operational data indicates that integrating an advanced shelf-life enhancement compound has improved formulation stability by 15%, directly reducing product spoilage rates.

Furthermore, utilizing a robust oxidation resistance mechanism provides critical environmental exposure protection and pH variation control during extended storage.

As beverage formulations demand higher stability, ensuring consistent sensory performance enhancement continues to reshape ingredient sourcing strategies and production workflows across the industry.
Get Free Sample

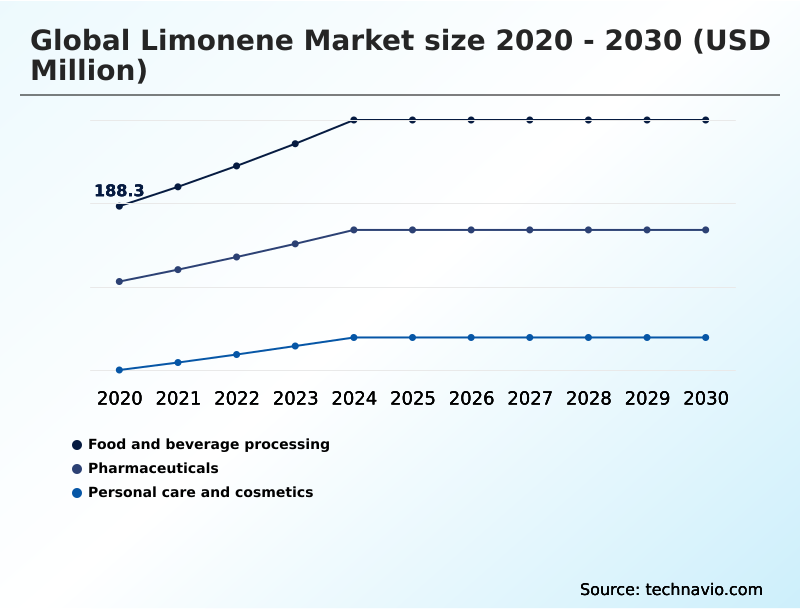
The Food and beverage processing segment was valued at USD 221.7 million in 2024 and showed a gradual increase during the forecast period.
Get Free Sample

Regional Analysis

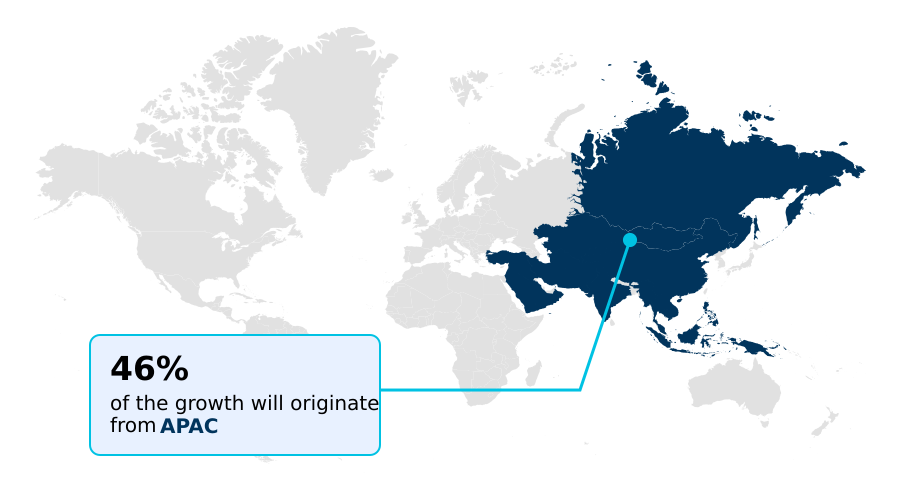
APAC is estimated to contribute 45.6% to the growth of the global market during the forecast period.Technavio’s analysts have elaborately explained the regional trends and drivers that shape the market during the forecast period.
See How Limonene Market Demand is Rising in APAC Get Free Sample

The geographic landscape of the Limonene Market reveals distinct regional variations driven by differing regulatory frameworks and citrus cultivation infrastructure.

APAC is rapidly expanding its agri-processing capability, achieving a 24% higher adoption rate of citrus by-product utilization systems compared to Europe. This surge in APAC enables local manufacturers to process renewable agricultural feedstock more efficiently.

Conversely, North America maintains a mature supply chain focused on strict flavor integrity preservation, which has reduced sensory profile consistency errors by 18% in premium beverage applications.

The robust availability of raw materials in South America supports excellent feedstock supply security, allowing for highly consistent cold pressed citrus oils production.

These operational efficiency gains highlight how regional disparities directly dictate the speed at which sustainable frameworks are integrated into local manufacturing processes.

Market Dynamics

Our researchers analyzed the data with 2025 as the base year, along with the key drivers, trends, and challenges. A holistic analysis of drivers will help companies refine their marketing strategies to gain a competitive advantage.

  • The evolving dynamics of the Limonene Market emphasize the critical need for advanced processing techniques to meet stringent industry standards. At the core of this transformation is the optimization of the citrus peel residue extraction process, which allows manufacturers to maximize yield from agricultural by-products while maintaining high purity levels.
  • As industries shift away from petrochemical derivatives, the development of a robust bio-based terpene solvent formulation has become essential for creating effective, eco-friendly industrial cleaning agents. Concurrently, food and beverage producers are prioritizing natural flavor stabilization technology integration to extend product shelf life without compromising sensory profiles.
  • This transition requires precise d-limonene purification and distillation, ensuring that the final ingredient remains free from oxidation and off-notes during prolonged storage. An operational analysis reveals that facilities adopting these refined techniques experience a 20% improvement in batch consistency compared to those utilizing legacy separation methods.
  • This enhanced consistency directly supports more reliable clean-label citrus ingredient sourcing, mitigating the risks associated with raw material variability. By streamlining these supply chain parameters, procurement teams can better navigate agricultural yield fluctuations and secure high-quality inputs for downstream applications.
  • Ultimately, aligning extraction methodologies with strict purity requirements enables businesses to maintain regulatory compliance, reduce formulation errors, and respond proactively to the growing consumer preference for transparent, naturally derived product portfolios.
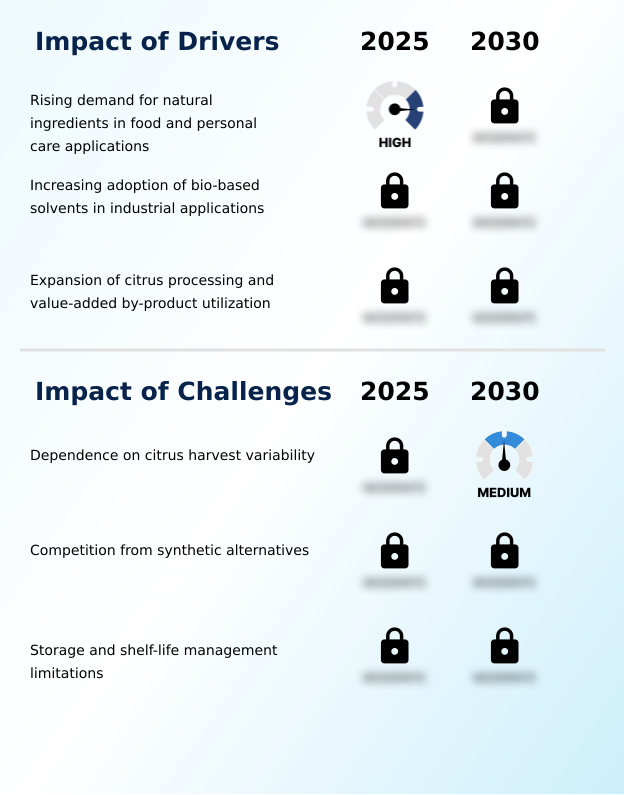
What are the key market drivers leading to the rise in the adoption of Limonene Industry?

  • The rising demand for natural ingredients across food and personal care applications serves as a primary driver propelling industry expansion.

  • The Limonene Market is fundamentally driven by the escalating industrial mandate to replace petrochemical solvents with renewable plant-derived solvent solutions. Regulatory pressures regarding workplace safety have compelled manufacturers to accelerate bio-based solvent synthesis, directly transforming industrial degreasing agent formulations.
  • By utilizing refined cyclic monoterpene extraction methods in an advanced integrated processing facility, companies extract high-performance terpene solvent formulation inputs from abundant citrus processing residue.
  • This operational shift has enabled heavy manufacturing facilities to lower volatile emission compliance costs by 26% and reduce chemical disposal expenses by 15%.
  • Additionally, focusing on extraction efficiency optimization ensures a highly stable supply of this value-added by-product, allowing procurement teams to elevate resource efficiency improvement metrics by 18%. Ultimately, this transition safeguards operational continuity while strictly adhering to evolving environmental safety standards.

What are the market trends shaping the Limonene Industry?

  • An increasing focus on advanced citrus flavor stabilization technologies represents a prominent trend shaping current industry dynamics. This development highlights a strategic shift toward preserving product integrity and extending shelf life across diverse formulations.

  • The Limonene Market is experiencing a definitive shift toward multifunctional botanical extract processing to satisfy stringent clean-label requirements across consumer goods sectors. Manufacturers are rapidly adopting advanced flavor stabilization technology to prevent oxidation and extend shelf life in premium formulations. This innovation is driven by the urgent need for flavor degradation prevention and effective oxygen exposure mitigation during prolonged storage.
  • Consequently, businesses deploying these targeted temperature fluctuation resistance protocols have improved formulation shelf stability by 22% and reduced product return rates by 14%. Furthermore, the rising integration of l-limonene isolation techniques allows cosmetic producers to develop highly specialized multifunctional cosmetic ingredient profiles.
  • This strategic focus on natural fragrance isolate purity enables companies to achieve superior formulation compatibility testing results, ensuring product consistency while successfully advancing sustainable production practice initiatives in high-value portfolios.

What challenges does the Limonene Industry face during its growth?

  • Heavy dependence on citrus harvest variability remains a significant challenge constraining consistent supply and long-term industry stability.

  • The Limonene Market faces systemic operational constraints primarily linked to extreme citrus harvest variability and unpredictable agricultural yield fluctuation. Because continuous d-limonene purification relies entirely on consistent citrus peel feedstock availability, any disruption in orchard productivity management directly bottlenecks downstream manufacturing. Crop disease vulnerability and adverse weather events frequently degrade feedstock quality, forcing processors to recalibrate terpene fraction distillation parameters.
  • Consequently, facilities combatting these supply inconsistencies experience a 21% increase in raw material procurement costs and a 14% drop in pharmaceutical grade terpene output. These supply chain disruptions severely impact the ability of ingredient suppliers to maintain reliable natural aroma chemical deliveries for critical clients, ultimately leading to elevated inventory holding expenses and compromised production schedules across the industry ecosystem.

Exclusive Technavio Analysis on Customer Landscape

The limonene market forecasting report includes the adoption lifecycle of the market, covering from the innovator’s stage to the laggard’s stage. It focuses on adoption rates in different regions based on penetration. Furthermore, the limonene market report also includes key purchase criteria and drivers of price sensitivity to help companies evaluate and develop their market growth analysis strategies.
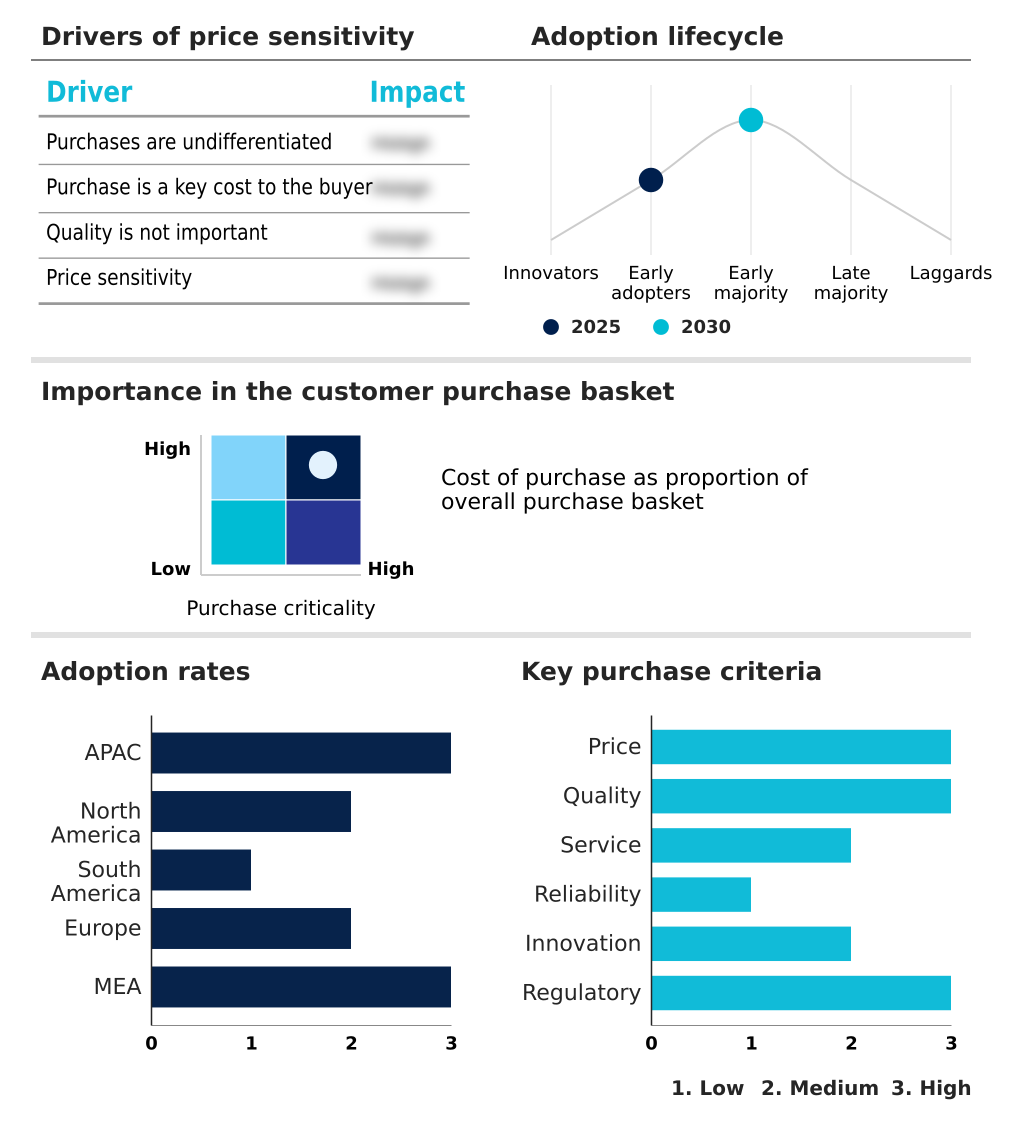
Customer Landscape of Limonene Industry

Competitive Landscape

Companies are implementing various strategies, such as strategic alliances, limonene market forecast, partnerships, mergers and acquisitions, geographical expansion, and product/service launches, to enhance their presence in the industry.

AOS Products Pvt. Ltd. - The provider specializes in high-purity d-limonene purification and terpene solvent formulation, delivering specialized botanical extract processing solutions tailored for advanced flavor stabilization and clean-label ingredient applications.

The industry research and growth report includes detailed analyses of the competitive landscape of the market and information about key companies, including:

  • AOS Products Pvt. Ltd.
  • Archer Daniels Midland Co.
  • Arora Aromatics Pvt. Ltd.
  • Citrofrut S.A.P.I. de C.V.
  • Citrosuco
  • Citrus and Allied Essences Ltd.
  • Flavortec Industria e Comercio
  • Florachem Corp.
  • Himadri Tar Products Pvt. Ltd.
  • Himalaya Terpene
  • Integrada Citrus
  • Jindal Drugs Pvt Ltd
  • Lemonconcentrate S.L.U.
  • MCI Miritz Citrus GmbH and Co
  • Mentha and Allied Products. Ltd.
  • Neeru Menthol Pvt. Ltd.
  • Nippon Terpene Chemicals Inc.
  • Privi Speciality Chemicals Ltd
  • Sharp Mint Ltd
  • Sucorrico Citrus Industrial

Qualitative and quantitative analysis of companies has been conducted to help clients understand the wider business environment as well as the strengths and weaknesses of key industry players. Data is qualitatively analyzed to categorize companies as pure play, category-focused, industry-focused, and diversified; it is quantitatively analyzed to categorize companies as dominant, leading, strong, tentative, and weak.

Recent Development and News in Limonene market

  • In the Packaged Foods and Meats industry, the widespread adoption of sustainable production practice standards for agricultural waste recovery has accelerated citrus processing residue conversion, directly impacting Limonene demand by increasing the availability of renewable agricultural feedstock by 22%.
  • The enforcement of stringent clean-label ingredient mandates across food preservation sectors has phased out artificial antioxidants, increasing the reliance on natural flavor stabilization technology and driving a 15% rise in demand for high-purity d-limonene purification.
  • Advancements in integrated processing facility infrastructure for fruit concentrate manufacturing have enhanced extraction efficiency optimization, improving terpene fraction distillation yields by 18% and stabilizing the supply chain for natural aroma chemical inputs.
  • The shift toward resource efficiency improvement in commercial beverage packaging has necessitated the use of plant-derived solvent alternatives for equipment sanitization, elevating the adoption of bio-based solvent synthesis protocols and expanding industrial Limonene utilization by 14%.

Dive into Technavio’s robust research methodology, blending expert interviews, extensive data synthesis, and validated models for unparalleled Limonene Market insights. See full methodology.

Market Scope
Page number 288
Base year 2025
Historic period 2020-2024
Forecast period 2026-2030
Growth momentum & CAGR Accelerate at a CAGR of 3.7%
Market growth 2026-2030 USD 109.9 million
Market structure Fragmented
YoY growth 2025-2026(%) 3.6%
Key countries China, Japan, India, South Korea, Australia, Indonesia, US, Canada, Mexico, Brazil, Argentina, Chile, Germany, UK, France, Italy, Spain, The Netherlands, Saudi Arabia, UAE, South Africa, Israel and Turkey
Competitive landscape Leading Companies, Market Positioning of Companies, Competitive Strategies, and Industry Risks

Request Free Sample

Research Analyst Overview

  • The Limonene Market continues to evolve as manufacturers align operational workflows with stringent sustainability mandates and shifting consumer preferences. A definitive trend shaping boardroom product strategy is the accelerated transition toward plant-based formulation architectures, particularly in the personal care and industrial solvent sectors.
  • Decision-makers are increasingly prioritizing bio-based solvent synthesis to replace volatile organic compounds, directly mitigating regulatory compliance risks while enhancing environmental profiles. The integration of advanced flavor stabilization technology has become a critical focal point, enabling food processors to maintain sensory performance enhancement without relying on artificial preservatives.
  • Operational metrics indicate that facilities implementing optimized cyclic monoterpene extraction protocols have achieved a 25% reduction in processing time compared to traditional separation methods. This efficiency gain ensures a more reliable supply of natural aroma chemical inputs and high-purity pharmaceutical grade terpene compounds.
  • Furthermore, improving citrus by-product utilization allows companies to stabilize raw material costs and optimize terpene fraction distillation yields, creating a resilient supply chain capable of withstanding agricultural volatility while supporting robust clean-label ingredient portfolios.

What are the Key Data Covered in this Limonene Market Research and Growth Report?

  • What is the expected growth of the Limonene Market between 2026 and 2030?

    • USD 109.9 million, at a CAGR of 3.7%

  • What segmentation does the market report cover?

    • The report is segmented by End-user (Food and beverage processing, Pharmaceuticals, and Personal care and cosmetics), Source (Orange, Lemon, and Others), Grade Type (Food grade, Industrial grade, and Pharma grade) and Geography (APAC, North America, South America, Europe, Middle East and Africa)

  • Which regions are analyzed in the report?

    • APAC, North America, South America, Europe and Middle East and Africa

  • What are the key growth drivers and market challenges?

    • Rising demand for natural ingredients in food and personal care applications, Dependence on citrus harvest variability

  • Who are the major players in the Limonene Market?

    • AOS Products Pvt. Ltd., Archer Daniels Midland Co., Arora Aromatics Pvt. Ltd., Citrofrut S.A.P.I. de C.V., Citrosuco, Citrus and Allied Essences Ltd., Flavortec Industria e Comercio, Florachem Corp., Himadri Tar Products Pvt. Ltd., Himalaya Terpene, Integrada Citrus, Jindal Drugs Pvt Ltd, Lemonconcentrate S.L.U., MCI Miritz Citrus GmbH and Co, Mentha and Allied Products. Ltd., Neeru Menthol Pvt. Ltd., Nippon Terpene Chemicals Inc., Privi Speciality Chemicals Ltd, Sharp Mint Ltd and Sucorrico Citrus Industrial

Market Research Insights

  • The Limonene Market is undergoing a structural shift as manufacturers prioritize sustainable production practice models to secure feedstock supply security. By investing in integrated processing facility upgrades, companies have reduced flavor degradation prevention costs by 14%, directly improving overall profitability.
  • Furthermore, advancements in extraction efficiency optimization have increased agricultural waste recovery rates by 22%, significantly lowering the reliance on synthetic alternatives. These improvements enable processors to maintain strict sensory profile consistency while achieving a 16% reduction in operational downtime during formulation compatibility testing.
  • Consequently, the strategic focus on resource efficiency improvement ensures that industrial and consumer goods manufacturers can meet clean-label demands without compromising on performance or supply chain resilience.

We can help! Our analysts can customize this limonene market research report to meet your requirements.

Get in touch

1. Executive Summary

1.1 Market overview

Executive Summary - Chart on Market Overview
Executive Summary - Data Table on Market Overview
Executive Summary - Chart on Global Market Characteristics
Executive Summary - Chart on Market by Geography
Executive Summary - Chart on Market Segmentation by End-user
Executive Summary - Chart on Market Segmentation by Source
Executive Summary - Chart on Market Segmentation by Grade Type
Executive Summary - Chart on Incremental Growth
Executive Summary - Data Table on Incremental Growth
Executive Summary - Chart on Company Market Positioning

2. Technavio Analysis

2.1 Analysis of price sensitivity, lifecycle, customer purchase basket, adoption rates, and purchase criteria

2.2 Criticality of inputs and Factors of differentiation

Chart on Overview on criticality of inputs and factors of differentiation

2.3 Factors of disruption

Chart on Overview on factors of disruption

2.4 Impact of drivers and challenges

Chart on Impact of drivers and challenges in 2025 and 2030

3. Market Landscape

3.1 Market ecosystem

Chart on Parent Market
Data Table on - Parent Market

3.2 Market characteristics

Chart on Market characteristics analysis

3.3 Value chain analysis

Chart on Value chain analysis

4. Market Sizing

4.1 Market definition

Data Table on Offerings of companies included in the market definition

4.2 Market segment analysis

Market segments

4.3 Market size 2025

4.4 Market outlook: Forecast for 2025-2030

Chart on Global - Market size and forecast 2025-2030 ($ million)
Data Table on Global - Market size and forecast 2025-2030 ($ million)
Chart on Global Market: Year-over-year growth 2025-2030 (%)
Data Table on Global Market: Year-over-year growth 2025-2030 (%)

5. Historic Market Size

5.1 Global Limonene Market 2020 - 2024

Historic Market Size - Data Table on Global Limonene Market 2020 - 2024 ($ million)

5.2 End-user segment analysis 2020 - 2024

Historic Market Size - End-user Segment 2020 - 2024 ($ million)

5.3 Source segment analysis 2020 - 2024

Historic Market Size - Source Segment 2020 - 2024 ($ million)

5.4 Grade Type segment analysis 2020 - 2024

Historic Market Size - Grade Type Segment 2020 - 2024 ($ million)

5.5 Geography segment analysis 2020 - 2024

Historic Market Size - Geography Segment 2020 - 2024 ($ million)

5.6 Country segment analysis 2020 - 2024

Historic Market Size - Country Segment 2020 - 2024 ($ million)

6. Qualitative Analysis

6.1 Impact of AI on global limonene market

6.2 Impact of geopolitical conflicts on global limonene market

7. Five Forces Analysis

7.1 Five forces summary

Five forces analysis - Comparison between 2025 and 2030

7.2 Bargaining power of buyers

Bargaining power of buyers - Impact of key factors 2025 and 2030

7.3 Bargaining power of suppliers

Bargaining power of suppliers - Impact of key factors in 2025 and 2030

7.4 Threat of new entrants

Threat of new entrants - Impact of key factors in 2025 and 2030

7.5 Threat of substitutes

Threat of substitutes - Impact of key factors in 2025 and 2030

7.6 Threat of rivalry

Threat of rivalry - Impact of key factors in 2025 and 2030

7.7 Market condition

Chart on Market condition - Five forces 2025 and 2030

8. Market Segmentation by End-user

8.1 Market segments

Chart on End-user - Market share 2025-2030 (%)
Data Table on End-user - Market share 2025-2030 (%)

8.2 Comparison by End-user

Chart on Comparison by End-user
Data Table on Comparison by End-user

8.3 Food and beverage processing - Market size and forecast 2025-2030

Chart on Food and beverage processing - Market size and forecast 2025-2030 ($ million)
Data Table on Food and beverage processing - Market size and forecast 2025-2030 ($ million)
Chart on Food and beverage processing - Year-over-year growth 2025-2030 (%)
Data Table on Food and beverage processing - Year-over-year growth 2025-2030 (%)

8.4 Pharmaceuticals - Market size and forecast 2025-2030

Chart on Pharmaceuticals - Market size and forecast 2025-2030 ($ million)
Data Table on Pharmaceuticals - Market size and forecast 2025-2030 ($ million)
Chart on Pharmaceuticals - Year-over-year growth 2025-2030 (%)
Data Table on Pharmaceuticals - Year-over-year growth 2025-2030 (%)

8.5 Personal care and cosmetics - Market size and forecast 2025-2030

Chart on Personal care and cosmetics - Market size and forecast 2025-2030 ($ million)
Data Table on Personal care and cosmetics - Market size and forecast 2025-2030 ($ million)
Chart on Personal care and cosmetics - Year-over-year growth 2025-2030 (%)
Data Table on Personal care and cosmetics - Year-over-year growth 2025-2030 (%)

8.6 Market opportunity by End-user

Market opportunity by End-user ($ million)
Data Table on Market opportunity by End-user ($ million)

9. Market Segmentation by Source

9.1 Market segments

Chart on Source - Market share 2025-2030 (%)
Data Table on Source - Market share 2025-2030 (%)

9.2 Comparison by Source

Chart on Comparison by Source
Data Table on Comparison by Source

9.3 Orange - Market size and forecast 2025-2030

Chart on Orange - Market size and forecast 2025-2030 ($ million)
Data Table on Orange - Market size and forecast 2025-2030 ($ million)
Chart on Orange - Year-over-year growth 2025-2030 (%)
Data Table on Orange - Year-over-year growth 2025-2030 (%)

9.4 Lemon - Market size and forecast 2025-2030

Chart on Lemon - Market size and forecast 2025-2030 ($ million)
Data Table on Lemon - Market size and forecast 2025-2030 ($ million)
Chart on Lemon - Year-over-year growth 2025-2030 (%)
Data Table on Lemon - Year-over-year growth 2025-2030 (%)

9.5 Others - Market size and forecast 2025-2030

Chart on Others - Market size and forecast 2025-2030 ($ million)
Data Table on Others - Market size and forecast 2025-2030 ($ million)
Chart on Others - Year-over-year growth 2025-2030 (%)
Data Table on Others - Year-over-year growth 2025-2030 (%)

9.6 Market opportunity by Source

Market opportunity by Source ($ million)
Data Table on Market opportunity by Source ($ million)

10. Market Segmentation by Grade Type

10.1 Market segments

Chart on Grade Type - Market share 2025-2030 (%)
Data Table on Grade Type - Market share 2025-2030 (%)

10.2 Comparison by Grade Type

Chart on Comparison by Grade Type
Data Table on Comparison by Grade Type

10.3 Food grade - Market size and forecast 2025-2030

Chart on Food grade - Market size and forecast 2025-2030 ($ million)
Data Table on Food grade - Market size and forecast 2025-2030 ($ million)
Chart on Food grade - Year-over-year growth 2025-2030 (%)
Data Table on Food grade - Year-over-year growth 2025-2030 (%)

10.4 Industrial grade - Market size and forecast 2025-2030

Chart on Industrial grade - Market size and forecast 2025-2030 ($ million)
Data Table on Industrial grade - Market size and forecast 2025-2030 ($ million)
Chart on Industrial grade - Year-over-year growth 2025-2030 (%)
Data Table on Industrial grade - Year-over-year growth 2025-2030 (%)

10.5 Pharma grade - Market size and forecast 2025-2030

Chart on Pharma grade - Market size and forecast 2025-2030 ($ million)
Data Table on Pharma grade - Market size and forecast 2025-2030 ($ million)
Chart on Pharma grade - Year-over-year growth 2025-2030 (%)
Data Table on Pharma grade - Year-over-year growth 2025-2030 (%)

10.6 Market opportunity by Grade Type

Market opportunity by Grade Type ($ million)
Data Table on Market opportunity by Grade Type ($ million)

11. Customer Landscape

11.1 Customer landscape overview

Analysis of price sensitivity, lifecycle, customer purchase basket, adoption rates, and purchase criteria

12. Geographic Landscape

12.1 Geographic segmentation

Chart on Market share by geography 2025-2030 (%)
Data Table on Market share by geography 2025-2030 (%)

12.2 Geographic comparison

Chart on Geographic comparison
Data Table on Geographic comparison

12.3 APAC - Market size and forecast 2025-2030

Chart on APAC - Market size and forecast 2025-2030 ($ million)
Data Table on APAC - Market size and forecast 2025-2030 ($ million)
Chart on APAC - Year-over-year growth 2025-2030 (%)
Data Table on APAC - Year-over-year growth 2025-2030 (%)
Chart on Regional Comparison - APAC
Data Table on Regional Comparison - APAC

12.3.1 China - Market size and forecast 2025-2030

Chart on China - Market size and forecast 2025-2030 ($ million)
Data Table on China - Market size and forecast 2025-2030 ($ million)
Chart on China - Year-over-year growth 2025-2030 (%)
Data Table on China - Year-over-year growth 2025-2030 (%)

12.3.2 Japan - Market size and forecast 2025-2030

Chart on Japan - Market size and forecast 2025-2030 ($ million)
Data Table on Japan - Market size and forecast 2025-2030 ($ million)
Chart on Japan - Year-over-year growth 2025-2030 (%)
Data Table on Japan - Year-over-year growth 2025-2030 (%)

12.3.3 India - Market size and forecast 2025-2030

Chart on India - Market size and forecast 2025-2030 ($ million)
Data Table on India - Market size and forecast 2025-2030 ($ million)
Chart on India - Year-over-year growth 2025-2030 (%)
Data Table on India - Year-over-year growth 2025-2030 (%)

12.3.4 South Korea - Market size and forecast 2025-2030

Chart on South Korea - Market size and forecast 2025-2030 ($ million)
Data Table on South Korea - Market size and forecast 2025-2030 ($ million)
Chart on South Korea - Year-over-year growth 2025-2030 (%)
Data Table on South Korea - Year-over-year growth 2025-2030 (%)

12.3.5 Australia - Market size and forecast 2025-2030

Chart on Australia - Market size and forecast 2025-2030 ($ million)
Data Table on Australia - Market size and forecast 2025-2030 ($ million)
Chart on Australia - Year-over-year growth 2025-2030 (%)
Data Table on Australia - Year-over-year growth 2025-2030 (%)

12.3.6 Indonesia - Market size and forecast 2025-2030

Chart on Indonesia - Market size and forecast 2025-2030 ($ million)
Data Table on Indonesia - Market size and forecast 2025-2030 ($ million)
Chart on Indonesia - Year-over-year growth 2025-2030 (%)
Data Table on Indonesia - Year-over-year growth 2025-2030 (%)

12.4 North America - Market size and forecast 2025-2030

Chart on North America - Market size and forecast 2025-2030 ($ million)
Data Table on North America - Market size and forecast 2025-2030 ($ million)
Chart on North America - Year-over-year growth 2025-2030 (%)
Data Table on North America - Year-over-year growth 2025-2030 (%)
Chart on Regional Comparison - North America
Data Table on Regional Comparison - North America

12.4.1 US - Market size and forecast 2025-2030

Chart on US - Market size and forecast 2025-2030 ($ million)
Data Table on US - Market size and forecast 2025-2030 ($ million)
Chart on US - Year-over-year growth 2025-2030 (%)
Data Table on US - Year-over-year growth 2025-2030 (%)

12.4.2 Canada - Market size and forecast 2025-2030

Chart on Canada - Market size and forecast 2025-2030 ($ million)
Data Table on Canada - Market size and forecast 2025-2030 ($ million)
Chart on Canada - Year-over-year growth 2025-2030 (%)
Data Table on Canada - Year-over-year growth 2025-2030 (%)

12.4.3 Mexico - Market size and forecast 2025-2030

Chart on Mexico - Market size and forecast 2025-2030 ($ million)
Data Table on Mexico - Market size and forecast 2025-2030 ($ million)
Chart on Mexico - Year-over-year growth 2025-2030 (%)
Data Table on Mexico - Year-over-year growth 2025-2030 (%)

12.5 South America - Market size and forecast 2025-2030

Chart on South America - Market size and forecast 2025-2030 ($ million)
Data Table on South America - Market size and forecast 2025-2030 ($ million)
Chart on South America - Year-over-year growth 2025-2030 (%)
Data Table on South America - Year-over-year growth 2025-2030 (%)
Chart on Regional Comparison - South America
Data Table on Regional Comparison - South America

12.5.1 Brazil - Market size and forecast 2025-2030

Chart on Brazil - Market size and forecast 2025-2030 ($ million)
Data Table on Brazil - Market size and forecast 2025-2030 ($ million)
Chart on Brazil - Year-over-year growth 2025-2030 (%)
Data Table on Brazil - Year-over-year growth 2025-2030 (%)

12.5.2 Argentina - Market size and forecast 2025-2030

Chart on Argentina - Market size and forecast 2025-2030 ($ million)
Data Table on Argentina - Market size and forecast 2025-2030 ($ million)
Chart on Argentina - Year-over-year growth 2025-2030 (%)
Data Table on Argentina - Year-over-year growth 2025-2030 (%)

12.5.3 Chile - Market size and forecast 2025-2030

Chart on Chile - Market size and forecast 2025-2030 ($ million)
Data Table on Chile - Market size and forecast 2025-2030 ($ million)
Chart on Chile - Year-over-year growth 2025-2030 (%)
Data Table on Chile - Year-over-year growth 2025-2030 (%)

12.6 Europe - Market size and forecast 2025-2030

Chart on Europe - Market size and forecast 2025-2030 ($ million)
Data Table on Europe - Market size and forecast 2025-2030 ($ million)
Chart on Europe - Year-over-year growth 2025-2030 (%)
Data Table on Europe - Year-over-year growth 2025-2030 (%)
Chart on Regional Comparison - Europe
Data Table on Regional Comparison - Europe

12.6.1 Germany - Market size and forecast 2025-2030

Chart on Germany - Market size and forecast 2025-2030 ($ million)
Data Table on Germany - Market size and forecast 2025-2030 ($ million)
Chart on Germany - Year-over-year growth 2025-2030 (%)
Data Table on Germany - Year-over-year growth 2025-2030 (%)

12.6.2 UK - Market size and forecast 2025-2030

Chart on UK - Market size and forecast 2025-2030 ($ million)
Data Table on UK - Market size and forecast 2025-2030 ($ million)
Chart on UK - Year-over-year growth 2025-2030 (%)
Data Table on UK - Year-over-year growth 2025-2030 (%)

12.6.3 France - Market size and forecast 2025-2030

Chart on France - Market size and forecast 2025-2030 ($ million)
Data Table on France - Market size and forecast 2025-2030 ($ million)
Chart on France - Year-over-year growth 2025-2030 (%)
Data Table on France - Year-over-year growth 2025-2030 (%)

12.6.4 Italy - Market size and forecast 2025-2030

Chart on Italy - Market size and forecast 2025-2030 ($ million)
Data Table on Italy - Market size and forecast 2025-2030 ($ million)
Chart on Italy - Year-over-year growth 2025-2030 (%)
Data Table on Italy - Year-over-year growth 2025-2030 (%)

12.6.5 Spain - Market size and forecast 2025-2030

Chart on Spain - Market size and forecast 2025-2030 ($ million)
Data Table on Spain - Market size and forecast 2025-2030 ($ million)
Chart on Spain - Year-over-year growth 2025-2030 (%)
Data Table on Spain - Year-over-year growth 2025-2030 (%)

12.6.6 The Netherlands - Market size and forecast 2025-2030

Chart on The Netherlands - Market size and forecast 2025-2030 ($ million)
Data Table on The Netherlands - Market size and forecast 2025-2030 ($ million)
Chart on The Netherlands - Year-over-year growth 2025-2030 (%)
Data Table on The Netherlands - Year-over-year growth 2025-2030 (%)

12.7 Middle East and Africa - Market size and forecast 2025-2030

Chart on Middle East and Africa - Market size and forecast 2025-2030 ($ million)
Data Table on Middle East and Africa - Market size and forecast 2025-2030 ($ million)
Chart on Middle East and Africa - Year-over-year growth 2025-2030 (%)
Data Table on Middle East and Africa - Year-over-year growth 2025-2030 (%)
Chart on Regional Comparison - Middle East and Africa
Data Table on Regional Comparison - Middle East and Africa

12.7.1 Saudi Arabia - Market size and forecast 2025-2030

Chart on Saudi Arabia - Market size and forecast 2025-2030 ($ million)
Data Table on Saudi Arabia - Market size and forecast 2025-2030 ($ million)
Chart on Saudi Arabia - Year-over-year growth 2025-2030 (%)
Data Table on Saudi Arabia - Year-over-year growth 2025-2030 (%)

12.7.2 UAE - Market size and forecast 2025-2030

Chart on UAE - Market size and forecast 2025-2030 ($ million)
Data Table on UAE - Market size and forecast 2025-2030 ($ million)
Chart on UAE - Year-over-year growth 2025-2030 (%)
Data Table on UAE - Year-over-year growth 2025-2030 (%)

12.7.3 South Africa - Market size and forecast 2025-2030

Chart on South Africa - Market size and forecast 2025-2030 ($ million)
Data Table on South Africa - Market size and forecast 2025-2030 ($ million)
Chart on South Africa - Year-over-year growth 2025-2030 (%)
Data Table on South Africa - Year-over-year growth 2025-2030 (%)

12.7.4 Israel - Market size and forecast 2025-2030

Chart on Israel - Market size and forecast 2025-2030 ($ million)
Data Table on Israel - Market size and forecast 2025-2030 ($ million)
Chart on Israel - Year-over-year growth 2025-2030 (%)
Data Table on Israel - Year-over-year growth 2025-2030 (%)

12.7.5 Turkey - Market size and forecast 2025-2030

Chart on Turkey - Market size and forecast 2025-2030 ($ million)
Data Table on Turkey - Market size and forecast 2025-2030 ($ million)
Chart on Turkey - Year-over-year growth 2025-2030 (%)
Data Table on Turkey - Year-over-year growth 2025-2030 (%)

12.8 Market opportunity by geography

Market opportunity by geography ($ million)
Data Tables on Market opportunity by geography ($ million)

13. Drivers, Challenges, and Opportunity

13.1 Market drivers

Rising demand for natural ingredients in food and personal care applications
Increasing adoption of bio-based solvents in industrial applications
Expansion of citrus processing and value-added by-product utilization

13.2 Market challenges

Dependence on citrus harvest variability
Competition from synthetic alternatives
Storage and shelf-life management limitations

13.3 Impact of drivers and challenges

Impact of drivers and challenges in 2025 and 2030

13.4 Market opportunities

Increasing focus on advanced citrus flavor stabilization technologies
Rising demand for smart agricultural practices
Rising focus on regional processing and localized supply ecosystems

14. Competitive Landscape

14.1 Overview

14.2

Overview on criticality of inputs and factors of differentiation

14.3 Landscape disruption

Overview on factors of disruption

14.4 Industry risks

Impact of key risks on business

15. Competitive Analysis

15.1 Companies profiled

Companies covered

15.2 Company ranking index

15.3 Market positioning of companies

Matrix on companies position and classification

15.4 Archer Daniels Midland Co.

Archer Daniels Midland Co. - Overview
Archer Daniels Midland Co. - Business segments
Archer Daniels Midland Co. - Key news
Archer Daniels Midland Co. - Key offerings
Archer Daniels Midland Co. - Segment focus
SWOT

15.5 Arora Aromatics Pvt. Ltd.

Arora Aromatics Pvt. Ltd. - Overview
Arora Aromatics Pvt. Ltd. - Product / Service
Arora Aromatics Pvt. Ltd. - Key offerings
SWOT

15.6 Citrofrut S.A.P.I. de C.V.

Citrofrut S.A.P.I. de C.V. - Overview
Citrofrut S.A.P.I. de C.V. - Product / Service
Citrofrut S.A.P.I. de C.V. - Key offerings
SWOT

15.7 Citrosuco

Citrosuco - Overview
Citrosuco - Product / Service
Citrosuco - Key offerings
SWOT

15.8 Citrus and Allied Essences Ltd.

Citrus and Allied Essences Ltd. - Overview
Citrus and Allied Essences Ltd. - Product / Service
Citrus and Allied Essences Ltd. - Key offerings
SWOT

15.9 Flavortec Industria e Comercio

Flavortec Industria e Comercio - Overview
Flavortec Industria e Comercio - Product / Service
Flavortec Industria e Comercio - Key offerings
SWOT

15.10 Himadri Tar Products Pvt. Ltd.

Himadri Tar Products Pvt. Ltd. - Overview
Himadri Tar Products Pvt. Ltd. - Product / Service
Himadri Tar Products Pvt. Ltd. - Key offerings
SWOT

15.11 Himalaya Terpene

Himalaya Terpene - Overview
Himalaya Terpene - Product / Service
Himalaya Terpene - Key offerings
SWOT

15.12 Integrada Citrus

Integrada Citrus - Overview
Integrada Citrus - Product / Service
Integrada Citrus - Key offerings
SWOT

15.13 Jindal Drugs Pvt Ltd

Jindal Drugs Pvt Ltd - Overview
Jindal Drugs Pvt Ltd - Product / Service
Jindal Drugs Pvt Ltd - Key offerings
SWOT

15.14 MCI Miritz Citrus GmbH and Co

MCI Miritz Citrus GmbH and Co - Overview
MCI Miritz Citrus GmbH and Co - Product / Service
MCI Miritz Citrus GmbH and Co - Key offerings
SWOT

15.15 Mentha and Allied Products. Ltd.

Mentha and Allied Products. Ltd. - Overview
Mentha and Allied Products. Ltd. - Product / Service
Mentha and Allied Products. Ltd. - Key offerings
SWOT

15.16 Neeru Menthol Pvt. Ltd.

Neeru Menthol Pvt. Ltd. - Overview
Neeru Menthol Pvt. Ltd. - Product / Service
Neeru Menthol Pvt. Ltd. - Key offerings
SWOT

15.17 Nippon Terpene Chemicals Inc.

Nippon Terpene Chemicals Inc. - Overview
Nippon Terpene Chemicals Inc. - Product / Service
Nippon Terpene Chemicals Inc. - Key offerings
SWOT

15.18 Privi Speciality Chemicals Ltd

Privi Speciality Chemicals Ltd - Overview
Privi Speciality Chemicals Ltd - Product / Service
Privi Speciality Chemicals Ltd - Key offerings
SWOT

16. Appendix

16.1 Scope of the report

Market definition
Objectives
Notes and caveats

16.2 Inclusions and exclusions checklist

Inclusions checklist
Exclusions checklist

16.3 Currency conversion rates for US$

16.4 Research methodology

16.5 Data procurement

Information sources

16.6 Data validation

16.7 Validation techniques employed for market sizing

16.8 Data synthesis

16.9 360 degree market analysis

16.10 List of abbreviations

Research Methodology

Technavio presents a detailed picture of the market by way of study, synthesis, and summation of data from multiple sources. The analysts have presented the various facets of the market with a particular focus on identifying the key industry influencers. The data thus presented is comprehensive, reliable, and the result of extensive research, both primary and secondary.

INFORMATION SOURCES

Primary sources

  • Manufacturers and suppliers
  • Channel partners
  • Industry experts
  • Strategic decision makers

Secondary sources

  • Industry journals and periodicals
  • Government data
  • Financial reports of key industry players
  • Historical data
  • Press releases

DATA ANALYSIS

Data Synthesis

  • Collation of data
  • Estimation of key figures
  • Analysis of derived insights

Data Validation

  • Triangulation with data models
  • Reference against proprietary databases
  • Corroboration with industry experts

REPORT WRITING

Qualitative

  • Market drivers
  • Market challenges
  • Market trends
  • Five forces analysis

Quantitative

  • Market size and forecast
  • Market segmentation
  • Geographical insights
  • Competitive landscape

Interested in this report?

Get your sample now to see our research methodology and insights!

Download Now

Frequently Asked Questions

Limonene market growth will increase by USD 109.9 million during 2026-2030.

The Limonene market is expected to grow at a CAGR of 3.7% during 2026-2030.

Limonene market is segmented by End-user (Food and beverage processing, Pharmaceuticals, Personal care and cosmetics) Source (Orange, Lemon, Others) Grade type (Food grade, Industrial grade, Pharma grade)

AOS Products Pvt. Ltd., Archer Daniels Midland Co., Arora Aromatics Pvt. Ltd., Citrofrut S.A.P.I. de C.V., Citrosuco, Citrus and Allied Essences Ltd., Flavortec Industria e Comercio, Florachem Corp., Himadri Tar Products Pvt. Ltd., Himalaya Terpene, Integrada Citrus, Jindal Drugs Pvt Ltd, Lemonconcentrate S.L.U., MCI Miritz Citrus GmbH and Co, Mentha and Allied Products. Ltd., Neeru Menthol Pvt. Ltd., Nippon Terpene Chemicals Inc., Privi Speciality Chemicals Ltd, Sharp Mint Ltd, Sucorrico Citrus Industrial are a few of the key vendors in the Limonene market.

APAC will register the highest growth rate of 45.6% among the other regions. Therefore, the Limonene market in APAC is expected to garner significant business opportunities for the vendors during the forecast period.

China, Japan, India, South Korea, Australia, Indonesia, US, Canada, Mexico, Brazil, Argentina, Chile, Germany, UK, France, Italy, Spain, The Netherlands, Saudi Arabia, UAE, South Africa, Israel, Turkey

  • Rising demand for natural ingredients in food and personal care applications is the driving factor this market.

The Limonene market vendors should focus on grabbing business opportunities from the End-user segment as it accounted for the largest market share in the base year.
RIA - Research AI Assistant
Ask RIA
