
Linear Actuators Market Size 2025-2029
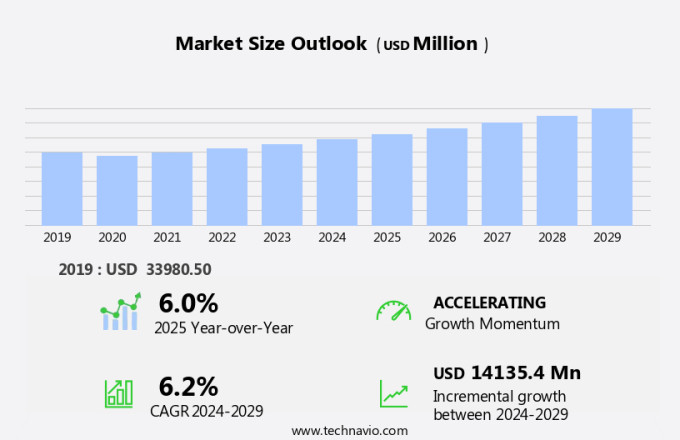
The linear actuators market size is forecast to increase by USD 14.14 billion, at a CAGR of 6.2% between 2024 and 2029.
- The market is experiencing significant growth, driven primarily by the increasing demand from the automotive industry. This sector's adoption of electric linear actuators is on the rise due to their ability to improve fuel efficiency and vehicle performance. Another trend influencing market growth is the increasing preference for smart actuators. These advanced actuators offer features such as precise positioning, improved reliability, and enhanced safety, making them a popular choice for various applications. However, the high initial cost of actuator implementation remains a notable challenge for market expansion. Companies seeking to capitalize on market opportunities must focus on developing cost-effective solutions while maintaining the high-performance standards expected by consumers.
- Additionally, investing in research and development to create more advanced and versatile actuators could provide a competitive edge in the market. Overall, the market presents significant growth potential, with the automotive industry and demand for smart actuators driving market expansion, while the high initial cost of implementation poses a challenge that companies must address to maximize their market share.
What will be the Size of the Linear Actuators Market during the forecast period?
The market continues to evolve, driven by the diverse applications across various sectors. These actuators, which convert linear motion from rotary input, find extensive use in industries such as material handling, medical equipment, and industrial automation. Actuator types, including ball screws, rack and pinion, and lead screws, each offer unique advantages in terms of force, stroke, and efficiency. Precision positioning is a critical factor in many applications, leading to the increasing popularity of actuators with advanced control systems and feedback mechanisms. Actuator design considerations include operating temperature, duty cycle, and safety features, while maintenance and testing are essential for ensuring reliability and longevity.
Actuator types, such as pneumatic, hydraulic, electric, and servo, each have distinct advantages and applications. For instance, electric actuators provide high efficiency and precise control, while pneumatic actuators offer power and simplicity. Actuator standards and certifications ensure interoperability and safety in various industries. Actuator troubleshooting and repair are ongoing concerns, with limit switches and proximity sensors playing crucial roles in detecting faults. Actuator efficiency and life cycle are essential factors in total cost of ownership calculations. The market dynamics are continuously unfolding, with ongoing research and development efforts focused on improving actuator durability, precision, and responsiveness.
How is this Linear Actuators Industry segmented?
The linear actuators industry research report provides comprehensive data (region-wise segment analysis), with forecasts and estimates in "USD billion" for the period 2025-2029, as well as historical data from 2019-2023 for the following segments.
- Product
- Electric
- Hydraulic
- Pneumatic
- End-user
- Automotive industry
- Water and wastewater industry
- Marine industry
- Aerospace and defense industry
- Others
- Geography
- North America
- US
- Canada
- Europe
- France
- Germany
- Italy
- UK
- APAC
- China
- India
- Japan
- South Korea
- Rest of World (ROW)
- North America
By Product Insights
The electric segment is estimated to witness significant growth during the forecast period.
The linear actuator market is witnessing significant growth, driven by the electric segment's increasing adoption in various industries. Electric actuators offer advantages such as low maintenance costs, high reliability, and efficient operation under extreme temperatures, making them a popular choice over hydraulic and pneumatic actuators. These actuators find extensive applications in the automotive and aerospace defense sectors, where precision positioning and safety are paramount. Actuator design and manufacturing have advanced, leading to the integration of technologies like servo motors, motion control, and feedback systems. Actuator safety is a critical concern, leading to the development of certifications and standards.
Actuator repair and maintenance have become essential to ensure longevity and optimal performance. Actuators are integral to material handling and industrial automation, with applications ranging from medical equipment to manufacturing processes. Actuator types include pneumatic, electric, hydraulic, and others, each with unique characteristics. For instance, electric actuators offer high efficiency and can be easily integrated with automation systems, while pneumatic actuators are known for their high force output and simple design. Actuator troubleshooting and testing are crucial to maintain optimal performance. Proximity sensors and limit switches are commonly used for position feedback. Actuator stroke length and duty cycle are essential factors in determining their suitability for specific applications.
Linear guides and ball screws ensure smooth motion, while rack and pinion and gear motors provide the necessary force. Actuator design and manufacturing have evolved, with a focus on durability, efficiency, and precision. Rotary actuators and hydraulic actuators are used in specific applications, such as heavy-duty machinery and high-pressure systems. Actuator certifications ensure compliance with industry standards and regulations. In conclusion, the linear actuator market is dynamic and diverse, driven by technological advancements and evolving industry requirements. Actuators play a crucial role in various industries, from automotive and aerospace to manufacturing and medical equipment, and their design and manufacturing continue to evolve to meet the demands of these applications.
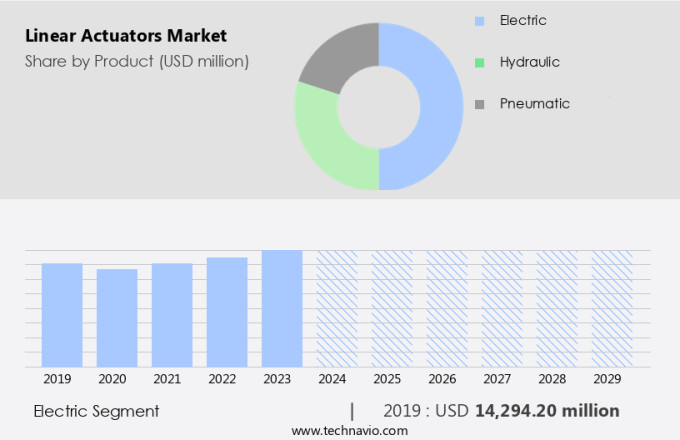
The Electric segment was valued at USD 14.29 billion in 2019 and showed a gradual increase during the forecast period.
Regional Analysis
APAC is estimated to contribute 49% to the growth of the global market during the forecast period.Technavio’s analysts have elaborately explained the regional trends and drivers that shape the market during the forecast period.

In the APAC market, the automotive manufacturing and construction sectors drive significant demand for linear actuators. Industrial expansion and the rise of smart manufacturing industries are key growth factors. Linear actuators are integral to automating facilities, with applications in robotic arms and press assemblies in the automotive sector. In APAC, China, Russia, Japan, Australia, Singapore, and India are major contributors to market growth. Linear motion is a critical aspect of actuator design, with ball screws and lead screws providing precision positioning. Actuator safety is paramount, particularly in medical equipment applications. Servo motors and stepper motors offer varying duty cycles and speeds for diverse use cases.
Actuator reliability is essential for long-term operation, and maintenance and testing are crucial for ensuring optimal performance. Actuator certifications are necessary for specific industries, such as material handling and industrial automation. Actuator types include pneumatic, electric, hydraulic, and rotary, each with unique advantages. Precision positioning is a key requirement in many applications, with limit switches and position feedback systems providing essential control. Actuator manufacturing involves various components, including linear guides, actuator design, and actuator feedback systems. Actuator troubleshooting and operating temperature management are essential for maintaining efficiency and durability. Actuator force and stroke are important considerations, as is actuator control and actuator efficiency.
Motion control systems integrate various actuator types to automate complex processes. Proximity sensors and actuator mounting solutions facilitate seamless integration. Actuator repair and maintenance are essential for ensuring long-term functionality. Actuator standards ensure interoperability and compatibility across various applications. In conclusion, the APAC the market is witnessing significant growth due to industrial expansion and the rise of smart manufacturing industries. Linear actuators play a crucial role in automating manufacturing processes and are used extensively in robotic arms and press assemblies. Actuator design, safety, reliability, and efficiency are key considerations for various industries, including medical equipment, material handling, and industrial automation.
Actuator manufacturing involves various components, and maintenance and testing are essential for optimal performance. Actuator certifications, motion control systems, and various actuator types cater to diverse applications, ensuring the market's continued growth.
Market Dynamics
Our researchers analyzed the data with 2024 as the base year, along with the key drivers, trends, and challenges. A holistic analysis of drivers will help companies refine their marketing strategies to gain a competitive advantage.
What are the key market drivers leading to the rise in the adoption of Linear Actuators Industry?
- The automotive industry's growing demand for electric linear actuators serves as the primary market driver.
- The linear actuator market is experiencing significant growth due to the increasing demand from various industries, with the automotive sector being a major contributor. Actuators are increasingly being utilized in the automotive industry for applications such as robotic spot welding, assembly pressing, robotic dispensing, clamping, and fixturing. While hydraulic actuators have traditionally been popular due to their ease of incorporation in fuel-powered systems, they are prone to chronic leaks and require frequent adjustments in response to temperature and humidity changes. As a result, there is a growing trend towards the adoption of electric linear actuators, which offer the benefits of being leak-free and easier to install.
- Actuator design plays a crucial role in their functionality and efficiency. Actuator feedback and maintenance are essential aspects of ensuring optimal performance. Proximity sensors are commonly used for feedback in linear actuators, providing real-time position information. Regular maintenance and testing are necessary to ensure the longevity and reliability of these components. Motion control is another key application area for linear actuators, particularly in material handling applications. Pneumatic actuators are widely used in this sector due to their ability to provide high force and fast response times. However, they require regular maintenance to maintain optimal performance. Electric linear actuators, on the other hand, offer the benefits of lower maintenance requirements and longer lifespan.
- In conclusion, the linear actuator market is driven by the increasing demand from various industries, with the automotive sector being a major contributor. Actuator design, feedback, maintenance, testing, and motion control are essential aspects of their functionality and efficiency. Electric linear actuators are gaining popularity due to their advantages over hydraulic and pneumatic alternatives.
What are the market trends shaping the Linear Actuators Industry?
- The trend in the market is characterized by a rising demand for smart actuators. This demand is driven by the increasing adoption of automation and IoT technologies in various industries.
- Linear actuators have witnessed significant advancements with the integration of IoT and Industry 4.0 technologies. Actuators now come with features such as potentiometers, rotary encoders, network switches, and controllers, enabling advanced functionalities like position feedback, system diagnostics, and switching. companies are incorporating microprocessor-based printed circuit boards and software into actuators, as demonstrated by Thomson Industries' Electrak Smart Linear Actuator. This innovation offers increased efficiency and productivity through enhanced controllability and diagnostic capabilities. Actuator troubleshooting is simplified with real-time monitoring and remote access. Actuator operating temperature and durability are crucial factors in selecting the appropriate actuator type. Precision positioning is essential for various industries, including automotive, medical, and aerospace.
- Actuator control systems, such as stepper motors and limit switches, ensure accurate positioning. Actuator standards, like ISO and CE, ensure compliance with safety and quality regulations. Electric actuators offer high efficiency and are widely used due to their versatility and ease of integration with various control systems.
What challenges does the Linear Actuators Industry face during its growth?
- The high initial cost of implementing actuators poses a significant challenge to the industry's growth trajectory. This expense, a common concern among professionals in the field, can hinder the industry from achieving optimal growth.
- Linear actuators play a significant role in industrial automation, providing force to move machinery and equipment. Actuator types, such as rack and pinion, lead screws, and gear motors, offer varying advantages in terms of actuator force, position feedback, and certifications. However, the high initial cost of some actuators, particularly electric linear actuators, can hinder market growth. Electric actuators, while more expensive upfront, offer lower operational and maintenance costs compared to hydraulic and pneumatic alternatives. Conversely, pneumatic and hydraulic actuators have lower procurement costs but require frequent part replacements due to leakages and contaminations, leading to higher operational and maintenance expenses.
- Understanding these trade-offs is crucial for businesses considering actuator implementation. Actuator manufacturing companies focus on improving actuator life cycle, certifications, and harmonious integration with control systems to meet evolving industry demands. Rotary actuators and hydraulic actuators are also popular choices in specific applications due to their unique benefits.
Exclusive Customer Landscape
The linear actuators market forecasting report includes the adoption lifecycle of the market, covering from the innovator’s stage to the laggard’s stage. It focuses on adoption rates in different regions based on penetration. Furthermore, the linear actuators market report also includes key purchase criteria and drivers of price sensitivity to help companies evaluate and develop their market growth analysis strategies.

Customer Landscape
Key Companies & Market Insights
Companies are implementing various strategies, such as strategic alliances, linear actuators market forecast, partnerships, mergers and acquisitions, geographical expansion, and product/service launches, to enhance their presence in the industry.
ABB Ltd. - The company specializes in providing a range of linear actuators, including the LME620, RSD10, and RSD50 models. These advanced actuators deliver precise motion control for various applications, enhancing efficiency and productivity. Engineered with innovative technology, they offer reliable performance and durability. The company's commitment to research and development ensures continuous improvement, keeping it at the forefront of the linear actuator industry.
The industry research and growth report includes detailed analyses of the competitive landscape of the market and information about key companies, including:
- ABB Ltd.
- Actuonix Motion Devices Inc.
- Bishop Wisecarver Corp.
- Curtiss Wright Corp.
- Emerson Electric Co.
- Ewellix AB
- Festo SE and Co. KG
- Flowserve Corp.
- General Electric Co.
- Kollmorgen Corp.
- LINAK AS
- Moog Inc.
- Motion Plus LLC
- Oriental Motor Co. Ltd.
- Parker Hannifin Corp.
- Sensata Technologies Inc.
- Siemens AG
- SMC Corp.
- The Timken Co.
- TiMOTION Technology Co. Ltd.
- Tolomatic Inc.
Qualitative and quantitative analysis of companies has been conducted to help clients understand the wider business environment as well as the strengths and weaknesses of key industry players. Data is qualitatively analyzed to categorize companies as pure play, category-focused, industry-focused, and diversified; it is quantitatively analyzed to categorize companies as dominant, leading, strong, tentative, and weak.
Recent Development and News in Linear Actuators Market
- In February 2023, Bosch Rexroth, a leading industrial technology company, introduced its new generation of compact linear actuators, offering up to 50% more stroke length in the same size as previous models (Bosch Rexroth press release, 2023). This innovation addresses the demand for compact yet powerful actuators in various industries, including automotive, manufacturing, and renewable energy.
- In October 2024, Schneider Electric, a global energy management and automation company, announced a strategic partnership with Siemens to expand their combined offering of linear motion technologies (Schneider Electric press release, 2024). This collaboration aims to provide customers with a comprehensive portfolio of linear actuators, drives, and control systems, enhancing their competitive edge in various markets.
- In March 2025, Parker Hannifin, a Fortune 250 global leader in motion and control technologies, completed the acquisition of Meggitt Sensing Systems, a leading provider of sensing and monitoring solutions (Parker Hannifin press release, 2025). This strategic move enables Parker Hannifin to expand its portfolio and enhance its position in the market by integrating Meggitt's advanced sensing technologies.
- In June 2025, the European Union (EU) passed a new regulation on the Energy Performance of Buildings Directive (EPBD), mandating the installation of automated shading systems in new buildings (European Parliament press release, 2025). This regulatory development is expected to significantly boost the demand for linear actuators in the building automation sector, as these systems are essential components for controlling shading mechanisms.
Research Analyst Overview
- The actuator market continues to evolve, driven by advancements in technology and increasing demand for automation in various industries. Actuator sizing and programming are crucial aspects of implementation, with optimization techniques ensuring efficient performance. Actuator temperature control is essential for maintaining system stability, while environmental protection and sustainability are key trends. Actuator research focuses on innovation, including software solutions for improved efficiency and noise reduction. Actuator safety systems and reliability enhancement are paramount, with feedback systems and life extension strategies essential for ensuring longevity. Actuator cost remains a significant consideration, with networks and integration strategies optimizing performance while minimizing expenses.
- Actuator development is ongoing, with durability testing and continuous improvement essential for meeting evolving industry needs. Actuator sensors and control systems play a vital role in enhancing overall system performance, with a focus on reducing maintenance requirements and increasing uptime. Actuator trends include optimization, environmental protection, and sustainability, with a growing emphasis on recycling and circular economy principles.
Dive into Technavio’s robust research methodology, blending expert interviews, extensive data synthesis, and validated models for unparalleled Linear Actuators Market insights. See full methodology.
|
Market Scope |
|
|
Report Coverage |
Details |
|
Page number |
214 |
|
Base year |
2024 |
|
Historic period |
2019-2023 |
|
Forecast period |
2025-2029 |
|
Growth momentum & CAGR |
Accelerate at a CAGR of 6.2% |
|
Market growth 2025-2029 |
USD 14.14 billion |
|
Market structure |
Fragmented |
|
YoY growth 2024-2025(%) |
6.0 |
|
Key countries |
US, Germany, China, India, UK, Canada, South Korea, Japan, France, and Italy |
|
Competitive landscape |
Leading Companies, Market Positioning of Companies, Competitive Strategies, and Industry Risks |
What are the Key Data Covered in this Linear Actuators Market Research and Growth Report?
- CAGR of the Linear Actuators industry during the forecast period
- Detailed information on factors that will drive the growth and forecasting between 2025 and 2029
- Precise estimation of the size of the market and its contribution of the industry in focus to the parent market
- Accurate predictions about upcoming growth and trends and changes in consumer behaviour
- Growth of the market across APAC, North America, Europe, Middle East and Africa, and South America
- Thorough analysis of the market’s competitive landscape and detailed information about companies
- Comprehensive analysis of factors that will challenge the linear actuators market growth of industry companies
We can help! Our analysts can customize this linear actuators market research report to meet your requirements.