Lipid Nanoparticles Market Size 2024-2028
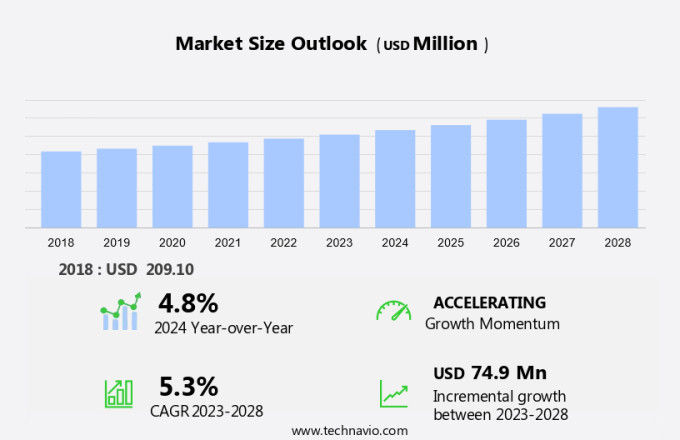
The lipid nanoparticles market size is forecast to increase by USD 74.9 million at a CAGR of 5.3% between 2023 and 2028.
- The market is experiencing significant growth due to the increasing demand for biocompatible formulations in various therapeutic applications. Phospholipids and cholesterol are the primary components of LNPs, making them an ideal choice for nanotechnology-based drug delivery systems. One of the key trends driving market growth is the increasing use of LNPs in mRNA vaccine delivery and targeted drug delivery for chronic diseases, particularly in the areas of oncology and personalized medicine. The development of innovative LNP formulation services and product launches are also contributing to market growth. However, stringent regulations and quality standards pose challenges to market participants. As the market continues to evolve, the focus will be on enhancing the efficacy and safety of LNP-based therapeutics while ensuring regulatory compliance. Key players in the market are investing in research and development to address these challenges and expand their product offerings.
What will be the Size of the Market During the Forecast Period?
- Lipid nanoparticles (LNPs), a type of nanoscale particles, have emerged as a promising platform for delivering active ingredients in various industries, including cosmetics and pharmaceuticals. These particles, composed of lipids, have shown significant potential in enhancing the efficacy and safety of active components, particularly in the areas of skin penetration, anti-aging treatment, and radiation damage. In cosmetics, LNPs have been extensively studied for their ability to improve the performance of active ingredients in skin care products. The unique structure of LNPs allows them to penetrate the skin more effectively, ensuring the delivery of active ingredients directly to the target site. This is crucial for anti-aging treatments, as well as addressing various skin conditions such as atopic dermatitis.
- Active ingredients, such as antioxidants, carotenoids, retinoids, and tocopherols, can be encapsulated within LNPs to enhance their anti-inflammatory and irritation-fighting properties. These ingredients are essential for maintaining healthy skin and treating various skin conditions. LNPs also hold great promise in the field of pharmaceuticals, particularly in the area of gene delivery systems. Nucleic acids, including mRNA-based vaccines and therapeutic options, can be encapsulated within LNPs to improve their stability and bioavailability. This is crucial for the development of personalized medicine and cancer treatment. Solid lipid nanoparticles (SLNs) and nanostructured lipid carriers (NLCs) are two common types of LNPs used in therapeutics. SLNs consist of a solid lipid core, while NLCs have a solid lipid core with dispersed nanoscale liquid lipid domains. Both types of LNPs have shown significant potential in drug delivery, particularly in the pharmaceutical and biotechnology industries. Clinical trials have demonstrated the efficacy and safety of LNPs as drug delivery systems for various therapeutic agents.
How is this market segmented and which is the largest segment?
The market research report provides comprehensive data (region-wise segment analysis), with forecasts and estimates in "USD million" for the period 2024-2028, as well as historical data from 2018-2022 for the following segments.
- Type
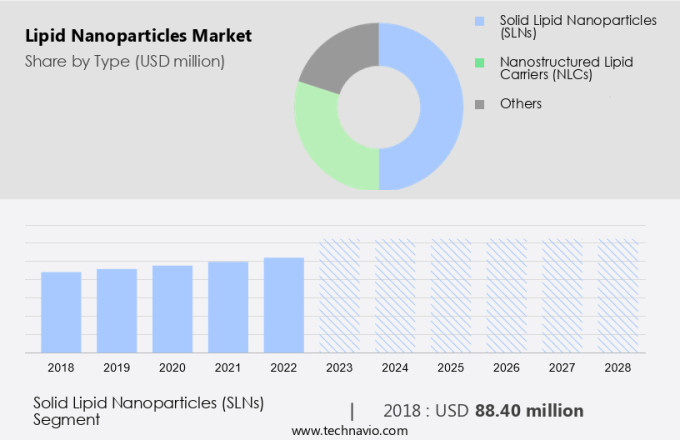
- Solid lipid nanoparticles (SLNs)
- Nanostructured lipid carriers (NLCs)
- Others
- Product
- Ionizable lipids
- Phospho lipids
- Neutral lipids
- Others
- Geography
- North America
- Canada
- US
- Europe
- Germany
- UK
- France
- Spain
- Asia
- China
- India
- Japan
- South Korea
- Rest of World (ROW)
- North America
By Type Insights
- The solid lipid nanoparticles (SLNs) segment is estimated to witness significant growth during the forecast period.
Solid lipid nanoparticles (SLNs), a type of first-generation nanocarriers, are formulated using lipids that remain solid at body temperature and are stabilized by emulsifiers. These nanoparticles, which are typically under 1000 nm in size, offer several advantages for the pharmaceutical industry. They provide effective protection for drugs against harsh environmental conditions, facilitate large-scale production through high-pressure homogenization, and exhibit inherent biocompatibility and biodegradability.
As anti-inflammatory and irritation-fighting agents, SLNs offer improved efficacy and reduced side effects compared to traditional topical treatments. Moreover, SLNs have shown promise in drug delivery systems, particularly in the area of angiogenesis, where they can effectively target and accumulate drugs at the site of injury or inflammation. SLNs represent a promising nanoparticle-based solution for the treatment of various skin conditions and drug delivery applications. Their unique properties offer several advantages, including protection of drugs and ease of production, while also addressing challenges related to drug loading efficiency and initial burst release. As the demand for effective and targeted drug delivery systems continues to grow, the use of SLNs is expected to increase in the pharmaceutical industry.
Get a glance at the market report of share of various segments Request Free Sample
The solid lipid nanoparticles (SLNs) segment was valued at USD 88.40 million in 2018 and showed a gradual increase during the forecast period.
Regional Analysis
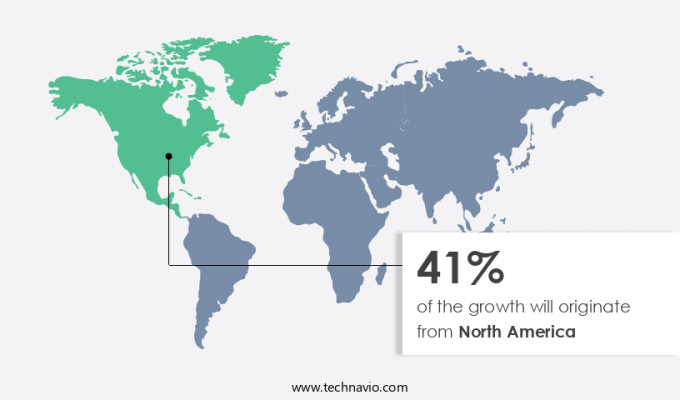
- North America is estimated to contribute 41% to the growth of the global market during the forecast period.
Technavio's analysts have elaborately explained the regional trends and drivers that shape the market during the forecast period.
For more insights on the market share of various regions Request Free Sample
The market is experiencing significant growth due to its application in chronic diseases, particularly in the field of gene delivery systems for nucleic acids. In North America, countries like the US and Canada are leading this development, thanks to their advanced biotechnology and pharmaceutical sectors. These nations are at the forefront of utilizing LNPs as drug carriers for therapeutic options, including cancer treatment and mRNA-based vaccines.
Market Dynamics
Our researchers analyzed the data with 2023 as the base year, along with the key drivers, trends, and challenges. A holistic analysis of drivers will help companies refine their marketing strategies to gain a competitive advantage.
What are the key market drivers leading to the rise in adoption of Lipid Nanoparticles Market?
Development of innovative LNP formulation services is the key driver of the market.
- The market is experiencing significant growth due to the increasing demand for advanced drug delivery systems. In response to this trend, eTheRNA introduced a specialized LNP formulation development and production service in March 2022. This service utilizes eTheRNA's extensive lipid libraries and proprietary formulations to optimize the delivery of RNA-based therapeutics and vaccines.
- By providing targeted delivery and customized biodistribution solutions, eTheRNA enhances the effectiveness of these products, enabling customers to advance their RNA-based research in inflammatory disorders, cardiovascular diseases, and other applications. This service is essential for the development of next-generation RNA therapies and vaccines, which require precise delivery mechanisms to achieve optimal therapeutic outcomes. With AI-based platforms and cutting-edge technology, eTheRNA's LNP formulation development service is a valuable asset for researchers and pharmaceutical companies in the US and beyond.
What are the market trends shaping the Lipid Nanoparticles Market?
Product launches is the upcoming trend in the market.
- The market is experiencing a notable trend with the introduction of new products to facilitate the production of mRNA-based therapeutics. On February 28, 2024, CordenPharma International unveiled LNP Starter Kits, designed to aid researchers and developers in creating and optimizing lipid nanoparticles for mRNA delivery.
- With over three decades of expertise in lipid excipient CMC preparation and scaling up critical formulation components of commercialized COVID-19 vaccines, CordenPharma guarantees superior quality lipids with exceptional batch-to-batch consistency. These kits comprise four essential lipids: ionizable lipids, helper lipids, sterols, and PEGylated lipids, sourced from commercial-scale suppliers to minimize risks related to lipid source transitions from R&D to clinical phases.
What challenges does Lipid Nanoparticles Market face during the growth?
Stringent regulation is a key challenge affecting the market growth.
- In the intricate landscape of the market, biocompatible formulations derived from phospholipids and cholesterol are gaining significant attention due to their potential in advanced therapeutic applications, such as mRNA vaccine delivery and targeted drug delivery. The recent success of Pfizer and Moderna's COVID-19 vaccines, which employ mRNA encapsulated in LNPs, has underscored the market's potential.
- However, the regulatory approval process for these innovative modalities poses a considerable challenge. Navigating global regulatory frameworks for clinical trials and product approvals necessitates integrating regulatory strategies early in the development process. Developers must ensure compliance with varying international guidelines and address questions regarding the similarity of active pharmaceutical ingredients (APIs). This is crucial for therapeutic applications in chronic diseases, oncology, and personalized medicine. The LNP market's future lies in its ability to navigate these complexities and bring safe and effective treatments to patients.
Exclusive Customer Landscape
The market forecasting report includes the adoption lifecycle of the market, covering from the innovator's stage to the laggard's stage. It focuses on adoption rates in different regions based on penetration. Furthermore, the market report also includes key purchase criteria and drivers of price sensitivity to help companies evaluate and develop their market growth analysis strategies.
Customer Landscape
Key Companies & Market Insights
Companies are implementing various strategies, such as strategic alliances, market forecast, partnerships, mergers and acquisitions, geographical expansion, and product/service launches, to enhance their presence in the market. The market research and growth report includes detailed analyses of the competitive landscape of the market and information about key companies, including:
- Abbott Laboratories
- Acuitas Therapeutics
- Avanti Polar Lipids
- Biopharma PEG Scientific Inc.
- Corden Pharma International GmbH
- Creative Biolabs
- Curapath
- Evonik Industries AG
- FUJIFILM Holdings Corporation
- GATTEFOSSE SAS
- INTEGRATED NANOTHERAPEUTICS INC
- Merck KGaA
- NOF CORP.
- Organix INC
- Pantherna Therapeutics GmbH
- Polysciences Inc.
- Precision NanoSystems Inc
- VION Biosciences LLC
Qualitative and quantitative analysis of companies has been conducted to help clients understand the wider business environment as well as the strengths and weaknesses of key market players. Data is qualitatively analyzed to categorize companies as pure play, category-focused, industry-focused, and diversified; it is quantitatively analyzed to categorize companies as dominant, leading, strong, tentative, and weak.
Research Analyst Overview
Lipid nanoparticles (LNPs), a type of nanoscale particle, have gained significant attention in the pharmaceutical and biotechnology industries due to their potential as effective drug delivery systems. These biocompatible particles, composed of phospholipids and cholesterol, exhibit superior properties for skin penetration and can encapsulate various active ingredients, including antioxidants, carotenoids, retinoids, tocopherols, and anti-inflammatory agents. In the cosmetic sector, LNPs have found applications in anti-aging treatments, radiation damage protection, and the management of skin conditions like atopic dermatitis and psoriasis. Beyond cosmetics, LNPs have significant therapeutic applications.
Further, they are used in nanomedicine for drug delivery, particularly in the development of liposomal medicinal formulations and lipid-based excipients. LNPs have shown efficacy in enhancing drug solubility, bioavailability, and targeted delivery, making them valuable in the treatment of chronic diseases such as inflammatory disorders and cardiovascular diseases. Moreover, LNPs have been extensively studied for their role in gene delivery systems, RNA-based therapeutics, MRNA vaccines, gene editing, and gene therapy, with applications in oncology and personalized medicine. LNPs have shown promise in cancer treatment, MRNA-based vaccines, and clinical trials, and are being explored for AI-based platforms to improve drug delivery systems.
|
Market Scope |
|
|
Report Coverage |
Details |
|
Page number |
207 |
|
Base year |
2023 |
|
Historic period |
2018-2022 |
|
Forecast period |
2024-2028 |
|
Growth momentum & CAGR |
Accelerate at a CAGR of 5.3% |
|
Market growth 2024-2028 |
USD 74.9 million |
|
Market structure |
Fragmented |
|
YoY growth 2023-2024(%) |
4.8 |
|
Key countries |
US, China, UK, Germany, Japan, France, Spain, South Korea, Canada, and India |
|
Competitive landscape |
Leading Companies, Market Positioning of Companies, Competitive Strategies, and Industry Risks |
What are the Key Data Covered in this Market Research and Growth Report?
- CAGR of the market during the forecast period
- Detailed information on factors that will drive the market growth and forecasting between 2024 and 2028
- Precise estimation of the size of the market and its contribution of the market in focus to the parent market
- Accurate predictions about upcoming market growth and trends and changes in consumer behaviour
- Growth of the market across North America, Europe, Asia, and Rest of World (ROW)
- Thorough analysis of the market's competitive landscape and detailed information about companies
- Comprehensive analysis of factors that will challenge the growth of market companies
We can help! Our analysts can customize this market research report to meet your requirements. Get in touch


