Liquid Biopsy Market Analysis, Size, and Forecast 2024-2028: North America (US and Canada), Europe (Germany and UK), Middle East and Africa (UAE), APAC (Australia, India, Japan, and South Korea), South America (Brazil), and Rest of World (ROW)

Liquid Biopsy Market Analysis, Size, and Forecast 2024-2028:
North America (US and Canada), Europe (Germany and UK), Middle East and Africa (UAE), APAC (Australia, India, Japan, and South Korea), South America (Brazil), and Rest of World (ROW)

Published: Jun 2024 167 Pages SKU: IRTNTR45000

Market Overview at a Glance

$3.70 B
Market Opportunity
25.2%
CAGR
19.78
YoY growth 2023-2024(%)

Liquid Biopsy Market Size 2024-2028

The liquid biopsy market size is valued to increase USD 3.7 billion, at a CAGR of 25.2% from 2023 to 2028. Increasing incidence of cancer will drive the liquid biopsy market.

Major Market Trends & Insights

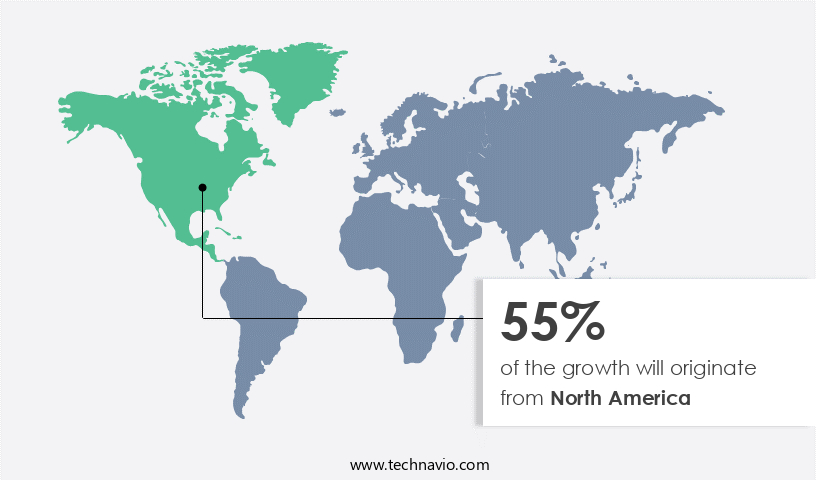
  • North America dominated the market and accounted for a 55% growth during the forecast period.
  • By Application - Cancer applications segment was valued at USD 812.70 billion in 2022
  • By Technology - CTC and ctDNA segment accounted for the largest market revenue share in 2022

Market Size & Forecast

  • Market Opportunities: USD 473.71 million
  • Market Future Opportunities: USD 3696.40 million
  • CAGR : 25.2%
  • North America: Largest market in 2022

Market Summary

  • The market represents a significant and rapidly expanding sector in the healthcare industry, driven by advancements in cancer diagnostics and research. This market encompasses various core technologies, including next-generation sequencing and polymerase chain reaction, and applications, such as early detection and monitoring of cancer. Service types range from testing and analysis to consulting and education. Despite the market's growth, challenges persist, including limited reimbursement and regulatory hurdles. However, increasing funding and investment in liquid biopsy technologies continue to fuel innovation and expansion.
  • For instance, according to a recent report, The market is projected to reach a 30% market share in the in vitro diagnostics market by 2026. This underscores the evolving nature of the market and the opportunities it presents for stakeholders.

What will be the Size of the Liquid Biopsy Market during the forecast period?

Liquid Biopsy Market Size

Get Key Insights on Market Forecast (PDF) Request Free Sample

How is the Liquid Biopsy Market Segmented and what are the key trends of market segmentation?

The liquid biopsy industry research report provides comprehensive data (region-wise segment analysis), with forecasts and estimates in "USD million" for the period 2024-2028, as well as historical data from 2018-2022 for the following segments.

  • Application
    • Cancer applications
    • Non-cancer applications
  • Technology
    • CTC and ctDNA
    • Exosome and RNA
  • Sample Type
    • Blood
    • Urine
    • Cerebrospinal Fluid (CSF)
    • Others
  • Cancer Type
    • Lung
    • Breast
    • Colorectal
    • Prostate
    • Others.
  • End-User
    • Hospitals & Clinics
    • Diagnostic Labs
    • Research Institutes
    • Pharma/Biotech.
  • Geography
    • North America
      • US
      • Canada
    • Europe
      • Germany
      • UK
    • Middle East and Africa
      • UAE
    • APAC
      • Australia
      • India
      • Japan
      • South Korea
    • South America
      • Brazil
    • Rest of World (ROW)

By Application Insights

The cancer applications segment is estimated to witness significant growth during the forecast period.

Liquid biopsy, a revolutionary approach in cancer diagnostics and monitoring, has gained significant traction in the healthcare industry. This non-invasive method allows for the detection and analysis of cancer-related biomarkers from a patient's blood or other bodily fluids. The global market for liquid biopsy is thriving, with next-generation sequencing (NGS) and multiplex assays driving its growth. Personalized medicine is a key application of liquid biopsy, as it enables the identification of circulating RNA, protein biomarkers, and ctDNA mutations. Patient stratification is another significant application, as it helps in the early detection of cancer subtypes and disease progression. NGS sequencing, RNA sequencing, and digital PCR are essential techniques used in liquid biopsy for genomic profiling and mutation burden analysis.

Sample preparation, epigenetic alterations, and tumor heterogeneity are ongoing challenges in the market. However, advancements in tumor-derived vesicles isolation, CTC enrichment, and exosomes isolation are addressing these challenges. Proteomic analysis and miRNA profiling are also gaining popularity in liquid biopsy, offering insights into drug resistance and therapeutic response. The market is expected to grow substantially, with an estimated 25% of oncology testing shifting from tissue to liquid biopsy by 2025. Furthermore, the market for non-invasive diagnostics is projected to reach a value of USD20 billion by 2027. These trends underscore the continuous evolution and unfolding of the market, offering immense opportunities for businesses and investors.

In conclusion, liquid biopsy is a game-changer in cancer diagnostics and monitoring, offering a non-invasive method for detecting and analyzing cancer-related biomarkers. The market is thriving, with significant growth expected in the coming years. Businesses and investors can capitalize on this trend by focusing on innovations in liquid biopsy techniques, sample preparation, and biomarker analysis.

Liquid Biopsy Market Size

Request Free Sample

The Cancer applications segment was valued at USD 812.70 billion in 2018 and showed a gradual increase during the forecast period.

Liquid Biopsy Market Size

Request Free Sample

Regional Analysis

North America is estimated to contribute 55% to the growth of the global market during the forecast period.Technavio's analysts have elaborately explained the regional trends and drivers that shape the market during the forecast period.

Liquid Biopsy Market Share by Geography

See How Liquid Biopsy Market Demand is Rising in North America Request Free Sample

The North American market dominates the global liquid biopsy industry, with the US and Canada contributing significantly to its share. Key players like Biocept, Guardant Health, and Myriad Genetics derive substantial revenues from this region and maintain headquarters here. The region's market growth is fueled by factors such as the rising number of cancer cases, increasing adoption of advanced biopsy tests, a growing older population, and substantial investments in cancer screening and anti-cancer drug development.

This trend is expected to continue, solidifying North America's position as a major player in the market.

Market Dynamics

Our researchers analyzed the data with 2023 as the base year, along with the key drivers, trends, and challenges. A holistic analysis of drivers will help companies refine their marketing strategies to gain a competitive advantage.

The market is experiencing significant growth due to its potential in revolutionizing cancer diagnosis and treatment. This innovative approach allows for the detection of circulating tumor cells (CTCs) and cell-free DNA (cfDNA) from various body fluids, including plasma. CTDNA detection sensitivity has been a key focus, with advancements in NGS panel design for liquid biopsy enabling more accurate and comprehensive genomic profiling. Two primary techniques for CTC enrichment are exosome isolation methods comparison and circulating tumor cells enrichment techniques. Exosomes, small extracellular vesicles, carry tumor-associated RNA and proteins, making them valuable for RNA sequencing in liquid biopsy and DNA methylation analysis in cancer.

On the other hand, CTC enrichment techniques, such as size-based filtration and immunomagnetic separation, isolate intact CTCs for proteomic profiling and therapeutic response monitoring with liquid biopsy. The plasma biomarker discovery pipeline is another crucial aspect of the market. Multiplexed assays for early cancer detection, such as miRNA profiling in cancer detection, have shown promising results in identifying cancer at its earliest stages. Furthermore, liquid biopsy plays a pivotal role in minimal residual disease assessment and drug resistance prediction, enabling personalized oncology and patient stratification using liquid biopsy markers. A significant number of companies are investing in liquid biopsy technology, with a notable trend towards non-invasive prenatal testing.

The diagnostic accuracy of cell-free DNA is a critical factor in its growing adoption, particularly in cases where traditional methods are invasive or less effective. However, the market faces challenges in clinical validation of liquid biopsy assays and addressing tumor heterogeneity assessment using liquid biopsy. Despite the competition, a minority of players dominate the high-end instrument market, accounting for over 40% of the total revenue. This highlights the importance of continued innovation and clinical validation in the market.

Liquid Biopsy Market Size

What are the key market drivers leading to the rise in the adoption of Liquid Biopsy Industry?

  • The rising prevalence of cancer significantly contributes to the growth of the market. 
  • Cancer is a significant health concern, characterized by the abnormal division and growth of cells, influenced by a combination of hereditary and environmental factors. Over 80 distinct types of cancer exist, significantly impacting individuals worldwide. Among these, lung, liver, colon, stomach, and breast cancers are the most prevalent. Cancer ranks as a leading cause of morbidity globally, with European Commission estimates indicating that it affects men slightly more than women, accounting for 54% of new cases and 56% of related deaths in 2020.
  • This continuous health challenge underscores the importance of ongoing research and advancements in cancer diagnosis, treatment, and prevention.

What are the market trends shaping the Liquid Biopsy Industry?

  • Liquid biopsy is an emerging trend in the healthcare industry, with increasing funding and investment being allocated to its development.
  • Liquid biopsy, an innovative diagnostic technology, has gained significant traction in recent years due to its potential as a research tool and advanced diagnostics solution. This market expansion has attracted substantial investment for the research and development of new technologies and the commercialization of liquid biopsy products. Notable companies, such as GRAIL, Guardant Health, Exosome Diagnostics, Pathway Genomics, and Inivata, have secured funding from various investors. For instance, Dxcover raised USD14.34 million in Series A and grant financing in February 2023. This funding supports the ongoing development of Dxcover's liquid biopsy platform for the detection of early-stage cancers, including brain and colorectal cancers.
  • These investments are anticipated to fuel the expansion of the market throughout the forecast period.

What challenges does the Liquid Biopsy Industry face during its growth?

  • The limited reimbursement for liquid biopsy procedures poses a significant challenge to the industry's growth trajectory. This issue, which significantly affects the financial viability of implementing and expanding the use of this advanced diagnostic technology, remains a key concern for industry stakeholders. 
  • The market for reimbursement and treatment monitoring in liquid biopsy is currently in a state of evolution, with varying adoption rates and reimbursement policies across sectors and geographies. In developed countries, the technology is gaining traction, while in developing nations, there is a significant market potential. However, reimbursement for liquid biopsy tests is not guaranteed, even after approval, due to its novelty and unproven status. Coverage depends on factors like the type of cancer, screening procedure, and therapy. In developed countries, reimbursement levels are low, while in some developing countries, it is non-existent.
  • The market is a burgeoning field, with high adoption in developed countries and substantial growth opportunities in developing regions. It is essential to navigate the complexities of this market to optimize reimbursement and treatment monitoring strategies.

Exclusive Technavio Analysis on Customer Landscape

The liquid biopsy market forecasting report includes the adoption lifecycle of the market, covering from the innovator's stage to the laggard's stage. It focuses on adoption rates in different regions based on penetration. Furthermore, the liquid biopsy market report also includes key purchase criteria and drivers of price sensitivity to help companies evaluate and develop their market growth analysis strategies.

Liquid Biopsy Market Share by Geography

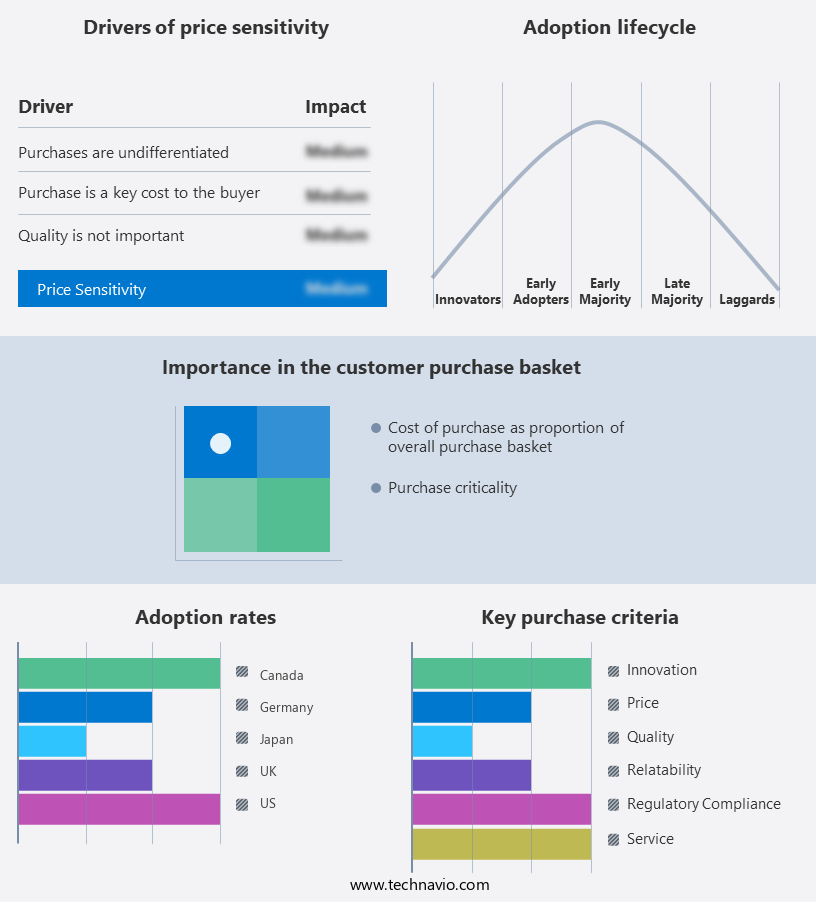
 Customer Landscape of Liquid Biopsy Industry

Competitive Landscape

Companies are implementing various strategies, such as strategic alliances, liquid biopsy market forecast, partnerships, mergers and acquisitions, geographical expansion, and product/service launches, to enhance their presence in the industry.

A. Menarini Industrie Farmaceutiche Riunite Srl - The CELLSEARCH CTC Test is a groundbreaking liquid biopsy solution that identifies and isolates circulating tumor cells from a patient's blood sample, providing valuable diagnostic and prognostic information for various types of cancer. This advanced technology enables oncologists to monitor disease progression and response to treatment more effectively.

The industry research and growth report includes detailed analyses of the competitive landscape of the market and information about key companies, including:

  • A. Menarini Industrie Farmaceutiche Riunite Srl
  • ANGLE Plc
  • Bio Rad Laboratories Inc.
  • Bio Techne Corp.
  • Biocept Inc.
  • Biodesix Inc.
  • CellMax Inc.
  • CIRCULOGENE
  • Exact Sciences Corp.
  • F. Hoffmann La Roche Ltd.
  • Guardant Health Inc.
  • Illumina Inc.
  • Inivata Ltd.
  • MDXHEALTH SA
  • Mesa Laboratories Inc.
  • Myriad Genetics Inc.
  • Novogene Co. Ltd.
  • OncoCyte Corp.
  • QIAGEN NV
  • SAGA Diagnostics AB

Qualitative and quantitative analysis of companies has been conducted to help clients understand the wider business environment as well as the strengths and weaknesses of key industry players. Data is qualitatively analyzed to categorize companies as pure play, category-focused, industry-focused, and diversified; it is quantitatively analyzed to categorize companies as dominant, leading, strong, tentative, and weak.

Recent Development and News in Liquid Biopsy Market

  • In January 2024, Thermo Fisher Scientific, a leading biotech company, announced the launch of its Oncomine Lung cfDNA Assay, a liquid biopsy test designed for the detection and monitoring of lung cancer through circulating tumor DNA (ctDNA) in plasma. This test is expected to enhance early detection and improve patient outcomes (Thermo Fisher Scientific Press Release).
  • In March 2024, Illumina, a global leader in genomic sequencing and array-based solutions, entered into a strategic collaboration with Grail, a leading liquid biopsy company, to develop and commercialize multi-cancer early detection tests. This collaboration aims to leverage Illumina's sequencing technologies and Grail's clinical expertise to bring innovative liquid biopsy solutions to the market (Illumina Press Release).
  • In May 2024, Guardant Health, a leading liquid biopsy company, raised USD300 million in a Series E funding round, bringing the total funding raised to over USD1 billion. The funds will be used to expand commercial operations, accelerate product development, and invest in research and development (Guardant Health Press Release).
  • In April 2025, the US Food and Drug Administration (FDA) granted marketing authorization to Qiagen's therascreen KRAS RGQ PCR Kit, a liquid biopsy test for the detection of KRAS gene mutations in circulating tumor DNA from various solid tumors. This approval marks a significant milestone in the market, as it represents the first FDA approval for a companion diagnostic liquid biopsy test (Qiagen Press Release).

Dive into Technavio's robust research methodology, blending expert interviews, extensive data synthesis, and validated models for unparalleled Liquid Biopsy Market insights. See full methodology.

Market Scope

Report Coverage

Details

Page number

167

Base year

2023

Historic period

2018-2022

Forecast period

2024-2028

Growth momentum & CAGR

Accelerate at a CAGR of 25.2%

Market growth 2024-2028

USD 3696.4 million

Market structure

Fragmented

YoY growth 2023-2024(%)

19.78

Key countries

US, Canada, Germany, UK, Japan, India, Australia, South Korea, UAE, Brazil, and Rest of World (RoW)

Competitive landscape

Leading Companies, Market Positioning of Companies, Competitive Strategies, and Industry Risks

Request Free Sample

Research Analyst Overview

  • In the rapidly advancing field of healthcare diagnostics, next-generation sequencing (NGS) is revolutionizing the approach to personalized medicine. The integration of NGS technology into liquid biopsy techniques has led to significant strides in the detection and monitoring of various cancer types. Protein biomarkers and circulating RNA, including ctDNA mutation detection, have emerged as crucial components of this evolving landscape. Patient stratification, facilitated by these advanced techniques, is enabling more effective therapeutic response and improved cancer monitoring. NGS sequencing and multiplex assays have become essential tools for identifying mutation burden and epigenetic alterations, providing valuable insights into tumor heterogeneity and drug resistance.
  • RNA sequencing and sample preparation methods have expanded the scope of liquid biopsy, allowing for the detection of cancer subtypes and disease progression. The application of proteomic analysis, plasma biomarkers, and microrna profiling to liquid biopsy further enhances its potential. Minimal residual disease and tumor-derived vesicles are increasingly being targeted for early cancer detection and non-invasive diagnostics. Liquid biopsy techniques have shown promise in the detection of circulating tumor cells, exosomes isolation, and digital PCR. These advancements contribute to the ongoing evolution of cancer care, offering new opportunities for early detection, personalized treatment, and improved patient outcomes. The integration of liquid biopsy into genomic profiling and targeted therapy is a significant development in the field of oncology.
  • The continuous unfolding of market activities and evolving patterns in this area reflect the growing importance of these techniques in cancer care.

What are the Key Data Covered in this Liquid Biopsy Market Research and Growth Report?

  • What is the expected growth of the Liquid Biopsy Market between 2024 and 2028?

    • USD 3.7 billion, at a CAGR of 25.2%

  • What segmentation does the market report cover?

    • The report segmented by Application (Cancer applications and Non-cancer applications), Technology (CTC and ctDNA and Exosome and RNA), Geography (North America, Europe, Asia, and Rest of World (ROW)), Sample Type (Blood, Urine, Cerebrospinal Fluid (CSF), and Others), Cancer Type (Lung, Breast, Colorectal, Prostate, and Others.), and End-User (Hospitals & Clinics, Diagnostic Labs, Research Institutes, and Pharma/Biotech.)

  • Which regions are analyzed in the report?

    • North America, Europe, Asia, and Rest of World (ROW)

  • What are the key growth drivers and market challenges?

    • Increasing incidence of cancer, Limited reimbursement for liquid biopsy

  • Who are the major players in the Liquid Biopsy Market?

    • Key Companies A. Menarini Industrie Farmaceutiche Riunite Srl, ANGLE Plc, Bio Rad Laboratories Inc., Bio Techne Corp., Biocept Inc., Biodesix Inc., CellMax Inc., CIRCULOGENE, Exact Sciences Corp., F. Hoffmann La Roche Ltd., Guardant Health Inc., Illumina Inc., Inivata Ltd., MDXHEALTH SA, Mesa Laboratories Inc., Myriad Genetics Inc., Novogene Co. Ltd., OncoCyte Corp., QIAGEN NV, and SAGA Diagnostics AB

Market Research Insights

  • The market encompasses cancer diagnostics utilizing non-invasive blood-based testing for disease monitoring, treatment selection, and early detection. This sector continues to advance with significant strides in assay development, biomarker discovery, and data analysis. The limit of detection for these tests has decreased, enabling the identification of minimal residual disease and predictive biomarkers. Personalized oncology and precision medicine applications are gaining traction, with clinical trials underway to validate the clinical utility of these approaches. Assay performance and diagnostic accuracy are crucial factors driving market growth. For instance, molecular diagnostics based on next-generation sequencing (NGS) workflow have shown analytical validity in detecting genetic mutations associated with various cancers.
  • Prognostic and diagnostic biomarkers play a pivotal role in cancer prognosis and treatment monitoring. The integration of NGS technology in liquid biopsy assays is expected to enhance assay development and regulatory approval processes. Sample processing techniques have improved, ensuring high-quality data for clinical validation. The market's potential is substantial, with an estimated 15 million liquid biopsy tests projected to be performed annually by 2025, up from 3 million in 2020. This growth signifies a promising future for this evolving and dynamic market.

We can help! Our analysts can customize this liquid biopsy market research report to meet your requirements.

Get in touch

1 Executive Summary

  • 1.1 Market overview
    • Executive Summary - Chart on Market Overview
    • Executive Summary - Data Table on Market Overview
    • Executive Summary - Chart on Global Market Characteristics
    • Executive Summary - Chart on Market by Geography
    • Executive Summary - Chart on Market Segmentation by Application
    • Executive Summary - Chart on Market Segmentation by Technology
    • Executive Summary - Chart on Incremental Growth
    • Executive Summary - Data Table on Incremental Growth
    • Executive Summary - Chart on Company Market Positioning

2 Market Landscape

  • 2.1 Market ecosystem
    • Parent Market
    • Data Table on - Parent Market
  • 2.2 Market characteristics
    • Market characteristics analysis
  • 2.3 Value chain analysis
    • Value Chain Analysis

3 Market Sizing

  • 3.1 Market definition
    • Offerings of companies included in the market definition
  • 3.2 Market segment analysis
    • Market segments
  • 3.3 Market size 2023
    • 3.4 Market outlook: Forecast for 2023-2028
      • Chart on Global - Market size and forecast 2023-2028 ($ million)
      • Data Table on Global - Market size and forecast 2023-2028 ($ million)
      • Chart on Global Market: Year-over-year growth 2023-2028 (%)
      • Data Table on Global Market: Year-over-year growth 2023-2028 (%)

    4 Historic Market Size

    • 4.1 Global Liquid Biopsy Market 2018 - 2022
      • Historic Market Size - Data Table on Global Liquid Biopsy Market 2018 - 2022 ($ million)
    • 4.2 Application segment analysis 2018 - 2022
      • Historic Market Size - Application Segment 2018 - 2022 ($ million)
    • 4.3 Technology segment analysis 2018 - 2022
      • Historic Market Size - Technology Segment 2018 - 2022 ($ million)
    • 4.4 Geography segment analysis 2018 - 2022
      • Historic Market Size - Geography Segment 2018 - 2022 ($ million)
    • 4.5 Country segment analysis 2018 - 2022
      • Historic Market Size - Country Segment 2018 - 2022 ($ million)

    5 Five Forces Analysis

    • 5.1 Five forces summary
      • Five forces analysis - Comparison between 2023 and 2028
    • 5.2 Bargaining power of buyers
      • Bargaining power of buyers - Impact of key factors 2023 and 2028
    • 5.3 Bargaining power of suppliers
      • Bargaining power of suppliers - Impact of key factors in 2023 and 2028
    • 5.4 Threat of new entrants
      • Threat of new entrants - Impact of key factors in 2023 and 2028
    • 5.5 Threat of substitutes
      • Threat of substitutes - Impact of key factors in 2023 and 2028
    • 5.6 Threat of rivalry
      • Threat of rivalry - Impact of key factors in 2023 and 2028
    • 5.7 Market condition
      • Chart on Market condition - Five forces 2023 and 2028

    6 Market Segmentation by Application

    • 6.1 Market segments
      • Chart on Application - Market share (2023-2028) (%)
      • Data Table on Application - Market share (2023-2028) (%)
    • 6.2 Comparison by Application
      • Chart on Comparison by Application
      • Data Table on Comparison by Application
    • 6.3 Cancer applications - Market size and forecast (2023-2028)
      • Chart on Cancer applications - Market size and forecast (2023-2028) ($ million)
      • Data Table on Cancer applications - Market size and forecast (2023-2028) ($ million)
      • Chart on Cancer applications - Year-over-year growth (2023-2028) (%)
      • Data Table on Cancer applications - Year-over-year growth (2023-2028) (%)
    • 6.4 Non-cancer applications - Market size and forecast (2023-2028)
      • Chart on Non-cancer applications - Market size and forecast (2023-2028) ($ million)
      • Data Table on Non-cancer applications - Market size and forecast (2023-2028) ($ million)
      • Chart on Non-cancer applications - Year-over-year growth (2023-2028) (%)
      • Data Table on Non-cancer applications - Year-over-year growth (2023-2028) (%)
    • 6.5 Market opportunity by Application
      • Market opportunity by Application ($ million)
      • Data Table on Market opportunity by Application ($ million)

    7 Market Segmentation by Technology

    • 7.1 Market segments
      • Chart on Technology - Market share (2023-2028) (%)
      • Data Table on Technology - Market share (2023-2028) (%)
    • 7.2 Comparison by Technology
      • Chart on Comparison by Technology
      • Data Table on Comparison by Technology
    • 7.3 CTC and ctDNA - Market size and forecast (2023-2028)
      • Chart on CTC and ctDNA - Market size and forecast (2023-2028) ($ million)
      • Data Table on CTC and ctDNA - Market size and forecast (2023-2028) ($ million)
      • Chart on CTC and ctDNA - Year-over-year growth (2023-2028) (%)
      • Data Table on CTC and ctDNA - Year-over-year growth (2023-2028) (%)
    • 7.4 Exosome and RNA - Market size and forecast (2023-2028)
      • Chart on Exosome and RNA - Market size and forecast (2023-2028) ($ million)
      • Data Table on Exosome and RNA - Market size and forecast (2023-2028) ($ million)
      • Chart on Exosome and RNA - Year-over-year growth (2023-2028) (%)
      • Data Table on Exosome and RNA - Year-over-year growth (2023-2028) (%)
    • 7.5 Market opportunity by Technology
      • Market opportunity by Technology ($ million)
      • Data Table on Market opportunity by Technology ($ million)

    8 Market Segmentation by Sample Type

    • 8.1 Market segments
      • Chart on Sample Type - Market share (2023-2028) (%)
      • Data Table on Sample Type - Market share (2023-2028) (%)
    • 8.2 Comparison by Sample Type
      • Chart on Comparison by Sample Type
      • Data Table on Comparison by Sample Type
    • 8.3 Blood - Market size and forecast (2023-2028)
      • Chart on Blood - Market size and forecast (2023-2028) ($ million)
      • Data Table on Blood - Market size and forecast (2023-2028) ($ million)
      • Chart on Blood - Year-over-year growth (2023-2028) (%)
      • Data Table on Blood - Year-over-year growth (2023-2028) (%)
    • 8.4 Urine - Market size and forecast (2023-2028)
      • Chart on Urine - Market size and forecast (2023-2028) ($ million)
      • Data Table on Urine - Market size and forecast (2023-2028) ($ million)
      • Chart on Urine - Year-over-year growth (2023-2028) (%)
      • Data Table on Urine - Year-over-year growth (2023-2028) (%)
    • 8.5 Cerebrospinal Fluid (CSF) - Market size and forecast (2023-2028)
      • Chart on Cerebrospinal Fluid (CSF) - Market size and forecast (2023-2028) ($ million)
      • Data Table on Cerebrospinal Fluid (CSF) - Market size and forecast (2023-2028) ($ million)
      • Chart on Cerebrospinal Fluid (CSF) - Year-over-year growth (2023-2028) (%)
      • Data Table on Cerebrospinal Fluid (CSF) - Year-over-year growth (2023-2028) (%)
    • 8.6 Others - Market size and forecast (2023-2028)
      • Chart on Others - Market size and forecast (2023-2028) ($ million)
      • Data Table on Others - Market size and forecast (2023-2028) ($ million)
      • Chart on Others - Year-over-year growth (2023-2028) (%)
      • Data Table on Others - Year-over-year growth (2023-2028) (%)
    • 8.7 Market opportunity by Sample Type
      • Market opportunity by Sample Type ($ million)
      • Data Table on Market opportunity by Sample Type ($ million)

    9 Market Segmentation by Cancer Type

    • 9.1 Market segments
      • Chart on Cancer Type - Market share (2023-2028) (%)
      • Data Table on Cancer Type - Market share (2023-2028) (%)
    • 9.2 Comparison by Cancer Type
      • Chart on Comparison by Cancer Type
      • Data Table on Comparison by Cancer Type
    • 9.3 Lung - Market size and forecast (2023-2028)
      • Chart on Lung - Market size and forecast (2023-2028) ($ million)
      • Data Table on Lung - Market size and forecast (2023-2028) ($ million)
      • Chart on Lung - Year-over-year growth (2023-2028) (%)
      • Data Table on Lung - Year-over-year growth (2023-2028) (%)
    • 9.4 Breast - Market size and forecast (2023-2028)
      • Chart on Breast - Market size and forecast (2023-2028) ($ million)
      • Data Table on Breast - Market size and forecast (2023-2028) ($ million)
      • Chart on Breast - Year-over-year growth (2023-2028) (%)
      • Data Table on Breast - Year-over-year growth (2023-2028) (%)
    • 9.5 Colorectal - Market size and forecast (2023-2028)
      • Chart on Colorectal - Market size and forecast (2023-2028) ($ million)
      • Data Table on Colorectal - Market size and forecast (2023-2028) ($ million)
      • Chart on Colorectal - Year-over-year growth (2023-2028) (%)
      • Data Table on Colorectal - Year-over-year growth (2023-2028) (%)
    • 9.6 Prostate - Market size and forecast (2023-2028)
      • Chart on Prostate - Market size and forecast (2023-2028) ($ million)
      • Data Table on Prostate - Market size and forecast (2023-2028) ($ million)
      • Chart on Prostate - Year-over-year growth (2023-2028) (%)
      • Data Table on Prostate - Year-over-year growth (2023-2028) (%)
    • 9.7 Others. - Market size and forecast (2023-2028)
      • Chart on Others. - Market size and forecast (2023-2028) ($ million)
      • Data Table on Others. - Market size and forecast (2023-2028) ($ million)
      • Chart on Others. - Year-over-year growth (2023-2028) (%)
      • Data Table on Others. - Year-over-year growth (2023-2028) (%)
    • 9.8 Market opportunity by Cancer Type
      • Market opportunity by Cancer Type ($ million)
      • Data Table on Market opportunity by Cancer Type ($ million)

    10 Market Segmentation by End-User

    • 10.1 Market segments
      • Chart on End-User - Market share (2023-2028) (%)
      • Data Table on End-User - Market share (2023-2028) (%)
    • 10.2 Comparison by End-User
      • Chart on Comparison by End-User
      • Data Table on Comparison by End-User
    • 10.3 Hospitals & Clinics - Market size and forecast (2023-2028)
      • Chart on Hospitals & Clinics - Market size and forecast (2023-2028) ($ million)
      • Data Table on Hospitals & Clinics - Market size and forecast (2023-2028) ($ million)
      • Chart on Hospitals & Clinics - Year-over-year growth (2023-2028) (%)
      • Data Table on Hospitals & Clinics - Year-over-year growth (2023-2028) (%)
    • 10.4 Diagnostic Labs - Market size and forecast (2023-2028)
      • Chart on Diagnostic Labs - Market size and forecast (2023-2028) ($ million)
      • Data Table on Diagnostic Labs - Market size and forecast (2023-2028) ($ million)
      • Chart on Diagnostic Labs - Year-over-year growth (2023-2028) (%)
      • Data Table on Diagnostic Labs - Year-over-year growth (2023-2028) (%)
    • 10.5 Research Institutes - Market size and forecast (2023-2028)
      • Chart on Research Institutes - Market size and forecast (2023-2028) ($ million)
      • Data Table on Research Institutes - Market size and forecast (2023-2028) ($ million)
      • Chart on Research Institutes - Year-over-year growth (2023-2028) (%)
      • Data Table on Research Institutes - Year-over-year growth (2023-2028) (%)
    • 10.6 Pharma/Biotech. - Market size and forecast (2023-2028)
      • Chart on Pharma/Biotech. - Market size and forecast (2023-2028) ($ million)
      • Data Table on Pharma/Biotech. - Market size and forecast (2023-2028) ($ million)
      • Chart on Pharma/Biotech. - Year-over-year growth (2023-2028) (%)
      • Data Table on Pharma/Biotech. - Year-over-year growth (2023-2028) (%)
    • 10.7 Market opportunity by End-User
      • Market opportunity by End-User ($ million)
      • Data Table on Market opportunity by End-User ($ million)

    11 Customer Landscape

    • 11.1 Customer landscape overview
      • Analysis of price sensitivity, lifecycle, customer purchase basket, adoption rates, and purchase criteria

    12 Geographic Landscape

    • 12.1 Geographic segmentation
      • Chart on Market share by geography 2023-2028 (%)
      • Data Table on Market share by geography 2023-2028 (%)
    • 12.2 Geographic comparison
      • Chart on Geographic comparison
      • Data Table on Geographic comparison
    • 12.3 North America - Market size and forecast 2023-2028
      • Chart on North America - Market size and forecast 2023-2028 ($ million)
      • Data Table on North America - Market size and forecast 2023-2028 ($ million)
      • Chart on North America - Year-over-year growth 2023-2028 (%)
      • Data Table on North America - Year-over-year growth 2023-2028 (%)
    • 12.4 Europe - Market size and forecast 2023-2028
      • Chart on Europe - Market size and forecast 2023-2028 ($ million)
      • Data Table on Europe - Market size and forecast 2023-2028 ($ million)
      • Chart on Europe - Year-over-year growth 2023-2028 (%)
      • Data Table on Europe - Year-over-year growth 2023-2028 (%)
    • 12.5 Asia - Market size and forecast 2023-2028
      • Chart on Asia - Market size and forecast 2023-2028 ($ million)
      • Data Table on Asia - Market size and forecast 2023-2028 ($ million)
      • Chart on Asia - Year-over-year growth 2023-2028 (%)
      • Data Table on Asia - Year-over-year growth 2023-2028 (%)
    • 12.6 Rest of World (ROW) - Market size and forecast 2023-2028
      • Chart on Rest of World (ROW) - Market size and forecast 2023-2028 ($ million)
      • Data Table on Rest of World (ROW) - Market size and forecast 2023-2028 ($ million)
      • Chart on Rest of World (ROW) - Year-over-year growth 2023-2028 (%)
      • Data Table on Rest of World (ROW) - Year-over-year growth 2023-2028 (%)
    • 12.7 US - Market size and forecast 2023-2028
      • Chart on US - Market size and forecast 2023-2028 ($ million)
      • Data Table on US - Market size and forecast 2023-2028 ($ million)
      • Chart on US - Year-over-year growth 2023-2028 (%)
      • Data Table on US - Year-over-year growth 2023-2028 (%)
    • 12.8 Canada - Market size and forecast 2023-2028
      • Chart on Canada - Market size and forecast 2023-2028 ($ million)
      • Data Table on Canada - Market size and forecast 2023-2028 ($ million)
      • Chart on Canada - Year-over-year growth 2023-2028 (%)
      • Data Table on Canada - Year-over-year growth 2023-2028 (%)
    • 12.9 Germany - Market size and forecast 2023-2028
      • Chart on Germany - Market size and forecast 2023-2028 ($ million)
      • Data Table on Germany - Market size and forecast 2023-2028 ($ million)
      • Chart on Germany - Year-over-year growth 2023-2028 (%)
      • Data Table on Germany - Year-over-year growth 2023-2028 (%)
    • 12.10 UK - Market size and forecast 2023-2028
      • Chart on UK - Market size and forecast 2023-2028 ($ million)
      • Data Table on UK - Market size and forecast 2023-2028 ($ million)
      • Chart on UK - Year-over-year growth 2023-2028 (%)
      • Data Table on UK - Year-over-year growth 2023-2028 (%)
    • 12.11 Japan - Market size and forecast 2023-2028
      • Chart on Japan - Market size and forecast 2023-2028 ($ million)
      • Data Table on Japan - Market size and forecast 2023-2028 ($ million)
      • Chart on Japan - Year-over-year growth 2023-2028 (%)
      • Data Table on Japan - Year-over-year growth 2023-2028 (%)
    • 12.12 Market opportunity by geography
      • Market opportunity by geography ($ million)
      • Data Tables on Market opportunity by geography ($ million)
    • 12.13 India - Market size and forecast (2023-2028)
      • Chart on India - Market size and forecast (2023-2028) ($ million)
      • Data Table on India - Market size and forecast (2023-2028) ($ million)
      • Chart on India - Year-over-year growth (2023-2028) (%)
      • Data Table on India - Year-over-year growth (2023-2028) (%)
    • 12.14 Australia - Market size and forecast (2023-2028)
      • Chart on Australia - Market size and forecast (2023-2028) ($ million)
      • Data Table on Australia - Market size and forecast (2023-2028) ($ million)
      • Chart on Australia - Year-over-year growth (2023-2028) (%)
      • Data Table on Australia - Year-over-year growth (2023-2028) (%)
    • 12.15 South Korea - Market size and forecast (2023-2028)
      • Chart on South Korea - Market size and forecast (2023-2028) ($ million)
      • Data Table on South Korea - Market size and forecast (2023-2028) ($ million)
      • Chart on South Korea - Year-over-year growth (2023-2028) (%)
      • Data Table on South Korea - Year-over-year growth (2023-2028) (%)
    • 12.16 UAE - Market size and forecast (2023-2028)
      • Chart on UAE - Market size and forecast (2023-2028) ($ million)
      • Data Table on UAE - Market size and forecast (2023-2028) ($ million)
      • Chart on UAE - Year-over-year growth (2023-2028) (%)
      • Data Table on UAE - Year-over-year growth (2023-2028) (%)
    • 12.17 Brazil - Market size and forecast (2023-2028)
      • Chart on Brazil - Market size and forecast (2023-2028) ($ million)
      • Data Table on Brazil - Market size and forecast (2023-2028) ($ million)
      • Chart on Brazil - Year-over-year growth (2023-2028) (%)
      • Data Table on Brazil - Year-over-year growth (2023-2028) (%)
    • 12.18 Rest of World (RoW) - Market size and forecast (2023-2028)
      • Chart on Rest of World (RoW) - Market size and forecast (2023-2028) ($ million)
      • Data Table on Rest of World (RoW) - Market size and forecast (2023-2028) ($ million)
      • Chart on Rest of World (RoW) - Year-over-year growth (2023-2028) (%)
      • Data Table on Rest of World (RoW) - Year-over-year growth (2023-2028) (%)

    13 Drivers, Challenges, and Opportunity/Restraints

    • 13.1 Market drivers
      • 13.2 Market challenges
        • 13.3 Impact of drivers and challenges
          • Impact of drivers and challenges in 2023 and 2028
        • 13.4 Market opportunities/restraints

          14 Competitive Landscape

          • 14.1 Overview
            • 14.2 Competitive Landscape
              • Overview on criticality of inputs and factors of differentiation
            • 14.3 Landscape disruption
              • Overview on factors of disruption
            • 14.4 Industry risks
              • Impact of key risks on business

            15 Competitive Analysis

            • 15.1 Companies profiled
              • Companies covered
            • 15.2 Market positioning of companies
              • Matrix on companies position and classification
            • 15.3 A. Menarini Industrie Farmaceutiche Riunite Srl
              • A. Menarini Industrie Farmaceutiche Riunite Srl - Overview
              • A. Menarini Industrie Farmaceutiche Riunite Srl - Product / Service
              • A. Menarini Industrie Farmaceutiche Riunite Srl - Key offerings
            • 15.4 ANGLE Plc
              • ANGLE Plc - Overview
              • ANGLE Plc - Product / Service
              • ANGLE Plc - Key offerings
            • 15.5 Bio Techne Corp.
              • Bio Techne Corp. - Overview
              • Bio Techne Corp. - Business segments
              • Bio Techne Corp. - Key news
              • Bio Techne Corp. - Key offerings
              • Bio Techne Corp. - Segment focus
            • 15.6 Biocept Inc.
              • Biocept Inc. - Overview
              • Biocept Inc. - Product / Service
              • Biocept Inc. - Key offerings
            • 15.7 Biodesix Inc.
              • Biodesix Inc. - Overview
              • Biodesix Inc. - Product / Service
              • Biodesix Inc. - Key offerings
            • 15.8 CellMax Inc.
              • CellMax Inc. - Overview
              • CellMax Inc. - Product / Service
              • CellMax Inc. - Key offerings
            • 15.9 CIRCULOGENE
              • CIRCULOGENE - Overview
              • CIRCULOGENE - Product / Service
              • CIRCULOGENE - Key offerings
            • 15.10 Exact Sciences Corp.
              • Exact Sciences Corp. - Overview
              • Exact Sciences Corp. - Product / Service
              • Exact Sciences Corp. - Key news
              • Exact Sciences Corp. - Key offerings
            • 15.11 F. Hoffmann La Roche Ltd.
              • F. Hoffmann La Roche Ltd. - Overview
              • F. Hoffmann La Roche Ltd. - Business segments
              • F. Hoffmann La Roche Ltd. - Key news
              • F. Hoffmann La Roche Ltd. - Key offerings
              • F. Hoffmann La Roche Ltd. - Segment focus
            • 15.12 Guardant Health Inc.
              • Guardant Health Inc. - Overview
              • Guardant Health Inc. - Product / Service
              • Guardant Health Inc. - Key news
              • Guardant Health Inc. - Key offerings
            • 15.13 Illumina Inc.
              • Illumina Inc. - Overview
              • Illumina Inc. - Business segments
              • Illumina Inc. - Key news
              • Illumina Inc. - Key offerings
              • Illumina Inc. - Segment focus
            • 15.14 MDXHEALTH SA
              • MDXHEALTH SA - Overview
              • MDXHEALTH SA - Product / Service
              • MDXHEALTH SA - Key offerings
            • 15.15 Myriad Genetics Inc.
              • Myriad Genetics Inc. - Overview
              • Myriad Genetics Inc. - Product / Service
              • Myriad Genetics Inc. - Key news
              • Myriad Genetics Inc. - Key offerings
            • 15.16 QIAGEN NV
              • QIAGEN NV - Overview
              • QIAGEN NV - Product / Service
              • QIAGEN NV - Key news
              • QIAGEN NV - Key offerings
            • 15.17 SAGA Diagnostics AB
              • SAGA Diagnostics AB - Overview
              • SAGA Diagnostics AB - Product / Service
              • SAGA Diagnostics AB - Key offerings

            16 Appendix

            • 16.1 Scope of the report
              • 16.2 Inclusions and exclusions checklist
                • Inclusions checklist
                • Exclusions checklist
              • 16.3 Currency conversion rates for US$
                • Currency conversion rates for US$
              • 16.4 Research methodology
                • Research methodology
              • 16.5 Data procurement
                • Information sources
              • 16.6 Data validation
                • Data validation
              • 16.7 Validation techniques employed for market sizing
                • Validation techniques employed for market sizing
              • 16.8 Data synthesis
                • Data synthesis
              • 16.9 360 degree market analysis
                • 360 degree market analysis
              • 16.10 List of abbreviations
                • List of abbreviations

              Research Methodology

              Technavio presents a detailed picture of the market by way of study, synthesis, and summation of data from multiple sources. The analysts have presented the various facets of the market with a particular focus on identifying the key industry influencers. The data thus presented is comprehensive, reliable, and the result of extensive research, both primary and secondary.

              INFORMATION SOURCES

              Primary sources

              • Manufacturers and suppliers
              • Channel partners
              • Industry experts
              • Strategic decision makers

              Secondary sources

              • Industry journals and periodicals
              • Government data
              • Financial reports of key industry players
              • Historical data
              • Press releases

              DATA ANALYSIS

              Data Synthesis

              • Collation of data
              • Estimation of key figures
              • Analysis of derived insights

              Data Validation

              • Triangulation with data models
              • Reference against proprietary databases
              • Corroboration with industry experts

              REPORT WRITING

              Qualitative

              • Market drivers
              • Market challenges
              • Market trends
              • Five forces analysis

              Quantitative

              • Market size and forecast
              • Market segmentation
              • Geographical insights
              • Competitive landscape

              Interested in this report?

              Get your sample now to see our research methodology and insights!

              Download Now

              Frequently Asked Questions

              Liquid Biopsy market growth will increase by $ 3696.4 mn during 2024-2028.

              The Liquid Biopsy market is expected to grow at a CAGR of 25.2% during 2024-2028.

              Liquid Biopsy market is segmented by Application( Cancer applications, Non-cancer applications) Technology( CTC and ctDNA, Exosome and RNA, Exosome, RNA)

              A. Menarini Industrie Farmaceutiche Riunite Srl, ANGLE Plc, Bio Rad Laboratories Inc., Bio Techne Corp., Biocept Inc., Biodesix Inc., CellMax Inc., CIRCULOGENE, Exact Sciences Corp., F. Hoffmann La Roche Ltd., Guardant Health Inc., Illumina Inc., Inivata Ltd., MDXHEALTH SA, Mesa Laboratories Inc., Myriad Genetics Inc., Novogene Co. Ltd., OncoCyte Corp., QIAGEN NV, SAGA Diagnostics AB are a few of the key vendors in the Liquid Biopsy market.

              North America will register the highest growth rate of 55% among the other regions. Therefore, the Liquid Biopsy market in North America is expected to garner significant business opportunities for the vendors during the forecast period.

              US, Canada, Germany, UK, Japan, India, Australia, South Korea, UAE, Brazil, Rest of World (RoW)

              • Increasing incidence of cancerCancer changes the morphology of the human cells is the driving factor this market.
              • as it leads to uncontrolled division of cells that results from a combination of both environmental and hereditary risk factors. There are more than 80 types of cancers is the driving factor this market.
              • which have a major impact on the health and well-being of individuals globally. The most common type of cancers includes lung cancer is the driving factor this market.
              • liver cancer is the driving factor this market.
              • colon cancer is the driving factor this market.
              • stomach cancer is the driving factor this market.
              • and breast cancer. Cancer is one of the leading causes of morbidity globally. Lung cancer is the most common cancer globally. According to the European Commission estimates is the driving factor this market.
              • cancer affects men slightly more than women is the driving factor this market.
              • with 54% of new cases and 56% of deaths of men than women in 2020. The incidence of cancer is on the rise worldwide. The National Cancer Institute in the US reported that in 2020 is the driving factor this market.
              • an estimated 1.81 million new cases of cancer were diagnosed in the country is the driving factor this market.
              • along with 606 is the driving factor this market.
              • 520 associated deaths. The cancer mortality rate is higher among men than women (189.5 per 100 is the driving factor this market.
              • 000 men and 135.7 per 100 is the driving factor this market.
              • 000 women). When comparing groups based on race/ethnicity and sex is the driving factor this market.
              • cancer mortality is the highest in African American men (227.3 per 100 is the driving factor this market.
              • 000) and the lowest in Asian/Pacific Islander women (85.6 per 100 is the driving factor this market.
              • 000). The UK government is the driving factor this market.
              • under its NHS Long Term Plan is the driving factor this market.
              • provides funding for breast cancer screening and research studies. This initiative was started by the government to increase the uptake of screening procedures and introduce new technologies for screening. Colorectal cancer is the third most common cancer globally. The incidence of colorectal cancer has typically increased in low- and middle-income countries over recent years. Although the risk of the disease in adults aged below 50 years is relatively low compared to older adults is the driving factor this market.
              • the recent disease trends in young age groups are an indicator of risk factor exposures is the driving factor this market.
              • thereby foreshadowing future cancer burden.As per data released by the US National Cancer Institute is the driving factor this market.
              • adults over the age of 50 years have a cancer rate several times as high as the rate for adults in their twenties. Other cancers such as pancreatic cancer is the driving factor this market.
              • leukemia is the driving factor this market.
              • kidney and renal pelvis cancer is the driving factor this market.
              • bladder cancer is the driving factor this market.
              • rectum cancer is the driving factor this market.
              • bronchus cancer is the driving factor this market.
              • thyroid cancer is the driving factor this market.
              • endometrial cancer is the driving factor this market.
              • and non-Hodgkin lymphoma are also on the rise. The related risk factors of cancer is the driving factor this market.
              • such as aging is the driving factor this market.
              • smoking is the driving factor this market.
              • obesity is the driving factor this market.
              • alcohol intake is the driving factor this market.
              • overexposure to ultraviolet (UV) light is the driving factor this market.
              • infections such as human papillomavirus (HPV) is the driving factor this market.
              • and inherited faulty genes are also on the rise. Globally is the driving factor this market.
              • the older population is growing rapidly is the driving factor this market.
              • owing to the rise in average life expectancy. Older people are at high risk of cancer.End-users are increasingly preferring liquid biopsy over tissue biopsy is the driving factor this market.
              • as it is non-invasive and can detect the presence of various cancers more effectively using the individual's blood sample. It provides vital information to the oncologist to select the appropriate treatment methods is the driving factor this market.
              • including the type of surgery is the driving factor this market.
              • radiotherapy is the driving factor this market.
              • and drugs required for the treatment. Thus is the driving factor this market.
              • the increasing incidence of cancers will subsequently increase the diagnosis using the liquid biopsy method is the driving factor this market.
              • which is expected to drive the growth of the global liquid biopsy market during the forecast period. is the driving factor this market.

              The Liquid Biopsy market vendors should focus on grabbing business opportunities from the Cancer applications segment as it accounted for the largest market share in the base year.