Liver Cirrhosis Therapeutics Market Analysis North America, Europe, Asia, Rest of World (ROW) - US, Germany, UK, Japan, China - Size and Forecast 2024-2028

Liver Cirrhosis Therapeutics Market Analysis North America, Europe, Asia, Rest of World (ROW) - US, Germany, UK, Japan, China - Size and Forecast 2024-2028

Published: Nov 2023 154 Pages SKU: IRTNTR76818

Market Overview at a Glance

$1.94 B
Market Opportunity
5.58%
CAGR
4.57
YoY growth 2023-2024(%)

Liver Cirrhosis Therapeutics Market Size 2024-2028

The liver cirrhosis therapeutics market size is forecast to increase by USD 1.94 billion at a CAGR of 5.58% between 2023 and 2028.

  • The market is experiencing significant growth due to the rising incidence of liver cancer, which is a major cause of liver cirrhosis. According to the American Cancer Society, there will be an estimated 42,220 new cases of liver cancer in the United States alone in 2021. This trend is expected to continue, driving demand for effective therapeutic solutions. Another key trend in the market is the shift towards personalized medicine. With advances in genomic research and precision medicine, there is a growing opportunity for targeted therapies that cater to the unique needs of individual patients. However, the high cost of liver cirrhosis therapeutics remains a significant challenge.
  • Many existing treatments are expensive and may not be accessible to all patients, limiting their widespread adoption. Despite these challenges, the market presents significant opportunities for companies seeking to innovate and provide cost-effective solutions. Strategic collaborations, regulatory approvals, and investments in research and development are expected to drive growth in the market. Companies that can successfully navigate these challenges and deliver effective, affordable therapeutic options will be well-positioned to capitalize on the growing demand for liver cirrhosis treatments.

What will be the Size of the Liver Cirrhosis Therapeutics Market during the forecast period?

Liver Cirrhosis Therapeutics Market Size

 Request Free Sample

  • The market is experiencing significant activity due to the increasing prevalence of liver diseases, such as non-alcoholic fatty liver disease (NAFLD) and hepatocellular carcinoma (HCC). Novel drugs, including Vosevi and Mavyret, are gaining traction in the market as effective treatments for viral hepatitis B (HBV) and C. Research institutions, such as the American Association for the Study of Liver Diseases (AASLD), are actively engaged in exploring new treatments and therapies for liver cirrhosis, alcoholic liver disease, and chronic hepatitis. Anti-viral drugs are a key focus area in the market, as they offer effective solutions for treating hepatitis B and C.
  • The liver failure market, including cirrhosis, is witnessing a rise in research activities due to the high incidence of systemic inflammation and the need for advanced treatments. Molecular hepatology and frontiers in medicine are also contributing to the development of new therapeutics for liver diseases. Lifestyle factors, such as alcohol consumption, are major contributors to liver cirrhosis. The market for liver cirrhosis therapeutics is expected to grow as the demand for effective treatments for liver diseases continues to increase. The International Liver Transplant Society (ILTS) and other organizations are working to improve access to liver transplants and other advanced treatments for patients with liver cirrhosis.
  • The market for liver cirrhosis therapeutics is dynamic, with ongoing research and development in areas such as molecular hepatology and systemic inflammation. The use of advanced technologies and innovative approaches is driving the market forward, offering new opportunities for companies and investors. Key entities in the market include BMC Infectious Diseases, Cystic Fibrosis, Ildlt, and Veridos, among others. These organizations are contributing to the development of new treatments and therapies for liver diseases, including liver cirrhosis. The market for liver cirrhosis therapeutics is expected to continue growing as the demand for effective treatments increases and new technologies and approaches are developed.

How is this Liver Cirrhosis Therapeutics Industry segmented?

The liver cirrhosis therapeutics industry research report provides comprehensive data (region-wise segment analysis), with forecasts and estimates in "USD billion" for the period 2024-2028, as well as historical data from 2018-2022 for the following segments.

  • Type
    • Oral
    • Injection
  • End-user
    • Hospitals
    • Clinics
    • Research and academic institutes
  • Geography
    • North America
      • US
    • Europe
      • Germany
      • UK
    • Middle East and Africa
      • APAC
        • China
        • Japan
      • South America
        • Rest of World (ROW)

        By Type Insights

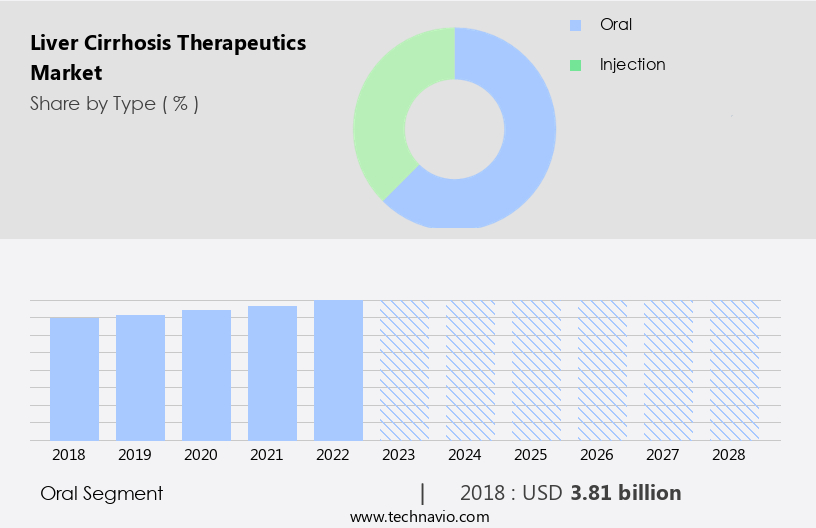
        The oral segment is estimated to witness significant growth during the forecast period.

        The liver cirrhosis treatment market is witnessing a significant shift towards oral medications, with obeticholic acid being a notable innovation. This trend is driven by the geriatric population's increasing preference for patient-friendly treatments and the convenience of oral administration. The demand for oral therapies, including those for non-alcoholic fatty liver disease (NAFLD) and antifibrotic medications, is on the rise. This development is influenced by the healthcare industry's focus on improving treatment adherence and the convenience that oral medications offer. The emergence of novel oral formulations targeting specific pathways in liver cirrhosis highlights the potential of this therapeutic approach.

        The hepatology community is actively researching new treatments for various liver diseases, such as hepatocellular carcinoma, chronic hepatitis, and cirrhosis. Academic institutes, hospitals, and clinics are investing in awareness programs and research activities to address the challenges posed by systemic inflammation, infections, and liver failure. Hepatitis B and C continue to be major health concerns, with the development of anti-viral drugs like Zepatier, Mavyret, and Vosevi offering promising solutions. The side-effects of medications and immunosuppressants used in liver transplants are significant market restraints. However, the potential for better treatment methods and the development of novel drugs, such as Alpha-1 antitrypsin and iLDLT, provide opportunities for growth.

        The role of hepatology journals, including the Hepatology journal, Frontiers in Medicine, and Molecular Hepatology, in disseminating research findings and advancing the field is invaluable. The market is also impacted by lifestyle factors, such as alcohol consumption and alcohol abuse, which contribute to liver cirrhosis and other liver diseases. The need for effective treatments for these conditions is pressing, and ongoing research into novel therapies and preventive measures is essential. The liver cirrhosis treatment market is a dynamic and evolving landscape, with a focus on improving patient outcomes and addressing the complex challenges posed by liver diseases.

        Liver Cirrhosis Therapeutics Market Size

        Get a glance at the market report of share of various segments Request Free Sample

        The Oral segment was valued at USD 3.81 billion in 2018 and showed a gradual increase during the forecast period.

        Regional Analysis

        North America is estimated to contribute 41% to the growth of the global market during the forecast period.Technavio’s analysts have elaborately explained the regional trends and drivers that shape the market during the forecast period.

        Liver Cirrhosis Therapeutics Market Share by Geography

        For more insights on the market size of various regions, Request Free Sample

        The market in the US is experiencing significant growth due to several factors. The elderly population, living with conditions such as hepatocellular carcinoma, chronic hepatitis, and cirrhosis, is expanding. This demographic shift increases the demand for effective liver cirrhosis treatments. Furthermore, the rapidly changing lifestyle, with its associated health risks like alcohol consumption and syphilis infections, contributes to the market's expansion. Pharmaceutical companies are investing heavily in research activities to develop novel drugs and improve treatment methods. For instance, FDA-approved Obeticholic acid is gaining popularity for its ability to treat liver fibrosis caused by non-alcoholic steatohepatitis (NASH). Other notable treatments include Mavyret for hepatitis C, Vosevi for hepatitis B, and immunosuppressants for liver transplants.

        Despite these advancements, market restraints persist. Side-effects of medications and the high cost of treatment remain significant challenges. However, awareness programs and academic institutes are working to address these issues. For example, the American Association for the Study of Liver Diseases (AASLD) and the International Liver Transplantation Society (ILTS) are actively promoting research and education in hepatology. Moreover, the healthcare infrastructure, including hospitals and clinics, is evolving to accommodate the increasing demand for liver cirrhosis treatment. Home care services and antibiotics for liver infections are also becoming more accessible. In summary, the market in the US is expanding due to the growing elderly population, increasing awareness, and advanced healthcare infrastructure.

        Despite challenges like side-effects and high costs, pharmaceutical companies and academic institutions are working to develop better treatment methods and make them more accessible.

        Market Dynamics

        Our researchers analyzed the data with 2023 as the base year, along with the key drivers, trends, and challenges. A holistic analysis of drivers will help companies refine their marketing strategies to gain a competitive advantage.

        What are the key market drivers leading to the rise in the adoption of Liver Cirrhosis Therapeutics Industry?

        • Increasing incidence of liver cancer is the key driver of the market. 

        • The market is experiencing significant growth due to the escalating prevalence of liver diseases, such as hepatitis and non-alcoholic fatty liver disease (NAFLD). According to the World Health Organization (WHO), approximately 325 million individuals worldwide are affected by viral hepatitis, increasing the risk of liver cirrhosis. Furthermore, the rising incidence of metabolic syndrome and obesity-related disorders, including NAFLD, is fueling the demand for effective treatments.
        • NAFLD currently impacts around 25% of the global population, emphasizing the importance of advanced and accessible therapies. The increasing risk of cirrhosis associated with specific liver diseases is projected to propel the expansion of the market during the forecast period.

        What are the market trends shaping the Liver Cirrhosis Therapeutics Industry?

        • Trend towards personalized medicine is the upcoming market trend. 

        • The market is witnessing a shift towards personalized medicine, which involves customizing treatment plans based on unique patient characteristics. This approach considers genetic composition, liver function, and medication response to maximize therapeutic results, minimize side effects, and enhance overall patient quality of life. For instance, genetic profiling can identify specific biomarkers influencing drug metabolism, enabling the prescription of optimal medications for individual patients.
        • This trend signifies a departure from the traditional one-size-fits-all strategy and a move towards improved patient outcomes and increased therapeutic efficacy in The market. The progression of precision medicine is leading this paradigm change.

        What challenges does the Liver Cirrhosis Therapeutics Industry face during its growth?

        • High cost of liver cirrhosis therapeutics is a key challenge affecting the industry growth. 

        • The market faces a significant challenge due to the high cost of treatments, which limits access for certain patient populations. Immunosuppressants and antiviral medications for hepatitis require extended courses, leading to increased healthcare expenses. Advanced therapies like liver transplantation, which can cure end-stage cirrhosis, come with substantial costs related to the surgery, post-procedure recovery, and lifelong immunosuppressive drugs. Individuals in regions with limited healthcare resources or inadequate coverage are disproportionately affected by this financial burden.
        • The high cost of liver cirrhosis treatments poses a significant barrier to effective care and underscores the need for affordable solutions and increased healthcare coverage.

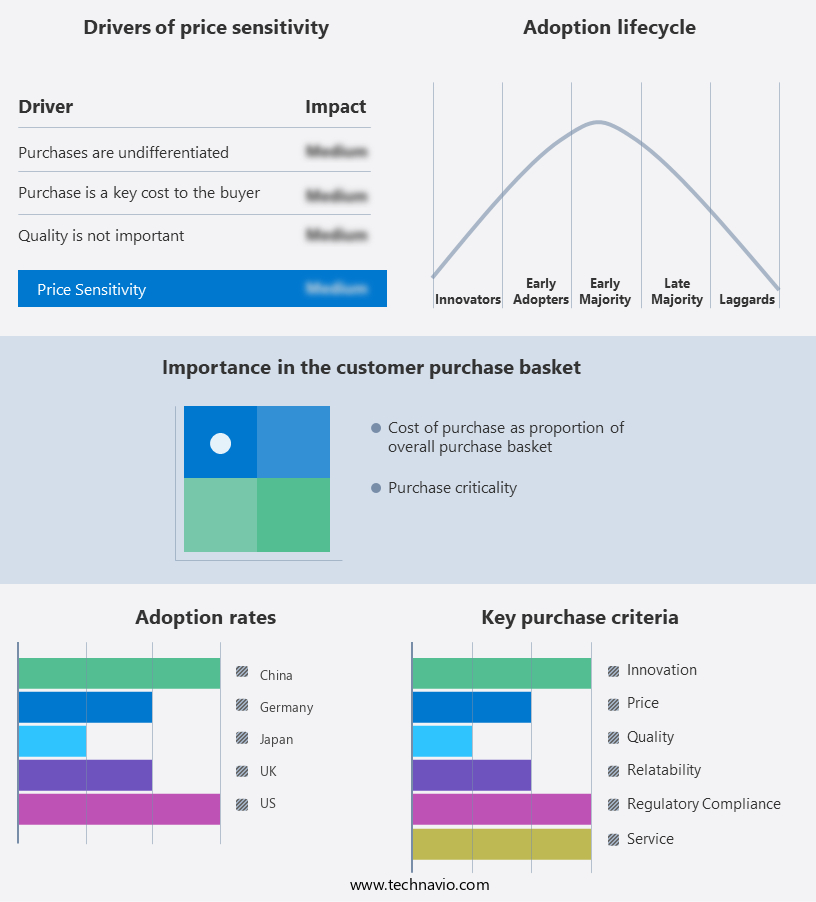
        Exclusive Customer Landscape

        The liver cirrhosis therapeutics market forecasting report includes the adoption lifecycle of the market, covering from the innovator’s stage to the laggard’s stage. It focuses on adoption rates in different regions based on penetration. Furthermore, the liver cirrhosis therapeutics market report also includes key purchase criteria and drivers of price sensitivity to help companies evaluate and develop their market growth analysis strategies.

        Liver Cirrhosis Therapeutics Market Share by Geography

         Customer Landscape

        Key Companies & Market Insights

        Companies are implementing various strategies, such as strategic alliances, liver cirrhosis therapeutics market forecast, partnerships, mergers and acquisitions, geographical expansion, and product/service launches, to enhance their presence in the industry.

        AbbVie Inc. - The company specializes in liver cirrhosis treatment through innovative siRNA-based targeted therapies, aimed at restoring functional liver cells for patients with advanced liver diseases. This approach focuses on inhibiting specific genes responsible for disease progression, offering a potential solution for those with end-stage liver conditions.

        The industry research and growth report includes detailed analyses of the competitive landscape of the market and information about key companies, including:

        • AbbVie Inc.
        • Alnylam Pharmaceuticals Inc.
        • Astellas Pharma Inc.
        • AstraZeneca Plc
        • CSL Ltd.
        • Eli Lilly and Co.
        • F. Hoffmann La Roche Ltd.
        • Gilead Sciences Inc.
        • GlaxoSmithKline Plc
        • Gwo Xi Stem Cell Applied Technology
        • Johnson and Johnson
        • Kezar Life Sciences Inc.
        • Merck KGaA
        • Novartis AG
        • Novo Nordisk AS
        • Pfizer Inc.
        • Protagonist Therapeutics Inc.
        • Tessera Therapeutics

        Qualitative and quantitative analysis of companies has been conducted to help clients understand the wider business environment as well as the strengths and weaknesses of key industry players. Data is qualitatively analyzed to categorize companies as pure play, category-focused, industry-focused, and diversified; it is quantitatively analyzed to categorize companies as dominant, leading, strong, tentative, and weak.

        Research Analyst Overview

        Liver cirrhosis, a chronic and progressive condition characterized by the replacement of healthy liver tissue with scar tissue, is a significant public health concern worldwide. The disease is often associated with various risk factors, including an elderly population, chronic hepatitis infections, alcohol consumption, and systemic inflammation. The market is experiencing robust growth due to the increasing burden of the disease and the need for better treatment methods. The elderly population is a major demographic affected by liver cirrhosis, as age is a well-established risk factor for the disease. With an aging population, the number of individuals diagnosed with liver cirrhosis is expected to rise, leading to a surge in demand for effective therapeutics.

        Chronic hepatitis infections, such as HBV and HCV, are another significant driver of the market. These infections can lead to cirrhosis if left untreated, making the development of effective antiviral drugs a priority. The rapidly changing lifestyle and increasing prevalence of alcohol abuse are also contributing to the growing burden of liver cirrhosis. Alcoholic liver disease is a leading cause of cirrhosis, and the market for therapeutics to treat this condition is expected to grow significantly. Syphilis, a sexually transmitted infection, can also lead to liver cirrhosis if left untreated, highlighting the importance of awareness programs and investment in research activities.

        Despite the progress made in the development of new drugs, such as Zepatier and Mavyret, market restraints remain. Side-effects of medications and the high cost of treatment are major challenges that need to be addressed. The liver diseases market is highly competitive, with several players vying for market share. Academic institutes and research organizations are also actively contributing to the development of novel drugs and treatment methods for liver cirrhosis. The liver cirrhosis treatment market is witnessing significant activity, with several new drugs and treatment methods under development. For instance, IL-1 receptor antagonist (IL-1Ra) and Alpha-1 antitrypsin have shown promise in treating cirrhosis.

        The use of home care and hospitals and clinics for the treatment of liver cirrhosis is also gaining popularity, as it offers several advantages, including improved patient outcomes and reduced healthcare costs. The market for liver cirrhosis therapeutics is expected to face several challenges in the coming years. The high cost of treatment and the side-effects of medications are major concerns, and addressing these challenges will require significant investment and research. The development of better treatment methods and the use of immunosuppressants and antibiotics to prevent infections in liver transplant patients are expected to offer significant opportunities for market growth.

        The liver diseases market is a complex and dynamic field, with several entities contributing to its evolution. The market is influenced by various factors, including demographic trends, lifestyle factors, research activities, and market dynamics. Understanding these factors and their impact on the market is crucial for stakeholders looking to invest in or enter the market. In conclusion, the market is experiencing robust growth due to the increasing burden of the disease and the need for better treatment methods. The market is influenced by several factors, including an aging population, chronic hepatitis infections, alcohol consumption, and research activities. Addressing the challenges of high cost and side-effects of medications will be crucial for market growth.

        The development of novel drugs and treatment methods, such as IL-1Ra and Alpha-1 antitrypsin, offers significant opportunities for market expansion. The liver diseases market is a complex and dynamic field, and understanding its evolution is crucial for stakeholders looking to invest or enter the market.

        Market Scope

        Report Coverage

        Details

        Page number

        154

        Base year

        2023

        Historic period

        2018-2022

        Forecast period

        2024-2028

        Growth momentum & CAGR

        Accelerate at a CAGR of 5.58%

        Market growth 2024-2028

        USD 1.94 billion

        Market structure

        Fragmented

        YoY growth 2023-2024(%)

        4.57

        Key countries

        US, Germany, UK, Japan, and China

        Competitive landscape

        Leading Companies, Market Positioning of Companies, Competitive Strategies, and Industry Risks

        Request Free Sample

        What are the Key Data Covered in this Liver Cirrhosis Therapeutics Market Research and Growth Report?

        • CAGR of the Liver Cirrhosis Therapeutics industry during the forecast period
        • Detailed information on factors that will drive the growth and forecasting between 2024 and 2028
        • Precise estimation of the size of the market and its contribution of the industry in focus to the parent market
        • Accurate predictions about upcoming growth and trends and changes in consumer behaviour
        • Growth of the market across North America, Europe, Asia, and Rest of World (ROW)
        • Thorough analysis of the market’s competitive landscape and detailed information about companies
        • Comprehensive analysis of factors that will challenge the liver cirrhosis therapeutics market growth of industry companies

        We can help! Our analysts can customize this liver cirrhosis therapeutics market research report to meet your requirements.

        Get in touch


        1 Executive Summary

        • 1.1 Market overview
          • Exhibit 01: Executive Summary – Chart on Market Overview
          • Exhibit 02: Executive Summary – Data Table on Market Overview
          • Exhibit 03: Executive Summary – Chart on Global Market Characteristics
          • Exhibit 04: Executive Summary – Chart on Market by Geography
          • Exhibit 05: Executive Summary – Chart on Market Segmentation by Type
          • Exhibit 06: Executive Summary – Chart on Market Segmentation by End-user
          • Exhibit 07: Executive Summary – Chart on Incremental Growth
          • Exhibit 08: Executive Summary – Data Table on Incremental Growth
          • Exhibit 09: Executive Summary – Chart on Vendor Market Positioning

        2 Market Landscape

        • 2.1 Market ecosystem
          • Exhibit 10: Parent market
          • Exhibit 11: Market Characteristics

        3 Market Sizing

        • 3.1 Market definition
          • Exhibit 12: Offerings of vendors included in the market definition
        • 3.2 Market segment analysis
          • Exhibit 13: Market segments
        • 3.3 Market size 2023
          • 3.4 Market outlook: Forecast for 2023-2028
            • Exhibit 14: Chart on Global - Market size and forecast 2023-2028 ($ billion)
            • Exhibit 15: Data Table on Global - Market size and forecast 2023-2028 ($ billion)
            • Exhibit 16: Chart on Global Market: Year-over-year growth 2023-2028 (%)
            • Exhibit 17: Data Table on Global Market: Year-over-year growth 2023-2028 (%)

          4 Historic Market Size

          • 4.1 Global liver cirrhosis therapeutics market 2018 - 2022
            • Exhibit 18: Historic Market Size – Data Table on global liver cirrhosis therapeutics market 2018 - 2022 ($ billion)
          • 4.2 Type Segment Analysis 2018 - 2022
            • Exhibit 19: Historic Market Size – Type Segment 2018 - 2022 ($ billion)
          • 4.3 End-user Segment Analysis 2018 - 2022
            • Exhibit 20: Historic Market Size – End-user Segment 2018 - 2022 ($ billion)
          • 4.4 Geography Segment Analysis 2018 - 2022
            • Exhibit 21: Historic Market Size – Geography Segment 2018 - 2022 ($ billion)
          • 4.5 Country Segment Analysis 2018 - 2022
            • Exhibit 22: Historic Market Size – Country Segment 2018 - 2022 ($ billion)

          5 Five Forces Analysis

          • 5.1 Five forces summary
            • Exhibit 23: Five forces analysis - Comparison between 2023 and 2028
          • 5.2 Bargaining power of buyers
            • Exhibit 24: Chart on Bargaining power of buyers – Impact of key factors 2023 and 2028
          • 5.3 Bargaining power of suppliers
            • Exhibit 25: Bargaining power of suppliers – Impact of key factors in 2023 and 2028
          • 5.4 Threat of new entrants
            • Exhibit 26: Threat of new entrants – Impact of key factors in 2023 and 2028
          • 5.5 Threat of substitutes
            • Exhibit 27: Threat of substitutes – Impact of key factors in 2023 and 2028
          • 5.6 Threat of rivalry
            • Exhibit 28: Threat of rivalry – Impact of key factors in 2023 and 2028
          • 5.7 Market condition
            • Exhibit 29: Chart on Market condition - Five forces 2023 and 2028

          6 Market Segmentation by Type

          • 6.1 Market segments
            • Exhibit 30: Chart on Type - Market share 2023-2028 (%)
            • Exhibit 31: Data Table on Type - Market share 2023-2028 (%)
          • 6.2 Comparison by Type
            • Exhibit 32: Chart on Comparison by Type
            • Exhibit 33: Data Table on Comparison by Type
          • 6.3 Oral - Market size and forecast 2023-2028
            • Exhibit 34: Chart on Oral - Market size and forecast 2023-2028 ($ billion)
            • Exhibit 35: Data Table on Oral - Market size and forecast 2023-2028 ($ billion)
            • Exhibit 36: Chart on Oral - Year-over-year growth 2023-2028 (%)
            • Exhibit 37: Data Table on Oral - Year-over-year growth 2023-2028 (%)
          • 6.4 Injection - Market size and forecast 2023-2028
            • Exhibit 38: Chart on Injection - Market size and forecast 2023-2028 ($ billion)
            • Exhibit 39: Data Table on Injection - Market size and forecast 2023-2028 ($ billion)
            • Exhibit 40: Chart on Injection - Year-over-year growth 2023-2028 (%)
            • Exhibit 41: Data Table on Injection - Year-over-year growth 2023-2028 (%)
          • 6.5 Market opportunity by Type
            • Exhibit 42: Market opportunity by Type ($ billion)
            • Exhibit 43: Data Table on Market opportunity by Type ($ billion)

          7 Market Segmentation by End-user

          • 7.1 Market segments
            • Exhibit 44: Chart on End-user - Market share 2023-2028 (%)
            • Exhibit 45: Data Table on End-user - Market share 2023-2028 (%)
          • 7.2 Comparison by End-user
            • Exhibit 46: Chart on Comparison by End-user
            • Exhibit 47: Data Table on Comparison by End-user
          • 7.3 Hospitals - Market size and forecast 2023-2028
            • Exhibit 48: Chart on Hospitals - Market size and forecast 2023-2028 ($ billion)
            • Exhibit 49: Data Table on Hospitals - Market size and forecast 2023-2028 ($ billion)
            • Exhibit 50: Chart on Hospitals - Year-over-year growth 2023-2028 (%)
            • Exhibit 51: Data Table on Hospitals - Year-over-year growth 2023-2028 (%)
          • 7.4 Clinics - Market size and forecast 2023-2028
            • Exhibit 52: Chart on Clinics - Market size and forecast 2023-2028 ($ billion)
            • Exhibit 53: Data Table on Clinics - Market size and forecast 2023-2028 ($ billion)
            • Exhibit 54: Chart on Clinics - Year-over-year growth 2023-2028 (%)
            • Exhibit 55: Data Table on Clinics - Year-over-year growth 2023-2028 (%)
          • 7.5 Research and academic institutes - Market size and forecast 2023-2028
            • Exhibit 56: Chart on Research and academic institutes - Market size and forecast 2023-2028 ($ billion)
            • Exhibit 57: Data Table on Research and academic institutes - Market size and forecast 2023-2028 ($ billion)
            • Exhibit 58: Chart on Research and academic institutes - Year-over-year growth 2023-2028 (%)
            • Exhibit 59: Data Table on Research and academic institutes - Year-over-year growth 2023-2028 (%)
          • 7.6 Market opportunity by End-user
            • Exhibit 60: Market opportunity by End-user ($ billion)
            • Exhibit 61: Data Table on Market opportunity by End-user ($ billion)

          8 Customer Landscape

          • 8.1 Customer landscape overview
            • Exhibit 62: Analysis of price sensitivity, lifecycle, customer purchase basket, adoption rates, and purchase criteria

          9 Geographic Landscape

          • 9.1 Geographic segmentation
            • Exhibit 63: Chart on Market share by geography 2023-2028 (%)
            • Exhibit 64: Data Table on Market share by geography 2023-2028 (%)
          • 9.2 Geographic comparison
            • Exhibit 65: Chart on Geographic comparison
            • Exhibit 66: Data Table on Geographic comparison
          • 9.3 North America - Market size and forecast 2023-2028
            • Exhibit 67: Chart on North America - Market size and forecast 2023-2028 ($ billion)
            • Exhibit 68: Data Table on North America - Market size and forecast 2023-2028 ($ billion)
            • Exhibit 69: Chart on North America - Year-over-year growth 2023-2028 (%)
            • Exhibit 70: Data Table on North America - Year-over-year growth 2023-2028 (%)
          • 9.4 Europe - Market size and forecast 2023-2028
            • Exhibit 71: Chart on Europe - Market size and forecast 2023-2028 ($ billion)
            • Exhibit 72: Data Table on Europe - Market size and forecast 2023-2028 ($ billion)
            • Exhibit 73: Chart on Europe - Year-over-year growth 2023-2028 (%)
            • Exhibit 74: Data Table on Europe - Year-over-year growth 2023-2028 (%)
          • 9.5 Asia - Market size and forecast 2023-2028
            • Exhibit 75: Chart on Asia - Market size and forecast 2023-2028 ($ billion)
            • Exhibit 76: Data Table on Asia - Market size and forecast 2023-2028 ($ billion)
            • Exhibit 77: Chart on Asia - Year-over-year growth 2023-2028 (%)
            • Exhibit 78: Data Table on Asia - Year-over-year growth 2023-2028 (%)
          • 9.6 Rest of World (ROW) - Market size and forecast 2023-2028
            • Exhibit 79: Chart on Rest of World (ROW) - Market size and forecast 2023-2028 ($ billion)
            • Exhibit 80: Data Table on Rest of World (ROW) - Market size and forecast 2023-2028 ($ billion)
            • Exhibit 81: Chart on Rest of World (ROW) - Year-over-year growth 2023-2028 (%)
            • Exhibit 82: Data Table on Rest of World (ROW) - Year-over-year growth 2023-2028 (%)
          • 9.7 US - Market size and forecast 2023-2028
            • Exhibit 83: Chart on US - Market size and forecast 2023-2028 ($ billion)
            • Exhibit 84: Data Table on US - Market size and forecast 2023-2028 ($ billion)
            • Exhibit 85: Chart on US - Year-over-year growth 2023-2028 (%)
            • Exhibit 86: Data Table on US - Year-over-year growth 2023-2028 (%)
          • 9.8 Germany - Market size and forecast 2023-2028
            • Exhibit 87: Chart on Germany - Market size and forecast 2023-2028 ($ billion)
            • Exhibit 88: Data Table on Germany - Market size and forecast 2023-2028 ($ billion)
            • Exhibit 89: Chart on Germany - Year-over-year growth 2023-2028 (%)
            • Exhibit 90: Data Table on Germany - Year-over-year growth 2023-2028 (%)
          • 9.9 UK - Market size and forecast 2023-2028
            • Exhibit 91: Chart on UK - Market size and forecast 2023-2028 ($ billion)
            • Exhibit 92: Data Table on UK - Market size and forecast 2023-2028 ($ billion)
            • Exhibit 93: Chart on UK - Year-over-year growth 2023-2028 (%)
            • Exhibit 94: Data Table on UK - Year-over-year growth 2023-2028 (%)
          • 9.10 Japan - Market size and forecast 2023-2028
            • Exhibit 95: Chart on Japan - Market size and forecast 2023-2028 ($ billion)
            • Exhibit 96: Data Table on Japan - Market size and forecast 2023-2028 ($ billion)
            • Exhibit 97: Chart on Japan - Year-over-year growth 2023-2028 (%)
            • Exhibit 98: Data Table on Japan - Year-over-year growth 2023-2028 (%)
          • 9.11 China - Market size and forecast 2023-2028
            • Exhibit 99: Chart on China - Market size and forecast 2023-2028 ($ billion)
            • Exhibit 100: Data Table on China - Market size and forecast 2023-2028 ($ billion)
            • Exhibit 101: Chart on China - Year-over-year growth 2023-2028 (%)
            • Exhibit 102: Data Table on China - Year-over-year growth 2023-2028 (%)
          • 9.12 Market opportunity by geography
            • Exhibit 103: Market opportunity by geography ($ billion)
            • Exhibit 104: Data Tables on Market opportunity by geography ($ billion)

          10 Drivers, Challenges, and Trends

          • 10.1 Market drivers
            • 10.2 Market challenges
              • 10.3 Impact of drivers and challenges
                • Exhibit 105: Impact of drivers and challenges in 2023 and 2028
              • 10.4 Market trends

                11 Vendor Landscape

                • 11.1 Overview
                  • 11.2 Vendor landscape
                    • Exhibit 106: Overview on Criticality of inputs and Factors of differentiation
                  • 11.3 Landscape disruption
                    • Exhibit 107: Overview on factors of disruption
                  • 11.4 Industry risks
                    • Exhibit 108: Impact of key risks on business

                  12 Vendor Analysis

                  • 12.1 Vendors covered
                    • Exhibit 109: Vendors covered
                  • 12.2 Market positioning of vendors
                    • Exhibit 110: Matrix on vendor position and classification
                  • 12.3 Alnylam Pharmaceuticals Inc.
                    • Exhibit 111: Alnylam Pharmaceuticals Inc. - Overview
                    • Exhibit 112: Alnylam Pharmaceuticals Inc. - Product / Service
                    • Exhibit 113: Alnylam Pharmaceuticals Inc. - Key news
                    • Exhibit 114: Alnylam Pharmaceuticals Inc. - Key offerings
                  • 12.4 Astellas Pharma Inc.
                    • Exhibit 115: Astellas Pharma Inc. - Overview
                    • Exhibit 116: Astellas Pharma Inc. - Product / Service
                    • Exhibit 117: Astellas Pharma Inc. - Key news
                    • Exhibit 118: Astellas Pharma Inc. - Key offerings
                  • 12.5 AstraZeneca Plc
                    • Exhibit 119: AstraZeneca Plc - Overview
                    • Exhibit 120: AstraZeneca Plc - Product / Service
                    • Exhibit 121: AstraZeneca Plc - Key news
                    • Exhibit 122: AstraZeneca Plc - Key offerings
                  • 12.6 CSL Ltd.
                    • Exhibit 123: CSL Ltd. - Overview
                    • Exhibit 124: CSL Ltd. - Business segments
                    • Exhibit 125: CSL Ltd. - Key offerings
                    • Exhibit 126: CSL Ltd. - Segment focus
                  • 12.7 F. Hoffmann La Roche Ltd.
                    • Exhibit 127: F. Hoffmann La Roche Ltd. - Overview
                    • Exhibit 128: F. Hoffmann La Roche Ltd. - Business segments
                    • Exhibit 129: F. Hoffmann La Roche Ltd. - Key news
                    • Exhibit 130: F. Hoffmann La Roche Ltd. - Key offerings
                    • Exhibit 131: F. Hoffmann La Roche Ltd. - Segment focus
                  • 12.8 Gilead Sciences Inc.
                    • Exhibit 132: Gilead Sciences Inc. - Overview
                    • Exhibit 133: Gilead Sciences Inc. - Product / Service
                    • Exhibit 134: Gilead Sciences Inc. - Key news
                    • Exhibit 135: Gilead Sciences Inc. - Key offerings
                  • 12.9 GlaxoSmithKline Plc
                    • Exhibit 136: GlaxoSmithKline Plc - Overview
                    • Exhibit 137: GlaxoSmithKline Plc - Business segments
                    • Exhibit 138: GlaxoSmithKline Plc - Key news
                    • Exhibit 139: GlaxoSmithKline Plc - Key offerings
                    • Exhibit 140: GlaxoSmithKline Plc - Segment focus
                  • 12.10 Gwo Xi Stem Cell Applied Technology
                    • Exhibit 141: Gwo Xi Stem Cell Applied Technology - Overview
                    • Exhibit 142: Gwo Xi Stem Cell Applied Technology - Product / Service
                    • Exhibit 143: Gwo Xi Stem Cell Applied Technology - Key offerings
                  • 12.11 Johnson and Johnson
                    • Exhibit 144: Johnson and Johnson - Overview
                    • Exhibit 145: Johnson and Johnson - Business segments
                    • Exhibit 146: Johnson and Johnson - Key news
                    • Exhibit 147: Johnson and Johnson - Key offerings
                    • Exhibit 148: Johnson and Johnson - Segment focus
                  • 12.12 Kezar Life Sciences Inc.
                    • Exhibit 149: Kezar Life Sciences Inc. - Overview
                    • Exhibit 150: Kezar Life Sciences Inc. - Product / Service
                    • Exhibit 151: Kezar Life Sciences Inc. - Key news
                    • Exhibit 152: Kezar Life Sciences Inc. - Key offerings
                  • 12.13 Merck KGaA
                    • Exhibit 153: Merck KGaA - Overview
                    • Exhibit 154: Merck KGaA - Business segments
                    • Exhibit 155: Merck KGaA - Key news
                    • Exhibit 156: Merck KGaA - Key offerings
                    • Exhibit 157: Merck KGaA - Segment focus
                  • 12.14 Novartis AG
                    • Exhibit 158: Novartis AG - Overview
                    • Exhibit 159: Novartis AG - Business segments
                    • Exhibit 160: Novartis AG - Key offerings
                    • Exhibit 161: Novartis AG - Segment focus
                  • 12.15 Novo Nordisk AS
                    • Exhibit 162: Novo Nordisk AS - Overview
                    • Exhibit 163: Novo Nordisk AS - Business segments
                    • Exhibit 164: Novo Nordisk AS - Key offerings
                    • Exhibit 165: Novo Nordisk AS - Segment focus
                  • 12.16 Pfizer Inc.
                    • Exhibit 166: Pfizer Inc. - Overview
                    • Exhibit 167: Pfizer Inc. - Product / Service
                    • Exhibit 168: Pfizer Inc. - Key news
                    • Exhibit 169: Pfizer Inc. - Key offerings
                  • 12.17 Protagonist Therapeutics Inc.
                    • Exhibit 170: Protagonist Therapeutics Inc. - Overview
                    • Exhibit 171: Protagonist Therapeutics Inc. - Product / Service
                    • Exhibit 172: Protagonist Therapeutics Inc. - Key offerings

                  13 Appendix

                  • 13.1 Scope of the report
                    • 13.2 Inclusions and exclusions checklist
                      • Exhibit 173: Inclusions checklist
                      • Exhibit 174: Exclusions checklist
                    • 13.3 Currency conversion rates for US$
                      • Exhibit 175: Currency conversion rates for US$
                    • 13.4 Research methodology
                      • Exhibit 176: Research methodology
                      • Exhibit 177: Validation techniques employed for market sizing
                      • Exhibit 178: Information sources
                    • 13.5 List of abbreviations
                      • Exhibit 179: List of abbreviations

                    Research Methodology

                    Technavio presents a detailed picture of the market by way of study, synthesis, and summation of data from multiple sources. The analysts have presented the various facets of the market with a particular focus on identifying the key industry influencers. The data thus presented is comprehensive, reliable, and the result of extensive research, both primary and secondary.

                    INFORMATION SOURCES

                    Primary sources

                    • Manufacturers and suppliers
                    • Channel partners
                    • Industry experts
                    • Strategic decision makers

                    Secondary sources

                    • Industry journals and periodicals
                    • Government data
                    • Financial reports of key industry players
                    • Historical data
                    • Press releases

                    DATA ANALYSIS

                    Data Synthesis

                    • Collation of data
                    • Estimation of key figures
                    • Analysis of derived insights

                    Data Validation

                    • Triangulation with data models
                    • Reference against proprietary databases
                    • Corroboration with industry experts

                    REPORT WRITING

                    Qualitative

                    • Market drivers
                    • Market challenges
                    • Market trends
                    • Five forces analysis

                    Quantitative

                    • Market size and forecast
                    • Market segmentation
                    • Geographical insights
                    • Competitive landscape

                    Interested in this report?

                    Get your sample now to see our research methodology and insights!

                    Download Now

                    Frequently Asked Questions

                    Liver Cirrhosis Therapeutics market growth will increase by $ 1.94 bn during 2024-2028.

                    The Liver Cirrhosis Therapeutics market is expected to grow at a CAGR of 5.58% during 2024-2028.

                    Liver Cirrhosis Therapeutics market is segmented by Type( Oral, Injection) End-user( Hospitals, Clinics, Research and academic institutes)

                    AbbVie Inc., Alnylam Pharmaceuticals Inc., Astellas Pharma Inc., AstraZeneca Plc, CSL Ltd., Eli Lilly and Co., F. Hoffmann La Roche Ltd., Gilead Sciences Inc., GlaxoSmithKline Plc, Gwo Xi Stem Cell Applied Technology, Johnson and Johnson, Kezar Life Sciences Inc., Merck KGaA, Novartis AG, Novo Nordisk AS, Pfizer Inc., Protagonist Therapeutics Inc., Tessera Therapeutics are a few of the key vendors in the Liver Cirrhosis Therapeutics market.

                    North America will register the highest growth rate of 41% among the other regions. Therefore, the Liver Cirrhosis Therapeutics market in North America is expected to garner significant business opportunities for the vendors during the forecast period.

                    US, Germany, UK, Japan, China

                    • Increasing incidence of liver cancerThe global liver cirrhosis therapeutics market is being driven primarily by the rising incidence of liver diseases is the driving factor this market.
                    • particularly hepatitis and NAFLD. According to the World Health Organization (WHO) estimates is the driving factor this market.
                    • about 325 million people worldwide suffer from viral hepatitis alone is the driving factor this market.
                    • which raises the risk of liver cirrhosis. Moreover is the driving factor this market.
                    • the spike in metabolic syndrome and obesity-related disorders is the driving factor this market.
                    • including NAFLD is the driving factor this market.
                    • is driving up the need for efficient treatments. For example is the driving factor this market.
                    • the prevalence of NAFLD is increasing is the driving factor this market.
                    • impacting about 25% of the world's population. This highlights the need for sophisticated and easily available therapies. As a result of the increasing risk of cirrhosis associated with certain liver diseases is the driving factor this market.
                    • the global liver cirrhosis therapeutics market is expected to expand during the forecast period. is the driving factor this market.

                    The Liver Cirrhosis Therapeutics market vendors should focus on grabbing business opportunities from the Oral segment as it accounted for the largest market share in the base year.