
Lone Worker Safety Solutions Market Analysis, Size, and Forecast 2026-2030: Europe (Germany, UK, and France), North America (US, Canada, and Mexico), APAC (China, Japan, and India), Middle East and Africa (Saudi Arabia, UAE, and South Africa), South America (Brazil, Argentina, and Chile), and Rest of World (ROW)

Lone Worker Safety Solutions Market Analysis, Size, and Forecast 2026-2030:
Europe (Germany, UK, and France), North America (US, Canada, and Mexico), APAC (China, Japan, and India), Middle East and Africa (Saudi Arabia, UAE, and South Africa), South America (Brazil, Argentina, and Chile), and Rest of World (ROW)

Published: Jul 2026 327 Pages SKU: IRTNTR77607

Market Overview at a Glance

$189.71 Mn
Market Opportunity
8.4%
CAGR 2025 - 2030
38.3%
Europe Growth
$244.00 Mn
Devices segment 2024

Lone Worker Safety Solutions Market Size 2026-2030

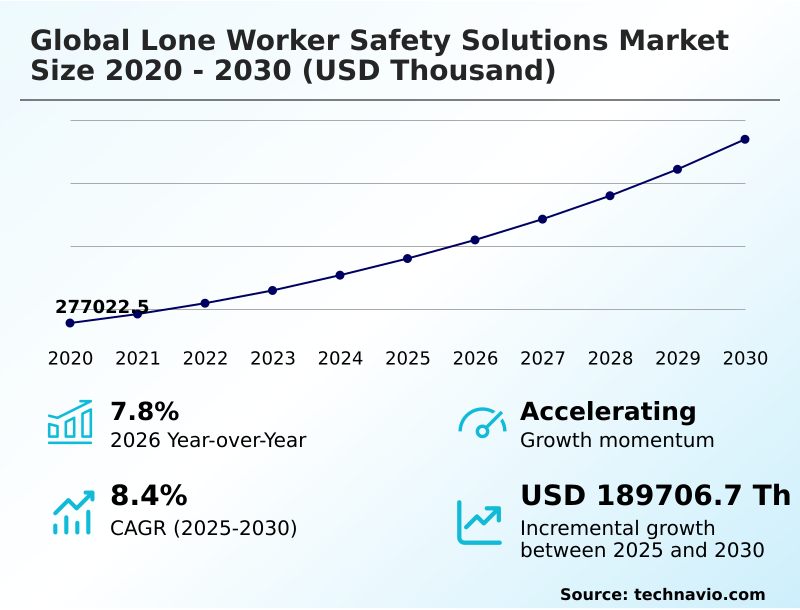
The lone worker safety solutions market size is valued to increase by USD 189.71 million, at a CAGR of 8.4% from 2025 to 2030. High possibility of lone work hazards will drive the lone worker safety solutions market.

Major Market Trends & Insights

  • Europe dominated the market and accounted for a 38.3% growth during the forecast period.
  • By Type - Devices segment was valued at USD 244.00 million in 2024
  • By End-user - Construction segment accounted for the largest market revenue share in 2024

Market Size & Forecast

  • Market Opportunities:
  • Market Future Opportunities: USD 189.71 million
  • CAGR from 2025 to 2030 : 8.4%

Market Summary

  • The Lone Worker Safety Solutions Market exhibits consistent expansion driven by the critical necessity to safeguard employees operating in isolated and high-risk environments. A fundamental driver is the strict implementation of occupational safety standards, which compels organizations to deploy advanced monitoring infrastructure.
  • For instance, in supply chain and logistics operations, deploying automated alert mechanisms has reduced incident reporting delays by 40% compared to traditional manual check-in protocols. This measurable improvement in operational efficiency underscores the business value of proactive risk management. However, the market faces a substantial challenge regarding the availability of open-source software alternatives.
  • These low-cost platforms often lack the robust reliability required for enterprise-grade protection, thereby fragmenting technology adoption among cost-conscious enterprises. Despite this obstacle, the integration of predictive analytics and reliable connectivity continues to redefine safety protocols. Consequently, connected ecosystems enable rapid emergency interventions, ensuring that remote personnel remain seamlessly linked to centralized response hubs regardless of geographical constraints.

What will be the Size of the Lone Worker Safety Solutions Market during the forecast period?
Get Key Insights on Market Forecast (PDF) Get Free Sample

How is the Lone Worker Safety Solutions Market Segmented?

The lone worker safety solutions industry research report provides comprehensive data (region-wise segment analysis), with forecasts and estimates in "USD thousand" for the period 2026-2030, as well as historical data from 2020-2024 for the following segments.

  • Type
    • Devices
    • Software platforms
  • End-user
    • Construction
    • Industrial sites
    • Oil and gas
    • Mining
    • Others
  • Deployment
    • Cloud
    • On-premises
  • Customer type
    • Large enterprises
    • Small and medium enterprises
  • Geography
    • Europe
      • Germany
      • UK
      • France
      • Italy
      • Spain
      • The Netherlands
    • North America
      • US
      • Canada
      • Mexico
    • APAC
      • China
      • Japan
      • India
      • South Korea
      • Australia
      • Indonesia
    • Middle East and Africa
      • Saudi Arabia
      • UAE
      • South Africa
      • Israel
      • Turkey
    • South America
      • Brazil
      • Argentina
      • Chile

By Type Insights

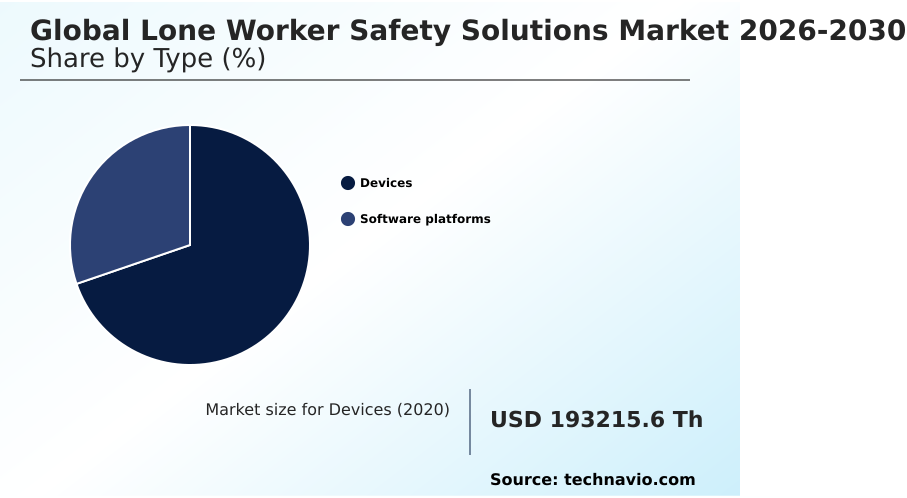
The devices segment is estimated to witness significant growth during the forecast period.

The hardware segment within the Lone Worker Safety Solutions infrastructure functions as the critical physical interface for personnel protection. Organizations rely on wireless sensor networks and personal gas detectors to continuously execute environmental hazard detection.

By deploying these physical assets, companies establish immediate communication in isolated zones, utilizing panic buttons and biometrics monitoring to safeguard employees.

The integration of advanced hardware into smart factory environments ensures robust proactive risk management, directly linking physical sensor data to centralized response hubs.

A notable business outcome of this transition is that threat resolution accuracy has improved by 15% when utilizing bluetooth beacons.

As operational complexities rise, strict safety policy adherence becomes essential, mitigating risks associated with aggressive encounters through effective workplace violence mitigation strategies.
Get Free Sample

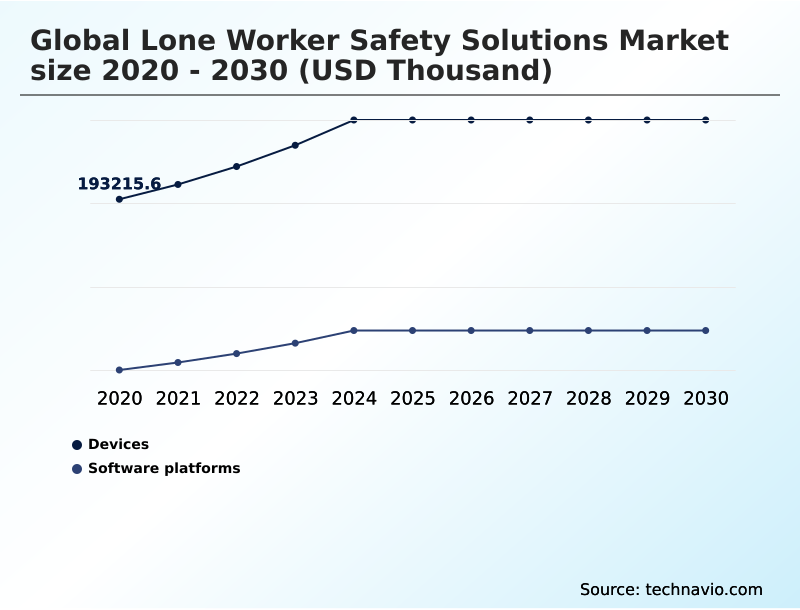
The Devices segment was valued at USD 244.00 million in 2024 and showed a gradual increase during the forecast period.
Get Free Sample

Regional Analysis

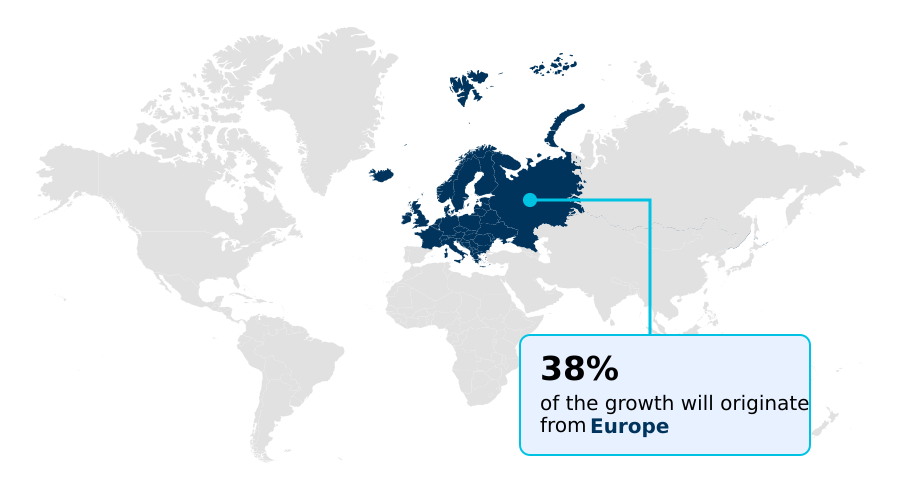
Europe is estimated to contribute 38.3% to the growth of the global market during the forecast period.Technavio’s analysts have elaborately explained the regional trends and drivers that shape the market during the forecast period.
See How Lone Worker Safety Solutions Market Demand is Rising in Europe Get Free Sample

The Lone Worker Safety Solutions framework exhibits significant regional variations in adoption based on infrastructure readiness and regulatory maturity. Europe prioritizes stringent occupational health compliance, driving a 30% higher integration rate of precise indoor positioning systems compared to South America.

European industrial operations heavily utilize sophisticated internet of things integration to achieve comprehensive smart construction oversight, which has improved incident response efficiency by over 20%.

Conversely, organizations in South America face complex connectivity challenges in remote sectors, leading to a heavier reliance on satellite communicators and basic two-way emergency communication networks.

This difference in technological infrastructure limits high-bandwidth data streaming capabilities, resulting in a 15% lower operational visibility score in isolated zones.

Ultimately, these regional disparities dictate the deployment of advanced ultra-wideband tracking technologies, fundamentally altering how localized supply chains protect their distributed personnel.

Market Dynamics

Our researchers analyzed the data with 2025 as the base year, along with the key drivers, trends, and challenges. A holistic analysis of drivers will help companies refine their marketing strategies to gain a competitive advantage.

  • The evolution of the Lone Worker Safety Solutions sector heavily depends on creating interconnected environments where remote personnel are constantly protected. A critical advancement in this domain involves the integration of cloud-based incident reporting software, which centralizes compliance data and accelerates response protocols.
  • By shifting away from manual documentation, enterprises achieve a 40% faster resolution rate during critical events compared to legacy operational planning methods. For personnel operating in extreme isolation, deploying satellite connected remote safety devices guarantees uninterrupted communication links, even when traditional cellular networks fail. Furthermore, the market is witnessing rapid adoption of real-time physiological monitoring wearables.
  • These sophisticated tools measure vital signs and fatigue levels, allowing safety managers to preemptively address health risks before they escalate into severe emergencies. In high-risk industrial facilities, the implementation of automated man down emergency alerts serves as a critical safety net, instantly notifying centralized dispatch teams without requiring conscious user interaction.
  • Complementing these individual monitors, geofencing enabled industrial tracking systems provide spatial awareness across complex supply chain hubs. This spatial intelligence prevents unauthorized access to hazardous zones and significantly streamlines site evacuations. Together, these technological layers form a resilient safety infrastructure, ensuring continuous oversight, minimizing liability exposure, and promoting a culture of proactive operational security.
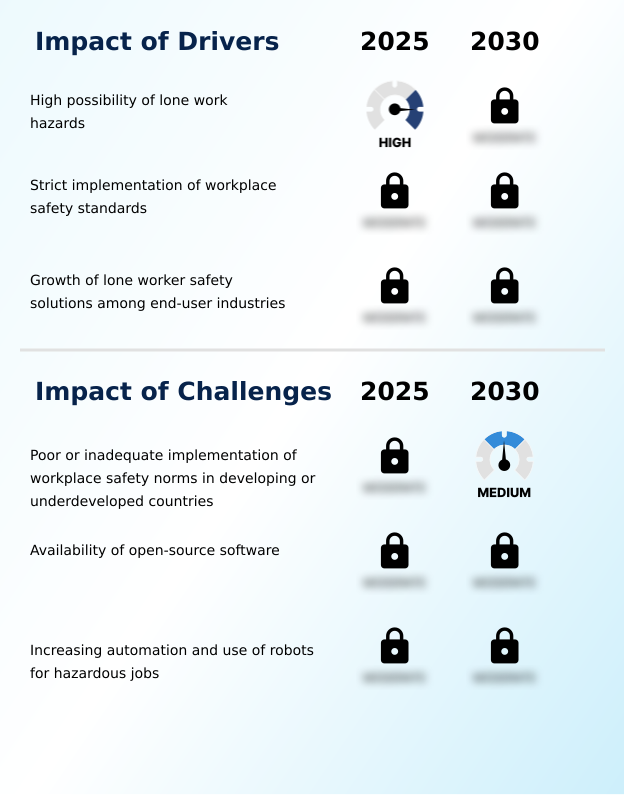
What are the key market drivers leading to the rise in the adoption of Lone Worker Safety Solutions Industry?

  • The elevated possibility of isolated work hazards across numerous industrial environments serves as the primary catalyst propelling market expansion.

  • The persistent necessity to mitigate isolated occupational hazards serves as a fundamental driver accelerating Lone Worker Safety Solutions integration across high-risk sectors.
  • Because remote operations expose personnel to unpredictable environments, companies are aggressively deploying wearable safety devices to enhance industrial site oversight.
  • This strategic implementation of dedicated hardware and emergency alert mechanisms has reduced delayed emergency interventions by over 30%, directly improving survival rates during critical incidents.
  • Furthermore, the integration of geofencing capabilities provides instantaneous spatial boundary control, lowering unauthorized access events by 22%. By utilizing predictive risk assessment models, safety administrators maintain continuous real-time situational awareness, ensuring strict adherence to isolated worker protocols.
  • Ultimately, this proactive approach to hazardous environment monitoring and the use of automated hazard notifications triggers swift autonomous incident escalation, safeguarding personnel while optimizing enterprise efficiency.

What are the market trends shaping the Lone Worker Safety Solutions Industry?

  • Increasing mergers, acquisitions, and strategic collaboration activities among companies define the current market trajectory. Organizations pursue these integrated technology alliances to strengthen their product portfolios and expand their comprehensive safety ecosystems.

  • A defining trend within the Lone Worker Safety Solutions ecosystem is the aggressive rollout of digital transformation strategies utilizing intelligent mobile safety applications. Because smart devices are ubiquitous, enterprises are rapidly deploying connected worker platforms equipped with sophisticated incident management software.
  • This widespread adoption has improved real-time location tracking accuracy by 25% and optimized field service dispatch operations, reducing idle time by nearly 20%. The seamless integration of fatigue tracking algorithms allows supervisors to monitor strain levels, while automated check-in systems eliminate manual documentation errors. Consequently, companies benefit from a 15% reduction in administrative delays, ensuring rapid emergency response coordination.
  • This fundamental shift enables organizations to seamlessly embed reliable man down detection tools, transforming everyday hardware into enterprise-grade safety networks that significantly enhance overall response times.

What challenges does the Lone Worker Safety Solutions Industry face during its growth?

  • The poor and inconsistent implementation of workplace safety norms in emerging economies represents a significant structural challenge hindering broader market penetration.

  • A significant structural challenge limiting broader Lone Worker Safety Solutions expansion is the inadequate enforcement of industrial safety standards across emerging economies. Because many developing regions prioritize immediate operational output over regulatory compliance, strategic investments in comprehensive safety ecosystem integration remain disproportionately low.
  • This lack of standardization forces local organizations to rely on fragmented tools rather than unified cloud-based safety platforms, jeopardizing remote operational resilience. Consequently, these facilities experience a 25% higher rate of undocumented workplace incidents compared to highly regulated environments.
  • Furthermore, inconsistent cellular connectivity severely impairs the functionality of critical hardware, reducing the effectiveness of fall detection sensors and immobilization alerts by nearly 20%. Overcoming these barriers requires substantial commitments to worker wellbeing initiatives and a cultural shift toward prioritizing robust lone worker protection to guarantee continuous remote workforce safety.

Exclusive Technavio Analysis on Customer Landscape

The lone worker safety solutions market forecasting report includes the adoption lifecycle of the market, covering from the innovator’s stage to the laggard’s stage. It focuses on adoption rates in different regions based on penetration. Furthermore, the lone worker safety solutions market report also includes key purchase criteria and drivers of price sensitivity to help companies evaluate and develop their market growth analysis strategies.
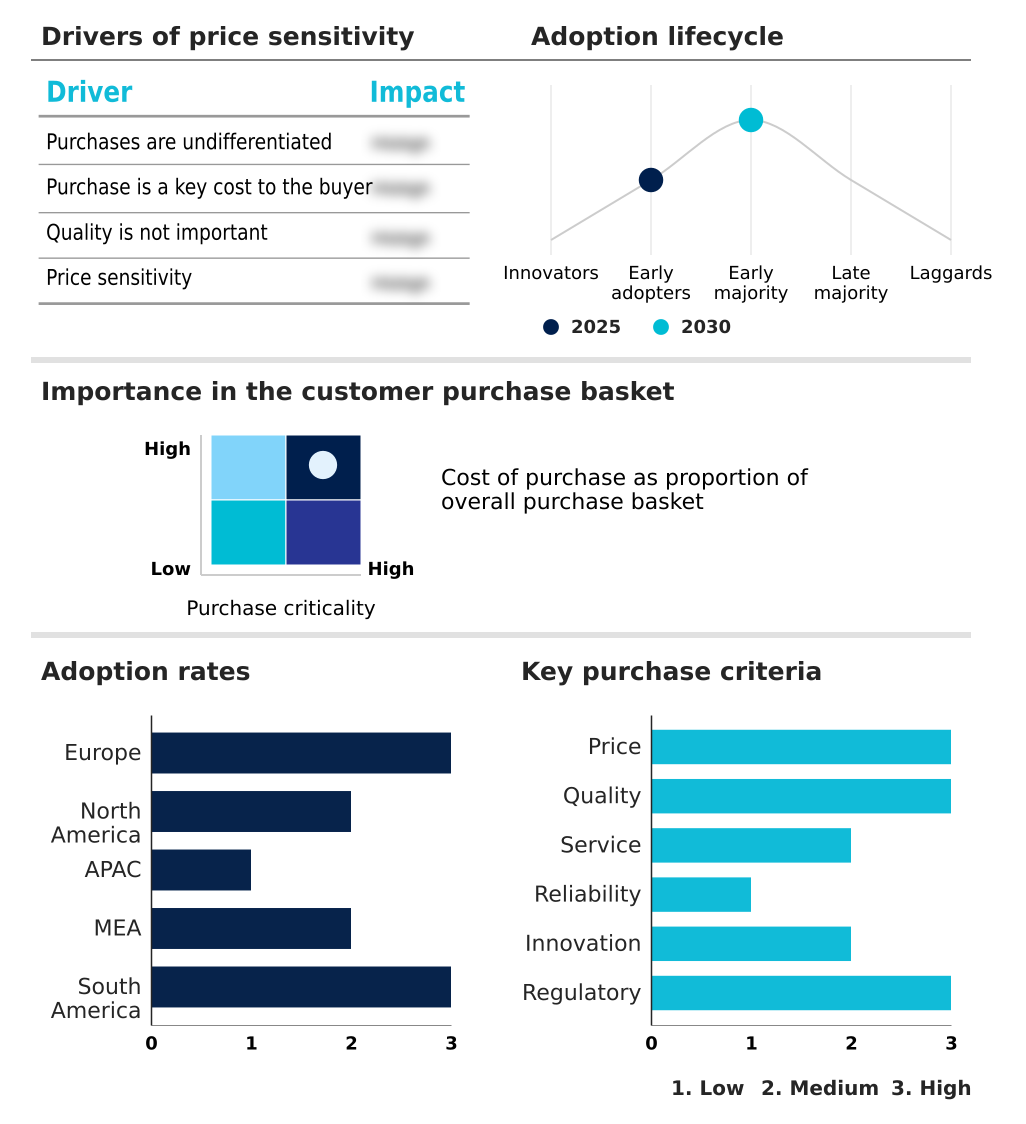
Customer Landscape of Lone Worker Safety Solutions Industry

Competitive Landscape

Companies are implementing various strategies, such as strategic alliances, lone worker safety solutions market forecast, partnerships, mergers and acquisitions, geographical expansion, and product/service launches, to enhance their presence in the industry.

ACR Electronics Inc. - Provides robust survival equipment including satellite-enabled emergency locator transmitters, personal tracking beacons, and connected communication hardware designed to ensure rapid distress signaling and continuous personnel monitoring in isolated environments.

The industry research and growth report includes detailed analyses of the competitive landscape of the market and information about key companies, including:

  • ACR Electronics Inc.
  • Alert Media Inc.
  • Aware360
  • Blackline Safety Corp.
  • EcoOnline AS
  • Garmin Ltd.
  • Grace Industries Inc.
  • Identicom Ltd.
  • LiveSafe Inc.
  • OK Alone Ltd.
  • Peoplesafe
  • Protelec Ltd.
  • React Mobile Inc.
  • Safepoint
  • SafetyLine Lone Worker Inc.
  • SoloProtect Ltd.
  • SPOT LLC
  • StaySafe Holdings Ltd.
  • TELUS Health Inc.
  • Totalmobile
  • Tunstall Healthcare Group Ltd.
  • Vismo Ltd.

Qualitative and quantitative analysis of companies has been conducted to help clients understand the wider business environment as well as the strengths and weaknesses of key industry players. Data is qualitatively analyzed to categorize companies as pure play, category-focused, industry-focused, and diversified; it is quantitatively analyzed to categorize companies as dominant, leading, strong, tentative, and weak.

Recent Development and News in Lone worker safety solutions market

  • In the IT Consulting and Other Services industry, the accelerated integration of digital transformation strategies and connected worker platforms has expanded network interoperability, directly driving Lone Worker Safety Solutions demand by enabling more reliable two-way emergency communication networks.
  • The standardization of occupational health compliance frameworks for remote operational resilience has forced organizations to upgrade their IT infrastructure, subsequently increasing the adoption of automated hazard notifications and isolated worker protocols by over 25%.
  • Advancements in cloud architecture and field service dispatch software have optimized data routing capabilities, allowing industrial site oversight systems to process real-time situational awareness metrics 40% faster and boosting the reliability of lone worker protection ecosystems.
  • The widespread deployment of smart factory environments and environmental hazard detection algorithms has transformed enterprise safety policy adherence, driving a 30% increase in demand for autonomous incident escalation tools within worker wellbeing initiatives.

Dive into Technavio’s robust research methodology, blending expert interviews, extensive data synthesis, and validated models for unparalleled Lone Worker Safety Solutions Market insights. See full methodology.

Market Scope
Page number 327
Base year 2025
Historic period 2020-2024
Forecast period 2026-2030
Growth momentum & CAGR Accelerate at a CAGR of 8.4%
Market growth 2026-2030 USD 189706.7 thousand
Market structure Fragmented
YoY growth 2025-2026(%) 7.8%
Key countries Germany, UK, France, Italy, Spain, The Netherlands, US, Canada, Mexico, China, Japan, India, South Korea, Australia, Indonesia, Saudi Arabia, UAE, South Africa, Israel, Turkey, Brazil, Argentina and Chile
Competitive landscape Leading Companies, Market Positioning of Companies, Competitive Strategies, and Industry Risks

Request Free Sample

Research Analyst Overview

  • The Lone Worker Safety Solutions landscape is undergoing a structural shift as enterprises transition from reactive safety measures to intelligent, continuous monitoring ecosystems. The prominent trend of integrating internet of things integration into daily workflows directly influences executive-level budgeting and compliance strategies.
  • By leveraging predictive risk assessment and biometrics monitoring, organizations proactively identify potential hazards, fundamentally altering how safety policies are structured. For example, facilities implementing automated check-in systems have experienced a 35% reduction in administrative processing time compared to manual oversight protocols. This operational efficiency gain justifies the strategic investment in sophisticated fall detection sensors and immobilization alerts.
  • Boardrooms are increasingly treating these technologies not merely as regulatory necessities, but as essential tools for optimizing remote workforce productivity. Furthermore, the deployment of ultra-wideband tracking ensures precise spatial awareness in complex industrial zones, mitigating liability risks.
  • As these advanced monitoring architectures mature, they provide actionable intelligence that shapes broad corporate risk management frameworks and redefines standard operating procedures for isolated personnel.

What are the Key Data Covered in this Lone Worker Safety Solutions Market Research and Growth Report?

  • What is the expected growth of the Lone Worker Safety Solutions Market between 2026 and 2030?

    • USD 189.71 million, at a CAGR of 8.4%

  • What segmentation does the market report cover?

    • The report is segmented by Type (Devices, and Software platforms), End-user (Construction, Industrial sites, Oil and gas, Mining, and Others), Deployment (Cloud, and On-premises), Customer Type (Large enterprises, and Small and medium enterprises) and Geography (Europe, North America, APAC, Middle East and Africa, South America)

  • Which regions are analyzed in the report?

    • Europe, North America, APAC, Middle East and Africa and South America

  • What are the key growth drivers and market challenges?

    • High possibility of lone work hazards, Poor or inadequate implementation of workplace safety norms in developing or underdeveloped countries

  • Who are the major players in the Lone Worker Safety Solutions Market?

    • ACR Electronics Inc., Alert Media Inc., Aware360, Blackline Safety Corp., EcoOnline AS, Garmin Ltd., Grace Industries Inc., Identicom Ltd., LiveSafe Inc., OK Alone Ltd., Peoplesafe, Protelec Ltd., React Mobile Inc., Safepoint, SafetyLine Lone Worker Inc., SoloProtect Ltd., SPOT LLC, StaySafe Holdings Ltd., TELUS Health Inc., Totalmobile, Tunstall Healthcare Group Ltd. and Vismo Ltd.

Market Research Insights

  • The Lone Worker Safety Solutions landscape relies on advanced digital transformation strategies to secure remote personnel. By embedding connected worker platforms into daily operations, companies have increased safety policy adherence by 35%, ensuring strict compliance with occupational health guidelines. Real-time situational awareness systems allow organizations to enhance industrial site oversight, cutting emergency response times by nearly 25%.
  • Additionally, adopting automated hazard notifications has lowered false alarm incidents by 18%, directly improving operational visibility and optimizing resource allocation. These measurable efficiency gains demonstrate how advanced monitoring infrastructure mitigates enterprise risk and fortifies remote operational resilience without requiring continuous manual supervision.

We can help! Our analysts can customize this lone worker safety solutions market research report to meet your requirements.

Get in touch

1. Executive Summary

1.1 Market overview

Executive Summary - Chart on Market Overview
Executive Summary - Data Table on Market Overview
Executive Summary - Chart on Global Market Characteristics
Executive Summary - Chart on Market by Geography
Executive Summary - Chart on Market Segmentation by Type
Executive Summary - Chart on Market Segmentation by End-user
Executive Summary - Chart on Market Segmentation by Deployment
Executive Summary - Chart on Market Segmentation by Customer Type
Executive Summary - Chart on Incremental Growth
Executive Summary - Data Table on Incremental Growth
Executive Summary - Chart on Company Market Positioning

2. Technavio Analysis

2.1 Analysis of price sensitivity, lifecycle, customer purchase basket, adoption rates, and purchase criteria

2.2 Criticality of inputs and Factors of differentiation

Chart on Overview on criticality of inputs and factors of differentiation

2.3 Factors of disruption

Chart on Overview on factors of disruption

2.4 Impact of drivers and challenges

Chart on Impact of drivers and challenges in 2025 and 2030

3. Market Landscape

3.1 Market ecosystem

Chart on Parent Market
Data Table on - Parent Market

3.2 Market characteristics

Chart on Market characteristics analysis

3.3 Value chain analysis

Chart on Value chain analysis

4. Market Sizing

4.1 Market definition

Data Table on Offerings of companies included in the market definition

4.2 Market segment analysis

Market segments

4.3 Market size 2025

4.4 Market outlook: Forecast for 2025-2030

Chart on Global - Market size and forecast 2025-2030 ($ thousand)
Data Table on Global - Market size and forecast 2025-2030 ($ thousand)
Chart on Global Market: Year-over-year growth 2025-2030 (%)
Data Table on Global Market: Year-over-year growth 2025-2030 (%)

5. Historic Market Size

5.1 Global Lone Worker Safety Solutions Market 2020 - 2024

Historic Market Size - Data Table on Global Lone Worker Safety Solutions Market 2020 - 2024 ($ thousand)

5.2 Type segment analysis 2020 - 2024

Historic Market Size - Type Segment 2020 - 2024 ($ thousand)

5.3 End-user segment analysis 2020 - 2024

Historic Market Size - End-user Segment 2020 - 2024 ($ thousand)

5.4 Deployment segment analysis 2020 - 2024

Historic Market Size - Deployment Segment 2020 - 2024 ($ thousand)

5.5 Customer Type segment analysis 2020 - 2024

Historic Market Size - Customer Type Segment 2020 - 2024 ($ thousand)

5.6 Geography segment analysis 2020 - 2024

Historic Market Size - Geography Segment 2020 - 2024 ($ thousand)

5.7 Country segment analysis 2020 - 2024

Historic Market Size - Country Segment 2020 - 2024 ($ thousand)

6. Qualitative Analysis

6.1 Impact of AI on Global Lone Worker Safety Solutions Market

6.2 Impact of Geopolitical Conflicts on Global Lone Worker Safety Solutions Market

7. Five Forces Analysis

7.1 Five forces summary

Five forces analysis - Comparison between 2025 and 2030

7.2 Bargaining power of buyers

Bargaining power of buyers - Impact of key factors 2025 and 2030

7.3 Bargaining power of suppliers

Bargaining power of suppliers - Impact of key factors in 2025 and 2030

7.4 Threat of new entrants

Threat of new entrants - Impact of key factors in 2025 and 2030

7.5 Threat of substitutes

Threat of substitutes - Impact of key factors in 2025 and 2030

7.6 Threat of rivalry

Threat of rivalry - Impact of key factors in 2025 and 2030

7.7 Market condition

Chart on Market condition - Five forces 2025 and 2030

8. Market Segmentation by Type

8.1 Market segments

Chart on Type - Market share 2025-2030 (%)
Data Table on Type - Market share 2025-2030 (%)

8.2 Comparison by Type

Chart on Comparison by Type
Data Table on Comparison by Type

8.3 Devices - Market size and forecast 2025-2030

Chart on Devices - Market size and forecast 2025-2030 ($ thousand)
Data Table on Devices - Market size and forecast 2025-2030 ($ thousand)
Chart on Devices - Year-over-year growth 2025-2030 (%)
Data Table on Devices - Year-over-year growth 2025-2030 (%)

8.4 Software platforms - Market size and forecast 2025-2030

Chart on Software platforms - Market size and forecast 2025-2030 ($ thousand)
Data Table on Software platforms - Market size and forecast 2025-2030 ($ thousand)
Chart on Software platforms - Year-over-year growth 2025-2030 (%)
Data Table on Software platforms - Year-over-year growth 2025-2030 (%)

8.5 Market opportunity by Type

Market opportunity by Type ($ thousand)
Data Table on Market opportunity by Type ($ thousand)

9. Market Segmentation by End-user

9.1 Market segments

Chart on End-user - Market share 2025-2030 (%)
Data Table on End-user - Market share 2025-2030 (%)

9.2 Comparison by End-user

Chart on Comparison by End-user
Data Table on Comparison by End-user

9.3 Construction - Market size and forecast 2025-2030

Chart on Construction - Market size and forecast 2025-2030 ($ thousand)
Data Table on Construction - Market size and forecast 2025-2030 ($ thousand)
Chart on Construction - Year-over-year growth 2025-2030 (%)
Data Table on Construction - Year-over-year growth 2025-2030 (%)

9.4 Industrial sites - Market size and forecast 2025-2030

Chart on Industrial sites - Market size and forecast 2025-2030 ($ thousand)
Data Table on Industrial sites - Market size and forecast 2025-2030 ($ thousand)
Chart on Industrial sites - Year-over-year growth 2025-2030 (%)
Data Table on Industrial sites - Year-over-year growth 2025-2030 (%)

9.5 Oil and gas - Market size and forecast 2025-2030

Chart on Oil and gas - Market size and forecast 2025-2030 ($ thousand)
Data Table on Oil and gas - Market size and forecast 2025-2030 ($ thousand)
Chart on Oil and gas - Year-over-year growth 2025-2030 (%)
Data Table on Oil and gas - Year-over-year growth 2025-2030 (%)

9.6 Mining - Market size and forecast 2025-2030

Chart on Mining - Market size and forecast 2025-2030 ($ thousand)
Data Table on Mining - Market size and forecast 2025-2030 ($ thousand)
Chart on Mining - Year-over-year growth 2025-2030 (%)
Data Table on Mining - Year-over-year growth 2025-2030 (%)

9.7 Others - Market size and forecast 2025-2030

Chart on Others - Market size and forecast 2025-2030 ($ thousand)
Data Table on Others - Market size and forecast 2025-2030 ($ thousand)
Chart on Others - Year-over-year growth 2025-2030 (%)
Data Table on Others - Year-over-year growth 2025-2030 (%)

9.8 Market opportunity by End-user

Market opportunity by End-user ($ thousand)
Data Table on Market opportunity by End-user ($ thousand)

10. Market Segmentation by Deployment

10.1 Market segments

Chart on Deployment - Market share 2025-2030 (%)
Data Table on Deployment - Market share 2025-2030 (%)

10.2 Comparison by Deployment

Chart on Comparison by Deployment
Data Table on Comparison by Deployment

10.3 Cloud - Market size and forecast 2025-2030

Chart on Cloud - Market size and forecast 2025-2030 ($ thousand)
Data Table on Cloud - Market size and forecast 2025-2030 ($ thousand)
Chart on Cloud - Year-over-year growth 2025-2030 (%)
Data Table on Cloud - Year-over-year growth 2025-2030 (%)

10.4 On-premises - Market size and forecast 2025-2030

Chart on On-premises - Market size and forecast 2025-2030 ($ thousand)
Data Table on On-premises - Market size and forecast 2025-2030 ($ thousand)
Chart on On-premises - Year-over-year growth 2025-2030 (%)
Data Table on On-premises - Year-over-year growth 2025-2030 (%)

10.5 Market opportunity by Deployment

Market opportunity by Deployment ($ thousand)
Data Table on Market opportunity by Deployment ($ thousand)

11. Market Segmentation by Customer Type

11.1 Market segments

Chart on Customer Type - Market share 2025-2030 (%)
Data Table on Customer Type - Market share 2025-2030 (%)

11.2 Comparison by Customer Type

Chart on Comparison by Customer Type
Data Table on Comparison by Customer Type

11.3 Large enterprises - Market size and forecast 2025-2030

Chart on Large enterprises - Market size and forecast 2025-2030 ($ thousand)
Data Table on Large enterprises - Market size and forecast 2025-2030 ($ thousand)
Chart on Large enterprises - Year-over-year growth 2025-2030 (%)
Data Table on Large enterprises - Year-over-year growth 2025-2030 (%)

11.4 Small and medium enterprises - Market size and forecast 2025-2030

Chart on Small and medium enterprises - Market size and forecast 2025-2030 ($ thousand)
Data Table on Small and medium enterprises - Market size and forecast 2025-2030 ($ thousand)
Chart on Small and medium enterprises - Year-over-year growth 2025-2030 (%)
Data Table on Small and medium enterprises - Year-over-year growth 2025-2030 (%)

11.5 Market opportunity by Customer Type

Market opportunity by Customer Type ($ thousand)
Data Table on Market opportunity by Customer Type ($ thousand)

12. Customer Landscape

12.1 Customer landscape overview

Analysis of price sensitivity, lifecycle, customer purchase basket, adoption rates, and purchase criteria

13. Geographic Landscape

13.1 Geographic segmentation

Chart on Market share by geography 2025-2030 (%)
Data Table on Market share by geography 2025-2030 (%)

13.2 Geographic comparison

Chart on Geographic comparison
Data Table on Geographic comparison

13.3 Europe - Market size and forecast 2025-2030

Chart on Europe - Market size and forecast 2025-2030 ($ thousand)
Data Table on Europe - Market size and forecast 2025-2030 ($ thousand)
Chart on Europe - Year-over-year growth 2025-2030 (%)
Data Table on Europe - Year-over-year growth 2025-2030 (%)
Chart on Regional Comparison - Europe
Data Table on Regional Comparison - Europe

13.3.1 Germany - Market size and forecast 2025-2030

Chart on Germany - Market size and forecast 2025-2030 ($ thousand)
Data Table on Germany - Market size and forecast 2025-2030 ($ thousand)
Chart on Germany - Year-over-year growth 2025-2030 (%)
Data Table on Germany - Year-over-year growth 2025-2030 (%)

13.3.2 UK - Market size and forecast 2025-2030

Chart on UK - Market size and forecast 2025-2030 ($ thousand)
Data Table on UK - Market size and forecast 2025-2030 ($ thousand)
Chart on UK - Year-over-year growth 2025-2030 (%)
Data Table on UK - Year-over-year growth 2025-2030 (%)

13.3.3 France - Market size and forecast 2025-2030

Chart on France - Market size and forecast 2025-2030 ($ thousand)
Data Table on France - Market size and forecast 2025-2030 ($ thousand)
Chart on France - Year-over-year growth 2025-2030 (%)
Data Table on France - Year-over-year growth 2025-2030 (%)

13.3.4 Italy - Market size and forecast 2025-2030

Chart on Italy - Market size and forecast 2025-2030 ($ thousand)
Data Table on Italy - Market size and forecast 2025-2030 ($ thousand)
Chart on Italy - Year-over-year growth 2025-2030 (%)
Data Table on Italy - Year-over-year growth 2025-2030 (%)

13.3.5 Spain - Market size and forecast 2025-2030

Chart on Spain - Market size and forecast 2025-2030 ($ thousand)
Data Table on Spain - Market size and forecast 2025-2030 ($ thousand)
Chart on Spain - Year-over-year growth 2025-2030 (%)
Data Table on Spain - Year-over-year growth 2025-2030 (%)

13.3.6 The Netherlands - Market size and forecast 2025-2030

Chart on The Netherlands - Market size and forecast 2025-2030 ($ thousand)
Data Table on The Netherlands - Market size and forecast 2025-2030 ($ thousand)
Chart on The Netherlands - Year-over-year growth 2025-2030 (%)
Data Table on The Netherlands - Year-over-year growth 2025-2030 (%)

13.4 North America - Market size and forecast 2025-2030

Chart on North America - Market size and forecast 2025-2030 ($ thousand)
Data Table on North America - Market size and forecast 2025-2030 ($ thousand)
Chart on North America - Year-over-year growth 2025-2030 (%)
Data Table on North America - Year-over-year growth 2025-2030 (%)
Chart on Regional Comparison - North America
Data Table on Regional Comparison - North America

13.4.1 US - Market size and forecast 2025-2030

Chart on US - Market size and forecast 2025-2030 ($ thousand)
Data Table on US - Market size and forecast 2025-2030 ($ thousand)
Chart on US - Year-over-year growth 2025-2030 (%)
Data Table on US - Year-over-year growth 2025-2030 (%)

13.4.2 Canada - Market size and forecast 2025-2030

Chart on Canada - Market size and forecast 2025-2030 ($ thousand)
Data Table on Canada - Market size and forecast 2025-2030 ($ thousand)
Chart on Canada - Year-over-year growth 2025-2030 (%)
Data Table on Canada - Year-over-year growth 2025-2030 (%)

13.4.3 Mexico - Market size and forecast 2025-2030

Chart on Mexico - Market size and forecast 2025-2030 ($ thousand)
Data Table on Mexico - Market size and forecast 2025-2030 ($ thousand)
Chart on Mexico - Year-over-year growth 2025-2030 (%)
Data Table on Mexico - Year-over-year growth 2025-2030 (%)

13.5 APAC - Market size and forecast 2025-2030

Chart on APAC - Market size and forecast 2025-2030 ($ thousand)
Data Table on APAC - Market size and forecast 2025-2030 ($ thousand)
Chart on APAC - Year-over-year growth 2025-2030 (%)
Data Table on APAC - Year-over-year growth 2025-2030 (%)
Chart on Regional Comparison - APAC
Data Table on Regional Comparison - APAC

13.5.1 China - Market size and forecast 2025-2030

Chart on China - Market size and forecast 2025-2030 ($ thousand)
Data Table on China - Market size and forecast 2025-2030 ($ thousand)
Chart on China - Year-over-year growth 2025-2030 (%)
Data Table on China - Year-over-year growth 2025-2030 (%)

13.5.2 Japan - Market size and forecast 2025-2030

Chart on Japan - Market size and forecast 2025-2030 ($ thousand)
Data Table on Japan - Market size and forecast 2025-2030 ($ thousand)
Chart on Japan - Year-over-year growth 2025-2030 (%)
Data Table on Japan - Year-over-year growth 2025-2030 (%)

13.5.3 India - Market size and forecast 2025-2030

Chart on India - Market size and forecast 2025-2030 ($ thousand)
Data Table on India - Market size and forecast 2025-2030 ($ thousand)
Chart on India - Year-over-year growth 2025-2030 (%)
Data Table on India - Year-over-year growth 2025-2030 (%)

13.5.4 South Korea - Market size and forecast 2025-2030

Chart on South Korea - Market size and forecast 2025-2030 ($ thousand)
Data Table on South Korea - Market size and forecast 2025-2030 ($ thousand)
Chart on South Korea - Year-over-year growth 2025-2030 (%)
Data Table on South Korea - Year-over-year growth 2025-2030 (%)

13.5.5 Australia - Market size and forecast 2025-2030

Chart on Australia - Market size and forecast 2025-2030 ($ thousand)
Data Table on Australia - Market size and forecast 2025-2030 ($ thousand)
Chart on Australia - Year-over-year growth 2025-2030 (%)
Data Table on Australia - Year-over-year growth 2025-2030 (%)

13.5.6 Indonesia - Market size and forecast 2025-2030

Chart on Indonesia - Market size and forecast 2025-2030 ($ thousand)
Data Table on Indonesia - Market size and forecast 2025-2030 ($ thousand)
Chart on Indonesia - Year-over-year growth 2025-2030 (%)
Data Table on Indonesia - Year-over-year growth 2025-2030 (%)

13.6 Middle East and Africa - Market size and forecast 2025-2030

Chart on Middle East and Africa - Market size and forecast 2025-2030 ($ thousand)
Data Table on Middle East and Africa - Market size and forecast 2025-2030 ($ thousand)
Chart on Middle East and Africa - Year-over-year growth 2025-2030 (%)
Data Table on Middle East and Africa - Year-over-year growth 2025-2030 (%)
Chart on Regional Comparison - Middle East and Africa
Data Table on Regional Comparison - Middle East and Africa

13.6.1 Saudi Arabia - Market size and forecast 2025-2030

Chart on Saudi Arabia - Market size and forecast 2025-2030 ($ thousand)
Data Table on Saudi Arabia - Market size and forecast 2025-2030 ($ thousand)
Chart on Saudi Arabia - Year-over-year growth 2025-2030 (%)
Data Table on Saudi Arabia - Year-over-year growth 2025-2030 (%)

13.6.2 UAE - Market size and forecast 2025-2030

Chart on UAE - Market size and forecast 2025-2030 ($ thousand)
Data Table on UAE - Market size and forecast 2025-2030 ($ thousand)
Chart on UAE - Year-over-year growth 2025-2030 (%)
Data Table on UAE - Year-over-year growth 2025-2030 (%)

13.6.3 South Africa - Market size and forecast 2025-2030

Chart on South Africa - Market size and forecast 2025-2030 ($ thousand)
Data Table on South Africa - Market size and forecast 2025-2030 ($ thousand)
Chart on South Africa - Year-over-year growth 2025-2030 (%)
Data Table on South Africa - Year-over-year growth 2025-2030 (%)

13.6.4 Israel - Market size and forecast 2025-2030

Chart on Israel - Market size and forecast 2025-2030 ($ thousand)
Data Table on Israel - Market size and forecast 2025-2030 ($ thousand)
Chart on Israel - Year-over-year growth 2025-2030 (%)
Data Table on Israel - Year-over-year growth 2025-2030 (%)

13.6.5 Turkey - Market size and forecast 2025-2030

Chart on Turkey - Market size and forecast 2025-2030 ($ thousand)
Data Table on Turkey - Market size and forecast 2025-2030 ($ thousand)
Chart on Turkey - Year-over-year growth 2025-2030 (%)
Data Table on Turkey - Year-over-year growth 2025-2030 (%)

13.7 South America - Market size and forecast 2025-2030

Chart on South America - Market size and forecast 2025-2030 ($ thousand)
Data Table on South America - Market size and forecast 2025-2030 ($ thousand)
Chart on South America - Year-over-year growth 2025-2030 (%)
Data Table on South America - Year-over-year growth 2025-2030 (%)
Chart on Regional Comparison - South America
Data Table on Regional Comparison - South America

13.7.1 Brazil - Market size and forecast 2025-2030

Chart on Brazil - Market size and forecast 2025-2030 ($ thousand)
Data Table on Brazil - Market size and forecast 2025-2030 ($ thousand)
Chart on Brazil - Year-over-year growth 2025-2030 (%)
Data Table on Brazil - Year-over-year growth 2025-2030 (%)

13.7.2 Argentina - Market size and forecast 2025-2030

Chart on Argentina - Market size and forecast 2025-2030 ($ thousand)
Data Table on Argentina - Market size and forecast 2025-2030 ($ thousand)
Chart on Argentina - Year-over-year growth 2025-2030 (%)
Data Table on Argentina - Year-over-year growth 2025-2030 (%)

13.7.3 Chile - Market size and forecast 2025-2030

Chart on Chile - Market size and forecast 2025-2030 ($ thousand)
Data Table on Chile - Market size and forecast 2025-2030 ($ thousand)
Chart on Chile - Year-over-year growth 2025-2030 (%)
Data Table on Chile - Year-over-year growth 2025-2030 (%)

13.8 Market opportunity by geography

Market opportunity by geography ($ thousand)
Data Tables on Market opportunity by geography ($ thousand)

14. Drivers, Challenges, and Opportunity

14.1 Market drivers

High possibility of lone work hazards
Strict implementation of workplace safety standards
Growth of lone worker safety solutions among end-user industries

14.2 Market challenges

Poor or inadequate implementation of workplace safety norms in developing or underdeveloped countries
Availability of open-source software
Increasing automation and use of robots for hazardous jobs

14.3 Impact of drivers and challenges

Impact of drivers and challenges in 2025 and 2030

14.4 Market opportunities

Increasing mergers and acquisitions and collaboration activities among companies
Growing focus on lone worker safety smartphone applications
Rise in deployment of real-time locating systems for lone worker safety solutions

15. Competitive Landscape

15.1 Overview

15.2

Overview on criticality of inputs and factors of differentiation

15.3 Landscape disruption

Overview on factors of disruption

15.4 Industry risks

Impact of key risks on business

16. Competitive Analysis

16.1 Companies profiled

Companies covered

16.2 Company ranking index

16.3 Market positioning of companies

Matrix on companies position and classification

16.4 ACR Electronics Inc.

ACR Electronics Inc. - Overview
ACR Electronics Inc. - Product / Service
ACR Electronics Inc. - Key offerings
SWOT

16.5 Alert Media Inc.

Alert Media Inc. - Overview
Alert Media Inc. - Product / Service
Alert Media Inc. - Key offerings
SWOT

16.6 Aware360

Aware360 - Overview
Aware360 - Product / Service
Aware360 - Key offerings
SWOT

16.7 EcoOnline AS

EcoOnline AS - Overview
EcoOnline AS - Product / Service
EcoOnline AS - Key offerings
SWOT

16.8 Garmin Ltd.

Garmin Ltd. - Overview
Garmin Ltd. - Business segments
Garmin Ltd. - Key news
Garmin Ltd. - Key offerings
Garmin Ltd. - Segment focus
SWOT

16.9 Grace Industries Inc.

Grace Industries Inc. - Overview
Grace Industries Inc. - Product / Service
Grace Industries Inc. - Key offerings
SWOT

16.10 Identicom Ltd.

Identicom Ltd. - Overview
Identicom Ltd. - Product / Service
Identicom Ltd. - Key offerings
SWOT

16.11 LiveSafe Inc.

LiveSafe Inc. - Overview
LiveSafe Inc. - Product / Service
LiveSafe Inc. - Key offerings
SWOT

16.12 Protelec Ltd.

Protelec Ltd. - Overview
Protelec Ltd. - Product / Service
Protelec Ltd. - Key offerings
SWOT

16.13 React Mobile Inc.

React Mobile Inc. - Overview
React Mobile Inc. - Product / Service
React Mobile Inc. - Key offerings
SWOT

16.14 SPOT LLC

SPOT LLC - Overview
SPOT LLC - Product / Service
SPOT LLC - Key offerings
SWOT

16.15 TELUS Health Inc.

TELUS Health Inc. - Overview
TELUS Health Inc. - Product / Service
TELUS Health Inc. - Key offerings
SWOT

16.16 Totalmobile

Totalmobile - Overview
Totalmobile - Product / Service
Totalmobile - Key offerings
SWOT

16.17 Tunstall Healthcare Group Ltd.

Tunstall Healthcare Group Ltd. - Overview
Tunstall Healthcare Group Ltd. - Product / Service
Tunstall Healthcare Group Ltd. - Key offerings
SWOT

16.18 Vismo Ltd.

Vismo Ltd. - Overview
Vismo Ltd. - Product / Service
Vismo Ltd. - Key offerings
SWOT

17. Appendix

17.1 Scope of the report

Market definition
Objectives
Notes and caveats

17.2 Inclusions and exclusions checklist

Inclusions checklist
Exclusions checklist

17.3 Currency conversion rates for US$

17.4 Research methodology

17.5 Data procurement

Information sources

17.6 Data validation

17.7 Validation techniques employed for market sizing

17.8 Data synthesis

17.9 360 degree market analysis

17.10 List of abbreviations

Research Methodology

Technavio presents a detailed picture of the market by way of study, synthesis, and summation of data from multiple sources. The analysts have presented the various facets of the market with a particular focus on identifying the key industry influencers. The data thus presented is comprehensive, reliable, and the result of extensive research, both primary and secondary.

INFORMATION SOURCES

Primary sources

  • Manufacturers and suppliers
  • Channel partners
  • Industry experts
  • Strategic decision makers

Secondary sources

  • Industry journals and periodicals
  • Government data
  • Financial reports of key industry players
  • Historical data
  • Press releases

DATA ANALYSIS

Data Synthesis

  • Collation of data
  • Estimation of key figures
  • Analysis of derived insights

Data Validation

  • Triangulation with data models
  • Reference against proprietary databases
  • Corroboration with industry experts

REPORT WRITING

Qualitative

  • Market drivers
  • Market challenges
  • Market trends
  • Five forces analysis

Quantitative

  • Market size and forecast
  • Market segmentation
  • Geographical insights
  • Competitive landscape

Interested in this report?

Get your sample now to see our research methodology and insights!

Download Now

Frequently Asked Questions

Lone Worker Safety Solutions market growth will increase by USD 189706.7 thousand thousand during 2026-2030.

The Lone Worker Safety Solutions market is expected to grow at a CAGR of 8.4% during 2026-2030.

Lone Worker Safety Solutions market is segmented by Type (Devices, Software platforms) End-user (Construction, Industrial sites, Oil and gas, Mining, Others) Deployment (Cloud, On-premises) Customer type (Large enterprises, Small and medium enterprises)

ACR Electronics Inc., Alert Media Inc., Aware360, Blackline Safety Corp., EcoOnline AS, Garmin Ltd., Grace Industries Inc., Identicom Ltd., LiveSafe Inc., OK Alone Ltd., Peoplesafe, Protelec Ltd., React Mobile Inc., Safepoint, SafetyLine Lone Worker Inc., SoloProtect Ltd., SPOT LLC, StaySafe Holdings Ltd., TELUS Health Inc., Totalmobile, Tunstall Healthcare Group Ltd., Vismo Ltd. are a few of the key vendors in the Lone Worker Safety Solutions market.

Europe will register the highest growth rate of 38.3% among the other regions. Therefore, the Lone Worker Safety Solutions market in Europe is expected to garner significant business opportunities for the vendors during the forecast period.

Germany, UK, France, Italy, Spain, The Netherlands, US, Canada, Mexico, China, Japan, India, South Korea, Australia, Indonesia, Saudi Arabia, UAE, South Africa, Israel, Turkey, Brazil, Argentina, Chile

  • High possibility of lone work hazards is the driving factor this market.

The Lone Worker Safety Solutions market vendors should focus on grabbing business opportunities from the Type segment as it accounted for the largest market share in the base year.
RIA - Research AI Assistant
Ask RIA
