
US Lottery Market Size 2026-2030
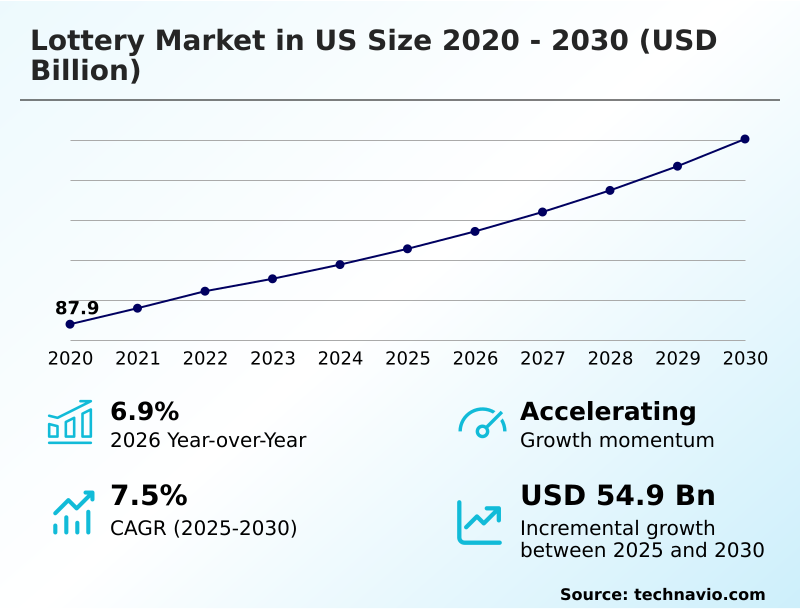
The us lottery market size is valued to increase by USD 54.9 billion, at a CAGR of 7.5% from 2025 to 2030. Digital transformation and iLottery expansion will drive the us lottery market.
Major Market Trends & Insights
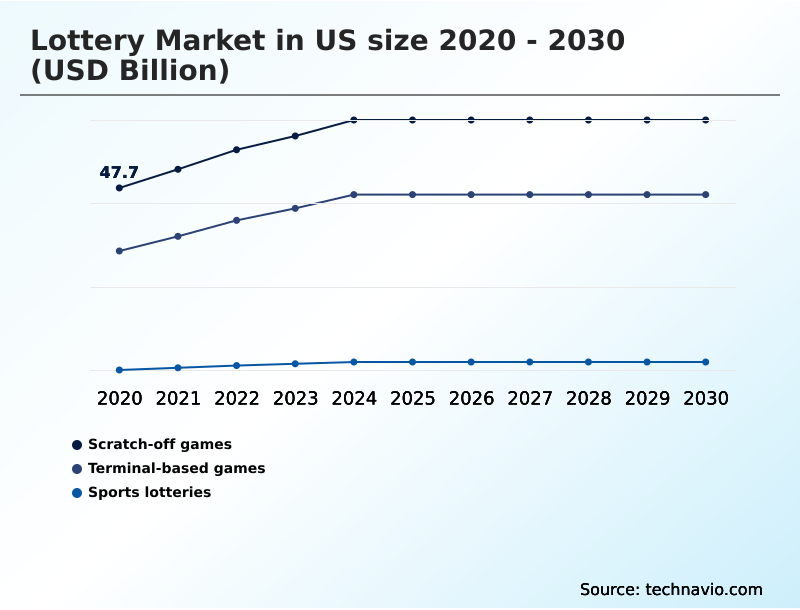
- By Type - Scratch-off games segment was valued at USD 63 billion in 2024
- By Platform - Traditional segment accounted for the largest market revenue share in 2024
Market Size & Forecast
- Market Opportunities: USD 92.6 billion
- Market Future Opportunities: USD 54.9 billion
- CAGR from 2025 to 2030 : 7.5%
Market Summary
- The lottery market in US serves as a vital mechanism for non-tax revenue generation, channeling funds into public initiatives like education and infrastructure. This sector encompasses a diverse portfolio of products, including traditional draw-based games, high-frequency scratch-off games, and increasingly, sports-linked gaming.
- A significant shift is underway, characterized by a digital transformation that moves the industry beyond retail-centric models to a sophisticated omnichannel retail experience. This evolution is driven by consumer demand for convenience and the need to engage a younger, tech-savvy demographic.
- For instance, a state operator leveraging player behavior analytics can refine its portfolio of instant-win games, optimizing prize structures and themes to enhance engagement without compromising responsible gaming principles. The integration of a secure digital interface, robust player account management systems, and mobile lottery applications is central to this modernization.
- These technologies not only streamline digital lottery operations but also provide critical tools for age verification technology and responsible gaming, ensuring the market’s integrity and long-term sustainability while navigating a complex regulatory compliance framework.
What will be the Size of the US Lottery Market during the forecast period?
Get Key Insights on Market Forecast (PDF) Request Free Sample
How is the US Lottery Market Segmented?
The us lottery industry research report provides comprehensive data (region-wise segment analysis), with forecasts and estimates in "USD billion" for the period 2026-2030, as well as historical data from 2020-2024 for the following segments.
- Type
- Scratch-off games
- Terminal-based games
- Sports lotteries
- Platform
- Traditional
- Online
- Product type
- Draw-based lottery
- Instant games
- Sports games
- Geography
- North America
- US
- North America
By Type Insights
The scratch-off games segment is estimated to witness significant growth during the forecast period.
The scratch-off games segment is a cornerstone of the market, offering immediate gratification through innovative instant-win games. Growth is propelled by continuous prize structure optimization and the introduction of high-tier instant games that appeal to diverse player demographics.
The use of licensed intellectual property and advanced holographic printing techniques enhances product value. Integrating cashless payment systems at point-of-sale terminals and robust player account management systems are vital for modernization.
This focus on product enhancement and accessibility ensures a steady stream of non-tax public benefit funding, with a state-governed commission reporting a 15% increase in player engagement after introducing a new portfolio of scratch-off games.
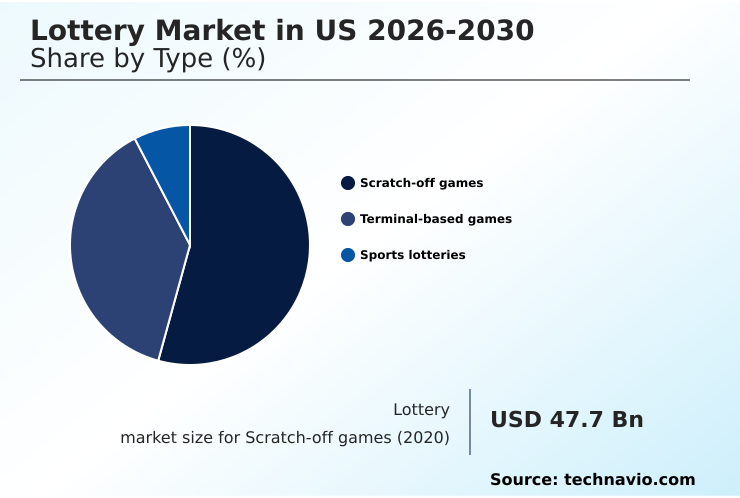
The Scratch-off games segment was valued at USD 63 billion in 2024 and showed a gradual increase during the forecast period.
Market Dynamics
Our researchers analyzed the data with 2025 as the base year, along with the key drivers, trends, and challenges. A holistic analysis of drivers will help companies refine their marketing strategies to gain a competitive advantage.
- The strategic evolution of the lottery market in US hinges on several interconnected factors. Central to this is the effective technology innovation in lottery game design, which moves beyond simple draws to create more engaging and interactive products. The broader digital transformation in state lottery systems is creating a more resilient and responsive infrastructure.
- However, this shift is not without its hurdles, chief among them being the regulatory challenges of iLottery expansion, which vary significantly between jurisdictions and often involve complex legislative processes.
- As operations become more digitized, addressing cyber security threats in digital lottery becomes a top-tier priority; a single high-profile breach can cause irreparable damage to public trust, impacting participation more severely than a 20% prize reduction. To counteract churn and enhance loyalty, operators are focusing on data analytics for lottery player retention, using insights to personalize communications and offers.
- Ultimately, success lies in achieving a seamless omnichannel lottery player experience integration, where the convenience of digital platforms complements the accessibility of traditional retail, creating a unified and secure ecosystem for all participants.
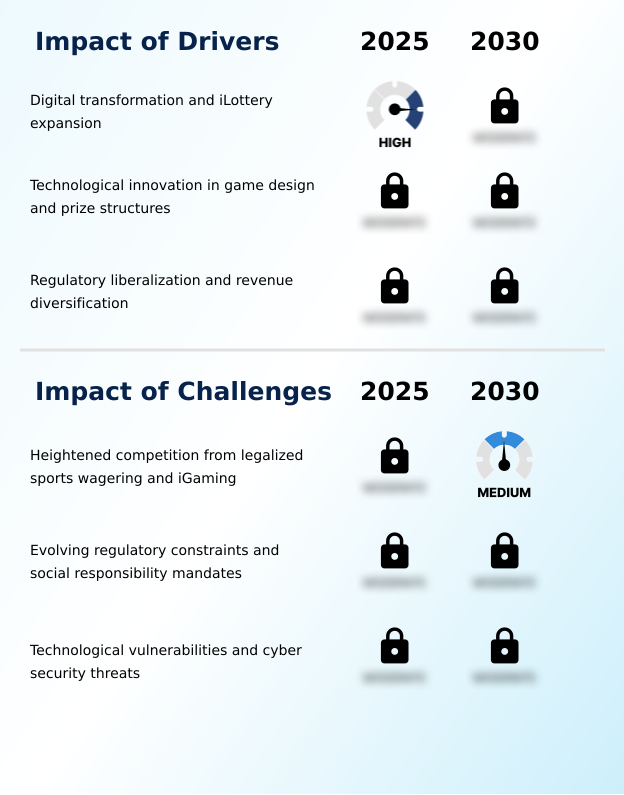
What are the key market drivers leading to the rise in the adoption of US Lottery Industry?
- The primary market driver is the rapid acceleration of digital transformation coupled with the strategic expansion of iLottery platforms across various jurisdictions.
- Digital transformation is a key driver, powered by the adoption of robust iLottery platform infrastructure and advanced digital lottery operations. Legacy system modernization is crucial, with operators transitioning to a flexible cloud-based gaming system that improves performance by 40%.
- The proliferation of the mobile lottery application and the deployment of self-service kiosks expand consumer access to terminal-based games. A state-governed commission can leverage these tools for predictive modeling for churn, reducing player attrition rates.
- This focus on technology-driven accessibility and efficiency is central to maximizing non-tax revenue generation, ensuring sustainable contributions to public funds.
What are the market trends shaping the US Lottery Industry?
- The convergence of traditional gaming with broader entertainment ecosystems is a significant market trend, transforming lottery products into comprehensive digital entertainment experiences.
- The market is shaped by the expansion of an omnichannel retail experience, seamlessly blending physical and digital touchpoints. The integration of gamified content transforms the user journey, with modern eInstant games offering a more engaging secure digital interface. Innovations include augmented reality components and second-chance drawings, which extend product lifecycles and are managed through sophisticated loyalty program integration.
- Adopting digital-to-retail bridge technology improves accessibility, reducing friction at purchase points by 25%. Furthermore, game mechanics analytics inform personalized marketing strategy, boosting player retention by up to 18% by tailoring content to individual preferences.
What challenges does the US Lottery Industry face during its growth?
- A key challenge affecting industry growth is the heightened competition from the rapid expansion of legalized sports wagering and iGaming platforms.
- Navigating the digital landscape presents challenges, including ensuring robust digital wallet security and adhering to a stringent regulatory compliance framework. Effective age verification technology and geolocation technology are critical for iLottery and lottery courier service offerings. Game integrity relies on certified random number generation and advanced fraud detection algorithms, while comprehensive cyber security protocols are essential to mitigate threats.
- Balancing innovation with social responsibility mandates remains a key issue, as meeting these requirements can increase operational compliance costs by over 15%. This pressure is compounded by the need to manage revenue cannibalization risk while expanding digital operations.
Exclusive Technavio Analysis on Customer Landscape
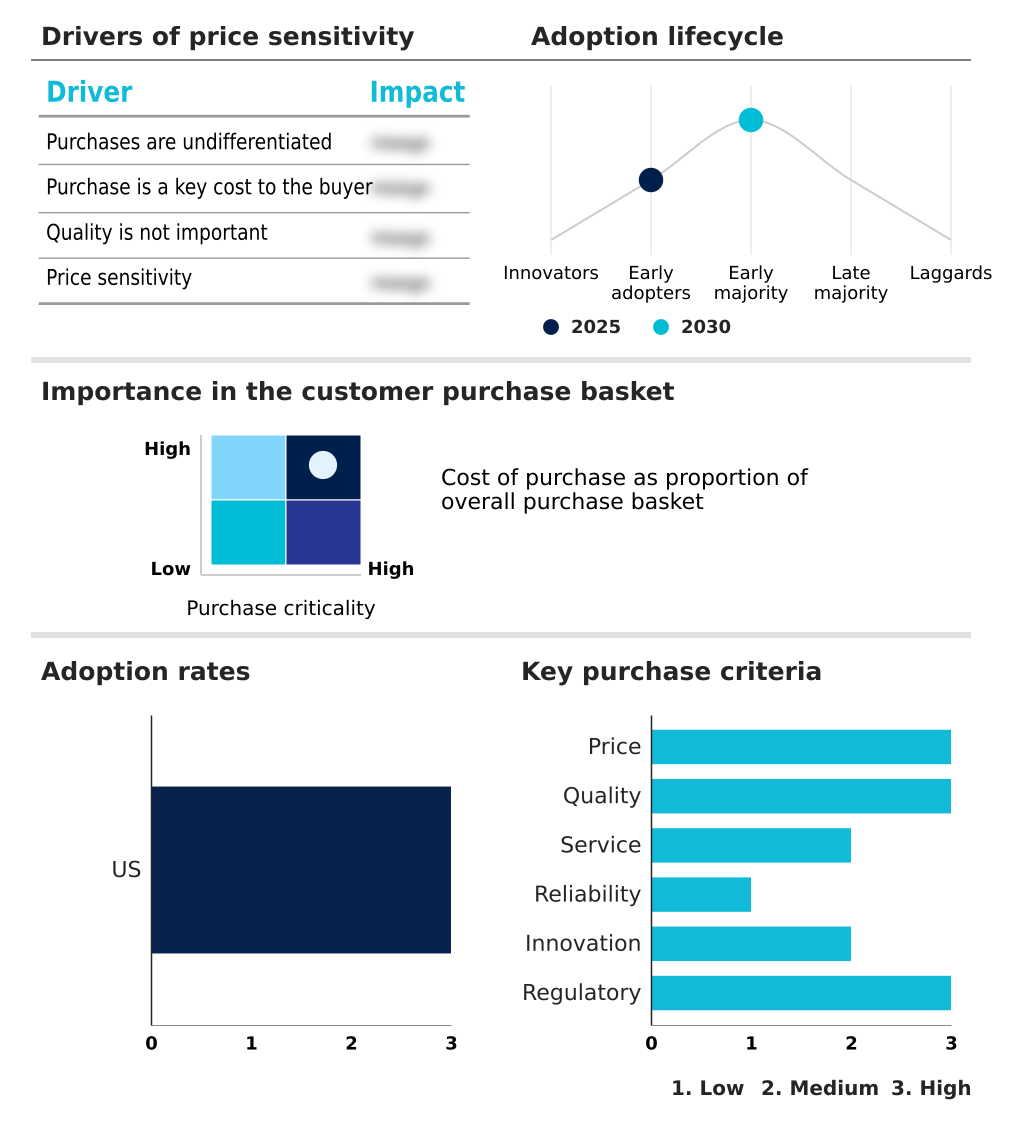
The us lottery market forecasting report includes the adoption lifecycle of the market, covering from the innovator’s stage to the laggard’s stage. It focuses on adoption rates in different regions based on penetration. Furthermore, the us lottery market report also includes key purchase criteria and drivers of price sensitivity to help companies evaluate and develop their market growth analysis strategies.
Customer Landscape of US Lottery Industry
Competitive Landscape
Companies are implementing various strategies, such as strategic alliances, us lottery market forecast, partnerships, mergers and acquisitions, geographical expansion, and product/service launches, to enhance their presence in the industry.
Brightstar Group - Specializes in draw-based games, digital lottery operations support, and consultancy services, enabling comprehensive management solutions for gaming entities.
The industry research and growth report includes detailed analyses of the competitive landscape of the market and information about key companies, including:
- Brightstar Group
- Florida Lottery
- Georgia Lottery Corp.
- Illinois Lottery
- International Game Technology
- INTRALOT SA
- Jackpocket LLC
- Lottery.com Inc.
- Massachusetts State Lottery
- Michigan Lottery
- NC Lottery
- NeoPollard Interactive LLC
- New York State Lottery
- Ohio Lottery Commission
- Pennsylvania Lottery
- Pollard Banknote Ltd.
- Scientific Games LLC
- Texas Lottery Commission
- The California State Lottery
- Virginia Lottery
Qualitative and quantitative analysis of companies has been conducted to help clients understand the wider business environment as well as the strengths and weaknesses of key industry players. Data is qualitatively analyzed to categorize companies as pure play, category-focused, industry-focused, and diversified; it is quantitatively analyzed to categorize companies as dominant, leading, strong, tentative, and weak.
Recent Development and News in Us lottery market
- In May, 2025, International Game Technology's global lottery organization initiated business as Brightstar Lottery, aligning with a strategic separation of its gaming and digital divisions.
- In April, 2025, NeoPollard Interactive LLC renewed its contract with the Virginia Lottery, extending their partnership for online play solutions.
- In March, 2025, Lottery.com Inc. transitioned its brand to SEGG Media Corporation, signaling a strategic pivot to a broader sports and entertainment focus.
- In January, 2025, the North Carolina Education Lottery launched a dedicated sports-linked gaming platform, expanding its digital offerings with interactive, tournament-based campaigns.
Dive into Technavio’s robust research methodology, blending expert interviews, extensive data synthesis, and validated models for unparalleled US Lottery Market insights. See full methodology.
| Market Scope | |
|---|---|
| Page number | 178 |
| Base year | 2025 |
| Historic period | 2020-2024 |
| Forecast period | 2026-2030 |
| Growth momentum & CAGR | Accelerate at a CAGR of 7.5% |
| Market growth 2026-2030 | USD 54.9 billion |
| Market structure | Fragmented |
| YoY growth 2025-2026(%) | 6.9% |
| Key countries | US |
| Competitive landscape | Leading Companies, Market Positioning of Companies, Competitive Strategies, and Industry Risks |
Research Analyst Overview
- The lottery market's evolution is defined by a strategic pivot to digital-first engagement, impacting boardroom decisions on technology investment. A robust iLottery platform, supported by secure digital lottery operations, forms the core of a modern omnichannel retail experience.
- This ecosystem, accessed via a secure digital interface, integrates products from terminal-based games and draw-based games to instant-win games, scratch-off games, and sports-linked gaming. Central to this are systems for player account management, relying on stringent age verification technology and geolocation technology.
- The consumer-facing mobile lottery application offers eInstant games and digital game content, while self-service kiosks and cashless payment systems modernize retail. Game mechanics analytics and player behavior analytics inform prize structure optimization. Behind the scenes, secure random number generation, robust digital wallet security, and tools for second-chance drawings are essential.
- Adherence to responsible gaming tools is paramount, with a successful implementation demonstrating a 25% reduction in high-risk play indicators. Even the logistics of a lottery courier service must be seamlessly integrated.
What are the Key Data Covered in this US Lottery Market Research and Growth Report?
-
What is the expected growth of the US Lottery Market between 2026 and 2030?
-
USD 54.9 billion, at a CAGR of 7.5%
-
-
What segmentation does the market report cover?
-
The report is segmented by Type (Scratch-off games, Terminal-based games, and Sports lotteries), Platform (Traditional, and Online), Product Type (Draw-based lottery, Instant games, and Sports games) and Geography (North America)
-
-
Which regions are analyzed in the report?
-
North America
-
-
What are the key growth drivers and market challenges?
-
Digital transformation and iLottery expansion, Heightened competition from legalized sports wagering and iGaming
-
-
Who are the major players in the US Lottery Market?
-
Brightstar Group, Florida Lottery, Georgia Lottery Corp., Illinois Lottery, International Game Technology, INTRALOT SA, Jackpocket LLC, Lottery.com Inc., Massachusetts State Lottery, Michigan Lottery, NC Lottery, NeoPollard Interactive LLC, New York State Lottery, Ohio Lottery Commission, Pennsylvania Lottery, Pollard Banknote Ltd., Scientific Games LLC, Texas Lottery Commission, The California State Lottery and Virginia Lottery
-
Market Research Insights
- The market's dynamics are increasingly shaped by technological adoption and strategic modernization. The integration of gamified content and the pursuit of a cohesive omnichannel retail experience are central to engaging modern consumers. The strategic use of a personalized marketing strategy, informed by predictive modeling for churn, has proven to increase player retention by over 15% in certain jurisdictions.
- Simultaneously, legacy system modernization efforts toward a cloud-based gaming system can reduce operational overhead by more than 20%. This digital pivot, however, must be balanced against revenue cannibalization risk and strict adherence to a comprehensive regulatory compliance framework, ensuring sustainable growth and continued public trust.
We can help! Our analysts can customize this us lottery market research report to meet your requirements.
 RIA -
RIA - 
