Low-cost Carrier (LCC) Market Analysis, Size, and Forecast 2026-2030: APAC (China, India, and Japan), North America (US, Canada, and Mexico), Europe (Germany, France, and UK), Middle East and Africa (Saudi Arabia, UAE, and South Africa), South America (Brazil and Argentina), and Rest of World (ROW)

Low-cost Carrier (LCC) Market Analysis, Size, and Forecast 2026-2030:
APAC (China, India, and Japan), North America (US, Canada, and Mexico), Europe (Germany, France, and UK), Middle East and Africa (Saudi Arabia, UAE, and South Africa), South America (Brazil and Argentina), and Rest of World (ROW)

Published: May 2026 281 Pages SKU: IRTNTR70566

Market Overview at a Glance

$406.53 B
Market Opportunity
15.6%
CAGR 2025 - 2030
42.1%
APAC Growth
$293.24 B
Passenger service segment 2024

Low-cost Carrier (LCC) Market Size 2026-2030

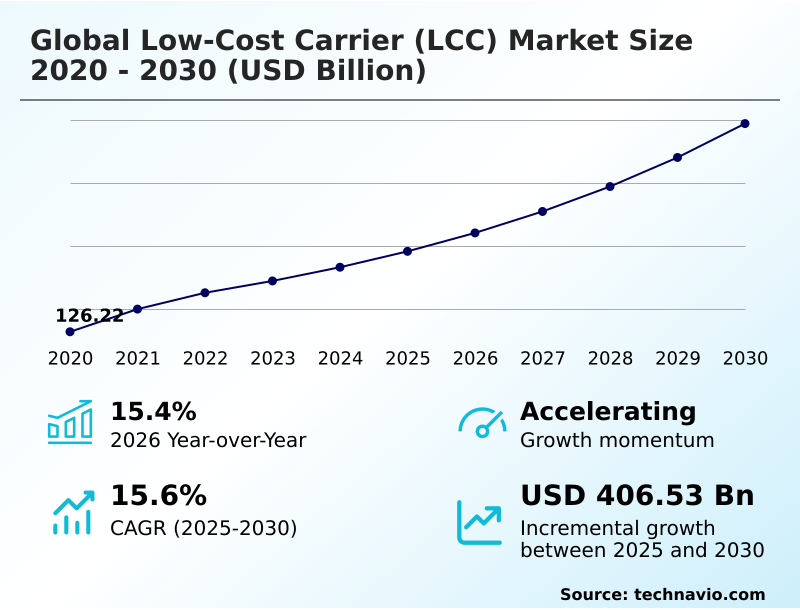
The low-cost carrier (lcc) market size is valued to increase by USD 406.53 billion, at a CAGR of 15.6% from 2025 to 2030. Strategic hybridization and premiumization of service models will drive the low-cost carrier (lcc) market.

Major Market Trends & Insights

  • APAC dominated the market and accounted for a 42.1% growth during the forecast period.
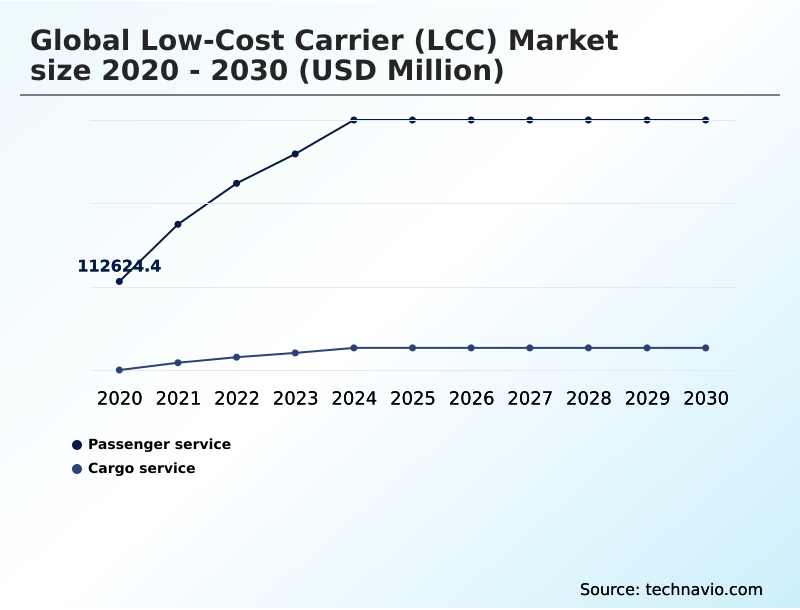
  • By Service - Passenger service segment was valued at USD 293.24 billion in 2024
  • By Type - Narrow body segment accounted for the largest market revenue share in 2024

Market Size & Forecast

  • Market Opportunities: USD 662.40 billion
  • Market Future Opportunities: USD 406.53 billion
  • CAGR from 2025 to 2030 : 15.6%

Market Summary

  • The Low-cost Carrier (LCC) Market is defined by a relentless focus on operational efficiency and cost minimization, traditionally achieved through unbundled services, high aircraft utilization, and point-to-point routes. However, the sector is undergoing a significant transformation.
  • A key driver is the strategic hybridization of service models, where carriers introduce premium elements like assigned seating and extra legroom to attract business travelers, moving away from the strict no-frills approach. This premiumization allows for diversified ancillary revenue models. Concurrently, technological advancements are reshaping the competitive landscape.
  • The induction of long-range narrowbody aircraft enables LCCs to enter transcontinental routes, challenging legacy carriers. Digitalization is also critical, with carriers implementing AI-driven dynamic pricing and enhancing digital connectivity with satellite internet. This evolution occurs amid significant challenges, including severe aircraft delivery shortfalls and engine supply chain bottlenecks, which hinder fleet modernization and growth plans.
  • For instance, a carrier's strategy to upgrade its fleet for better fuel efficiency might be disrupted by a two-year delay in aircraft deliveries, forcing it to extend leases on older, less efficient jets and impacting its cost structure and environmental targets. Geopolitical instability adds further pressure through volatile jet fuel prices.

What will be the Size of the Low-cost Carrier (LCC) Market during the forecast period?

Get Key Insights on Market Forecast (PDF) Get Free Sample

How is the Low-cost Carrier (LCC) Market Segmented?

The low-cost carrier (lcc) industry research report provides comprehensive data (region-wise segment analysis), with forecasts and estimates in "USD million" for the period 2026-2030, as well as historical data from 2020-2024 for the following segments.

  • Service
    • Passenger service
    • Cargo service
  • Type
    • Narrow body
    • Wide body
  • Application
    • Individual
    • Commercial
  • Geography
    • APAC
      • China
      • India
      • Japan
    • North America
      • US
      • Canada
      • Mexico
    • Europe
      • Germany
      • France
      • UK
    • Middle East and Africa
      • Saudi Arabia
      • UAE
      • South Africa
    • South America
      • Brazil
      • Argentina
    • Rest of World (ROW)

By Service Insights

The passenger service segment is estimated to witness significant growth during the forecast period.

The passenger service segment is evolving beyond its no-frills origins, driven by a strategic hybridization strategy and the premiumization of services. Operators are shifting from a purely transactional low-cost carrier business model to one focused on the digital passenger journey.

This includes the unbundling of services, allowing for customization through ancillary revenue models that offer priority boarding and extra legroom. This shift is designed to attract higher-yield travelers without compromising the core value proposition.

In some liberalized fiscal environments, carriers have achieved a 15% increase in annual passenger volume by rapidly expanding network rebalancing. This demonstrates a market where digital connectivity and enhanced cabin comfort are becoming standard expectations, even within the budget-focused framework.

Get Free Sample

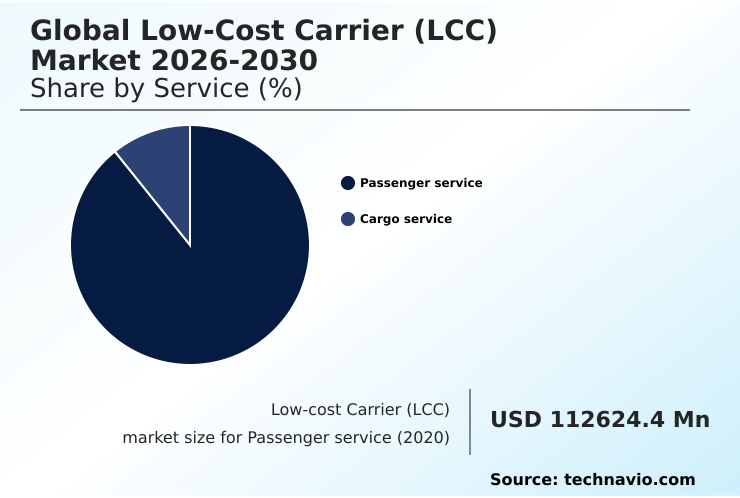
The Passenger service segment was valued at USD 293.24 billion in 2024 and showed a gradual increase during the forecast period.

Get Free Sample

Regional Analysis

APAC is estimated to contribute 42.1% to the growth of the global market during the forecast period.Technavio’s analysts have elaborately explained the regional trends and drivers that shape the market during the forecast period.

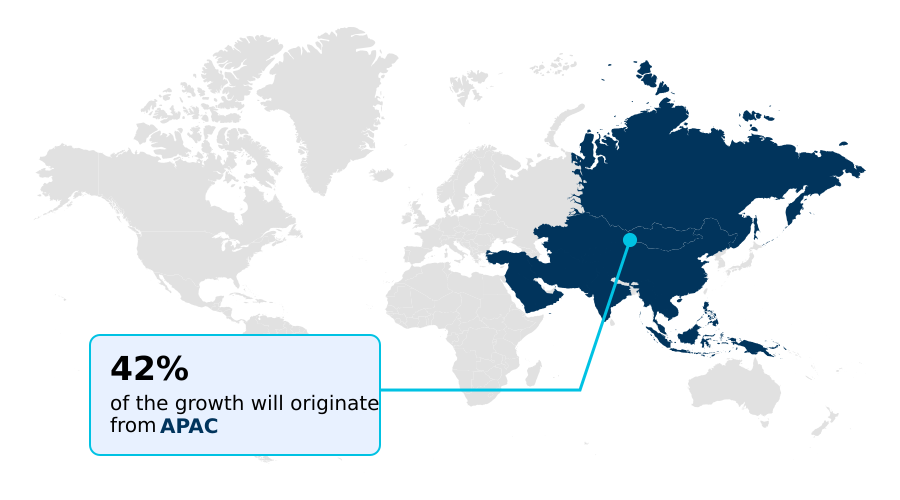
See How Low-cost Carrier (LCC) Market Demand is Rising in APAC Get Free Sample

The geographic landscape of the Low-cost Carrier (LCC) Market is diverse, shaped by regional connectivity demands and local economic factors.

In APAC, the unique archipelagic geography of nations like Indonesia makes air travel essential, driving robust domestic demand and fleet modernization.

North America is defined by a move toward a hybridization strategy, with carriers shifting away from open boarding to assigned seating to attract new customer segments.

Europe's market is characterized by intense fiscal migration, where network rebalancing occurs in direct response to aviation tax policies; a 50% hike in airport fees in one nation can trigger a base closure and reallocation of assets to a more favorable one.

This is part of a broader trend of service reliability and decarbonization mandates. The expansion into transcontinental routes is a global phenomenon, powered by long-range narrowbody aircraft with an 8,700-kilometer range, connecting secondary city pairs that were previously unviable.

Market Dynamics

Our researchers analyzed the data with 2025 as the base year, along with the key drivers, trends, and challenges. A holistic analysis of drivers will help companies refine their marketing strategies to gain a competitive advantage.

  • The evolution of the global Low-cost Carrier (LCC) Market 2026-2030 is increasingly dictated by the sophisticated interplay between cost control and revenue diversification. The impact of ancillary revenue on airline profitability has become a central strategic pillar, moving far beyond simple baggage fees to include dynamic, multi-tiered fare structures.
  • A key aspect of this transformation is how LCCs are using AI for dynamic pricing, enabling real-time adjustments that optimize load factors and yield. The comparison of narrowbody versus widebody LCC operations highlights another strategic frontier, as long-range narrowbody aircraft in low-cost models are enabling expansion into previously untenable transcontinental routes.
  • This, however, brings into focus the challenges of engine supply chain for LCCs, which can ground aircraft and disrupt expansion plans. Concurrently, the LCC hybridization and its effect on market competition is blurring the lines with legacy carriers.
  • As LCCs add premium features, they must manage the digital transformation in the LCC passenger experience to ensure it remains seamless and cost-effective. Low-cost carrier strategies for emerging markets are adapting to these global trends, balancing growth ambitions with local infrastructure constraints.
  • Finally, sustainability challenges for the low-cost carrier sector, including emissions targets and the high cost of SAF, represent a long-term hurdle that will require significant investment and innovation to overcome. Carriers that successfully integrate these strategies have reported double-digit improvements in unit revenue compared to those with more static models.

What are the key market drivers leading to the rise in the adoption of Low-cost Carrier (LCC) Industry?

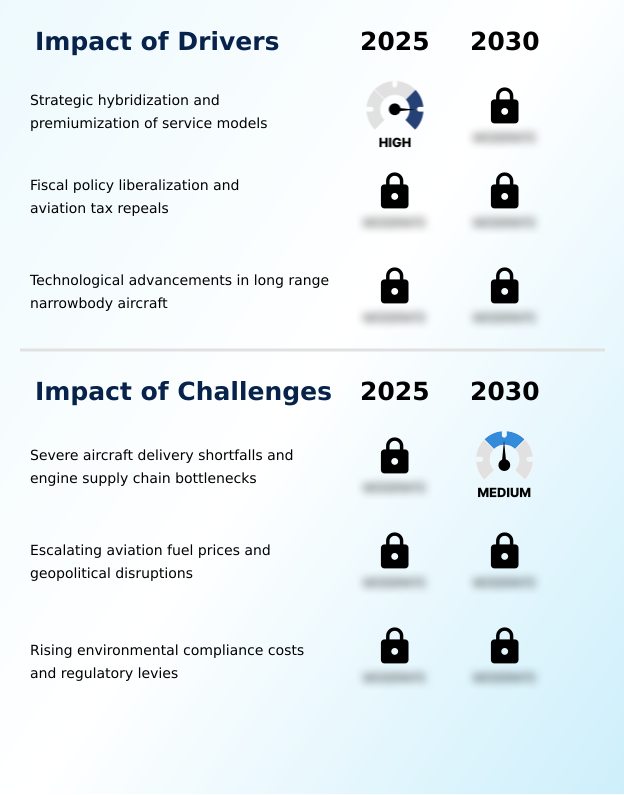
  • The strategic hybridization and premiumization of service models represent a key driver for the market.

  • The market's growth is propelled by several key drivers, most notably technological advancements in aircraft and the liberalization of fiscal policies.
  • The induction of next-generation long-range narrowbody aircraft, with a range of up to 8,700 kilometers, is a primary catalyst, enabling carriers to launch direct transcontinental routes with significantly lower operational costs.
  • This has been a critical factor in expanding the low-cost carrier business model into new international markets.
  • Additionally, fiscal policy plays a crucial role; the abolition of a national aviation tax in one European country directly resulted in an 800 million USD investment and a 15% increase in passenger traffic, showcasing how tax repeals can unlock immediate growth.
  • This market dynamism underscores the importance of both technological innovation and a favorable regulatory environment for sustained expansion.

What are the market trends shaping the Low-cost Carrier (LCC) Industry?

  • A strategic pivot toward hybridization and premiumization is a significant upcoming market trend. This involves budget airlines incorporating premium service elements to attract high-yield travelers.

  • Key trends are reshaping the Low-cost Carrier (LCC) Market, centered on a strategic pivot toward hybridization and advanced digitalization. The premiumization of services is a dominant theme, where carriers are moving beyond a no-frills model to offer tiered fare structures and priority boarding, enhancing the digital passenger journey. This approach has proven effective in attracting new customer segments.
  • Concurrently, the integration of generative AI and AI-driven copilots is optimizing customer service and dynamic pricing, with some carriers reporting a 20% improvement in support ticket resolution times.
  • The market is also defined by fiscal sensitivity and network rebalancing, as demonstrated when the removal of an aviation tax in one region led to an immediate 15% surge in passenger volume, prompting a strategic fiscal migration of assets. This highlights carriers' agility in response to government policies.

What challenges does the Low-cost Carrier (LCC) Industry face during its growth?

  • Severe aircraft delivery shortfalls and engine supply chain bottlenecks present a key challenge affecting industry growth.

  • The market faces significant operational and financial challenges that constrain growth. Severe aircraft delivery shortfalls and engine supply chain bottlenecks are a primary concern, with a global commercial aircraft backlog exceeding 5,300 units, forcing carriers to extend leases on older, less efficient jets. This directly impacts fleet modernization and operational costs.
  • Volatile energy prices represent another major headwind; geopolitical instability recently contributed to an 18.2% year-on-year increase in jet fuel prices in some markets.
  • Furthermore, rising environmental compliance costs, including the phasing out of free carbon emission allowances and mandates for expensive Sustainable Aviation Fuel (SAF), are adding significant financial pressure, particularly in regions with aggressive decarbonization mandates that challenge the viability of the ultra-low-cost model.

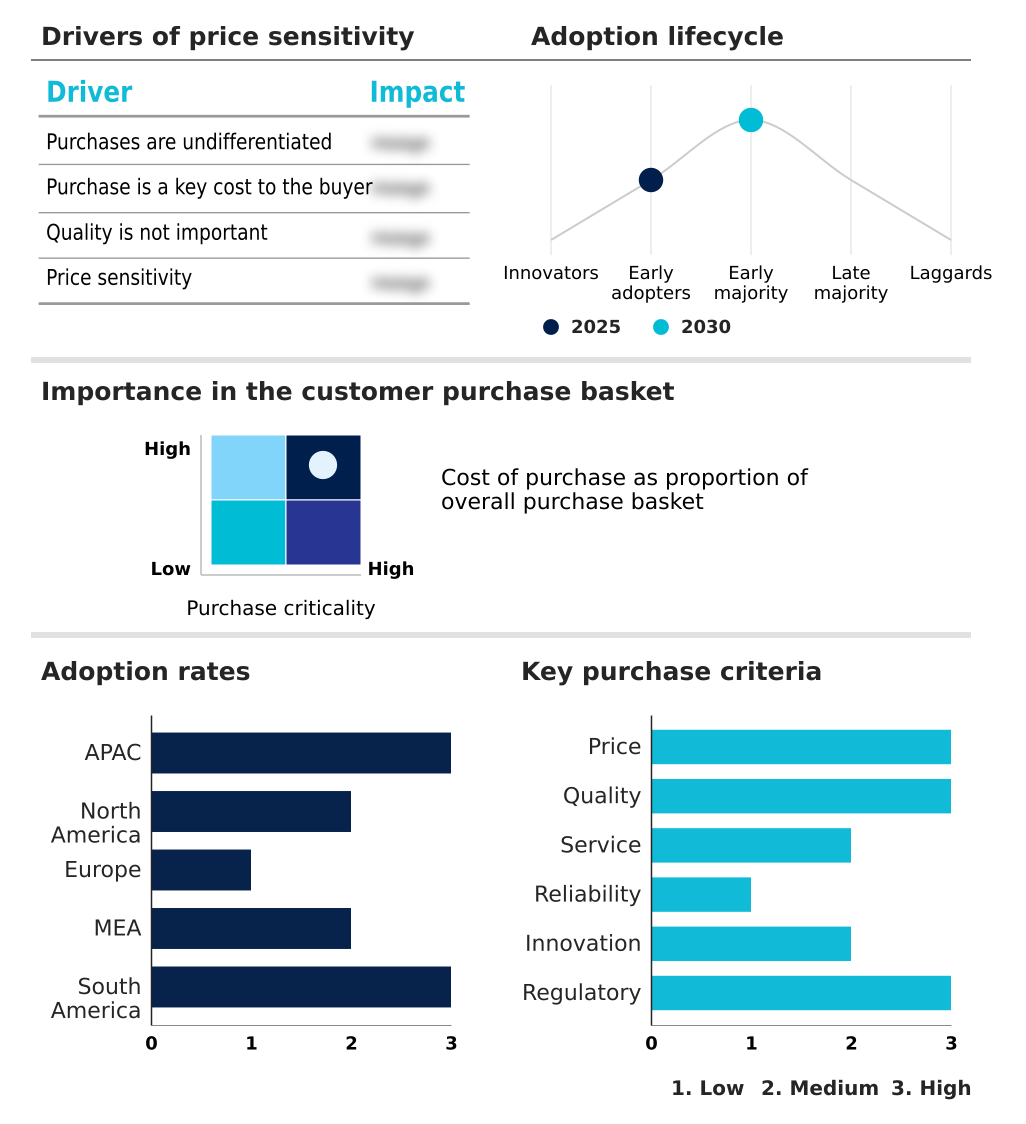
Exclusive Technavio Analysis on Customer Landscape

The low-cost carrier (lcc) market forecasting report includes the adoption lifecycle of the market, covering from the innovator’s stage to the laggard’s stage. It focuses on adoption rates in different regions based on penetration. Furthermore, the low-cost carrier (lcc) market report also includes key purchase criteria and drivers of price sensitivity to help companies evaluate and develop their market growth analysis strategies.

Customer Landscape of Low-cost Carrier (LCC) Industry

Competitive Landscape

Companies are implementing various strategies, such as strategic alliances, low-cost carrier (lcc) market forecast, partnerships, mergers and acquisitions, geographical expansion, and product/service launches, to enhance their presence in the industry.

Aeroenlaces Nacionales SA de CV - Analysis indicates a focus on point-to-point air travel services, leveraging an ultra-low-cost pricing structure to target price-sensitive passenger segments.

The industry research and growth report includes detailed analyses of the competitive landscape of the market and information about key companies, including:

  • Aeroenlaces Nacionales SA de CV
  • Air Arabia PJSC
  • Cebu Pacific
  • Dubai Aviation Corp.
  • easyJet plc
  • Eurowings GmbH
  • Flynas LCC
  • Frontier Group Holdings Inc.
  • Hong Kong Express Airways Ltd.
  • InterGlobe Aviation Ltd.
  • Move Travel Sdn Bhd
  • Norwegian Air Shuttle ASA
  • Pegasus Hava Tasimaciligi A.S.
  • Ryanair Holdings plc
  • Scoot Pte. Ltd.
  • Southwest Airlines Co.
  • Volaris
  • Volotea S.A.
  • Wizz Air Ltd.

Qualitative and quantitative analysis of companies has been conducted to help clients understand the wider business environment as well as the strengths and weaknesses of key industry players. Data is qualitatively analyzed to categorize companies as pure play, category-focused, industry-focused, and diversified; it is quantitatively analyzed to categorize companies as dominant, leading, strong, tentative, and weak.

Recent Development and News in Low-cost carrier (lcc) market

  • In December, 2024, Volaris and Viva Aerobus announced a definitive merger agreement to form a new holding company, Grupo Mas Vuelos, aiming to create a dominant regional player with a combined fleet of over 250 aircraft.
  • In January, 2025, Southwest Airlines officially began its transition to a standardized assigned seating system, introducing a tiered fare structure and extra legroom options to attract a larger share of the corporate travel segment.
  • In February, 2025, Zipair operated the first commercial passenger flight in Asia equipped with high-speed Starlink satellite internet, signaling a strategic push towards enhancing the digital experience on long-haul budget routes.
  • In March, 2025, Ryanair announced its largest-ever summer schedule for Sweden, an USD 800 million investment, in response to the Swedish government's decision to abolish the national aviation tax.

Dive into Technavio’s robust research methodology, blending expert interviews, extensive data synthesis, and validated models for unparalleled Low-cost Carrier (LCC) Market insights. See full methodology.

Market Scope
Page number 281
Base year 2025
Historic period 2020-2024
Forecast period 2026-2030
Growth momentum & CAGR Accelerate at a CAGR of 15.6%
Market growth 2026-2030 USD 406530.1 million
Market structure Fragmented
YoY growth 2025-2026(%) 15.4%
Key countries China, India, Japan, South Korea, Australia, Indonesia, US, Canada, Mexico, Germany, France, UK, Italy, Spain, The Netherlands, Saudi Arabia, UAE, South Africa, Egypt, Nigeria, Brazil, Argentina and Chile
Competitive landscape Leading Companies, Market Positioning of Companies, Competitive Strategies, and Industry Risks

Request Free Sample

Research Analyst Overview

  • The Low-cost Carrier (LCC) Market is fundamentally built on point-to-point routes and unbundled services, but it is now undergoing a critical evolution driven by fleet modernization and strategic repositioning. Carriers are aggressively replacing older fleets with next-generation narrowbody aircraft and, increasingly, widebody aircraft to enhance fuel efficiency and open new long-range markets.
  • This transition is crucial, as some new airframes offer up to a 16% reduction in fuel burn, a vital metric given the volatility of jet fuel prices. The operational model is also changing, with a notable shift from open boarding to assigned seating and tiered fare structures, designed to attract higher-yield passengers.
  • Digital connectivity, including satellite internet, is becoming a key differentiator. However, this growth is constrained by significant headwinds. The engine supply chain is a primary concern, with maintenance backlogs causing widespread groundings. Geopolitical instability and fiscal policy shifts, such as fluctuating aviation tax, create an unpredictable operating environment.
  • Furthermore, environmental pressures are mounting, with mandates for Sustainable Aviation Fuel (SAF) and carbon emission allowances increasing operational costs, forcing carriers to balance expansion with decarbonization mandates.

What are the Key Data Covered in this Low-cost Carrier (LCC) Market Research and Growth Report?

  • What is the expected growth of the Low-cost Carrier (LCC) Market between 2026 and 2030?

    • USD 406.53 billion, at a CAGR of 15.6%

  • What segmentation does the market report cover?

    • The report is segmented by Service (Passenger service, and Cargo service), Type (Narrow body, and Wide body), Application (Individual, and Commercial) and Geography (APAC, North America, Europe, Middle East and Africa, South America)

  • Which regions are analyzed in the report?

    • APAC, North America, Europe, Middle East and Africa and South America

  • What are the key growth drivers and market challenges?

    • Strategic hybridization and premiumization of service models, Severe aircraft delivery shortfalls and engine supply chain bottlenecks

  • Who are the major players in the Low-cost Carrier (LCC) Market?

    • Aeroenlaces Nacionales SA de CV, Air Arabia PJSC, Cebu Pacific, Dubai Aviation Corp., easyJet plc, Eurowings GmbH, Flynas LCC, Frontier Group Holdings Inc., Hong Kong Express Airways Ltd., InterGlobe Aviation Ltd., Move Travel Sdn Bhd, Norwegian Air Shuttle ASA, Pegasus Hava Tasimaciligi A.S., Ryanair Holdings plc, Scoot Pte. Ltd., Southwest Airlines Co., Volaris, Volotea S.A. and Wizz Air Ltd.

Market Research Insights

  • Market dynamics are increasingly shaped by the high price sensitivity of consumers, which results in low brand switching costs and intense competition. Airlines are responding by adopting sophisticated ancillary revenue models and pursuing greater operational efficiency. The strategic shift toward a hybridization strategy is evident, as carriers that enhance service reliability can capture higher-yield segments.
  • This has led to measurable outcomes; for instance, some operators have seen ancillary revenue contribute up to 40% of total revenue. Concurrently, network rebalancing is common, with carriers demonstrating fiscal migration by shifting capacity away from regions with high airport fees, where costs have increased by as much as 50%, toward more favorable tax environments.
  • This agility is crucial for survival in a market with low entry barriers for niche routes but significant economies of scale protecting incumbents.

We can help! Our analysts can customize this low-cost carrier (lcc) market research report to meet your requirements.

Get in touch

1. Executive Summary

1.1 Market overview

Executive Summary - Chart on Market Overview
Executive Summary - Data Table on Market Overview
Executive Summary - Chart on Global Market Characteristics
Executive Summary - Chart on Market by Geography
Executive Summary - Chart on Market Segmentation by Service
Executive Summary - Chart on Market Segmentation by Type
Executive Summary - Chart on Market Segmentation by Application
Executive Summary - Chart on Incremental Growth
Executive Summary - Data Table on Incremental Growth
Executive Summary - Chart on Company Market Positioning

2. Technavio Analysis

2.1 Analysis of price sensitivity, lifecycle, customer purchase basket, adoption rates, and purchase criteria

2.2 Criticality of inputs and Factors of differentiation

Chart on Overview on criticality of inputs and factors of differentiation

2.3 Factors of disruption

Chart on Overview on factors of disruption

2.4 Impact of drivers and challenges

Chart on Impact of drivers and challenges in 2025 and 2030

3. Market Landscape

3.1 Market ecosystem

Chart on Parent Market
Data Table on - Parent Market

3.2 Market characteristics

Chart on Market characteristics analysis

3.3 Value chain analysis

Chart on Value chain analysis

4. Market Sizing

4.1 Market definition

Data Table on Offerings of companies included in the market definition

4.2 Market segment analysis

Market segments

4.3 Market size 2025

4.4 Market outlook: Forecast for 2025-2030

Chart on Global - Market size and forecast 2025-2030 ($ million)
Data Table on Global - Market size and forecast 2025-2030 ($ million)
Chart on Global Market: Year-over-year growth 2025-2030 (%)
Data Table on Global Market: Year-over-year growth 2025-2030 (%)

5. Historic Market Size

5.1 Global Low-Cost Carrier (LCC) Market 2020 - 2024

Historic Market Size - Data Table on Global Low-Cost Carrier (LCC) Market 2020 - 2024 ($ million)

5.2 Service segment analysis 2020 - 2024

Historic Market Size - Service Segment 2020 - 2024 ($ million)

5.3 Type segment analysis 2020 - 2024

Historic Market Size - Type Segment 2020 - 2024 ($ million)

5.4 Application segment analysis 2020 - 2024

Historic Market Size - Application Segment 2020 - 2024 ($ million)

5.5 Geography segment analysis 2020 - 2024

Historic Market Size - Geography Segment 2020 - 2024 ($ million)

5.6 Country segment analysis 2020 - 2024

Historic Market Size - Country Segment 2020 - 2024 ($ million)

6. Qualitative Analysis

6.1 Impact of AI on global low-cost carrier (LCC) market

6.2 Impact of geopolitical conflict on global low-cost carrier (LCC) market

7. Five Forces Analysis

7.1 Five forces summary

Five forces analysis - Comparison between 2025 and 2030

7.2 Bargaining power of buyers

Bargaining power of buyers - Impact of key factors 2025 and 2030

7.3 Bargaining power of suppliers

Bargaining power of suppliers - Impact of key factors in 2025 and 2030

7.4 Threat of new entrants

Threat of new entrants - Impact of key factors in 2025 and 2030

7.5 Threat of substitutes

Threat of substitutes - Impact of key factors in 2025 and 2030

7.6 Threat of rivalry

Threat of rivalry - Impact of key factors in 2025 and 2030

7.7 Market condition

Chart on Market condition - Five forces 2025 and 2030

8. Market Segmentation by Service

8.1 Market segments

Chart on Service - Market share 2025-2030 (%)
Data Table on Service - Market share 2025-2030 (%)

8.2 Comparison by Service

Chart on Comparison by Service
Data Table on Comparison by Service

8.3 Passenger service - Market size and forecast 2025-2030

Chart on Passenger service - Market size and forecast 2025-2030 ($ million)
Data Table on Passenger service - Market size and forecast 2025-2030 ($ million)
Chart on Passenger service - Year-over-year growth 2025-2030 (%)
Data Table on Passenger service - Year-over-year growth 2025-2030 (%)

8.4 Cargo service - Market size and forecast 2025-2030

Chart on Cargo service - Market size and forecast 2025-2030 ($ million)
Data Table on Cargo service - Market size and forecast 2025-2030 ($ million)
Chart on Cargo service - Year-over-year growth 2025-2030 (%)
Data Table on Cargo service - Year-over-year growth 2025-2030 (%)

8.5 Market opportunity by Service

Market opportunity by Service ($ million)
Data Table on Market opportunity by Service ($ million)

9. Market Segmentation by Type

9.1 Market segments

Chart on Type - Market share 2025-2030 (%)
Data Table on Type - Market share 2025-2030 (%)

9.2 Comparison by Type

Chart on Comparison by Type
Data Table on Comparison by Type

9.3 Narrow body - Market size and forecast 2025-2030

Chart on Narrow body - Market size and forecast 2025-2030 ($ million)
Data Table on Narrow body - Market size and forecast 2025-2030 ($ million)
Chart on Narrow body - Year-over-year growth 2025-2030 (%)
Data Table on Narrow body - Year-over-year growth 2025-2030 (%)

9.4 Wide body - Market size and forecast 2025-2030

Chart on Wide body - Market size and forecast 2025-2030 ($ million)
Data Table on Wide body - Market size and forecast 2025-2030 ($ million)
Chart on Wide body - Year-over-year growth 2025-2030 (%)
Data Table on Wide body - Year-over-year growth 2025-2030 (%)

9.5 Market opportunity by Type

Market opportunity by Type ($ million)
Data Table on Market opportunity by Type ($ million)

10. Market Segmentation by Application

10.1 Market segments

Chart on Application - Market share 2025-2030 (%)
Data Table on Application - Market share 2025-2030 (%)

10.2 Comparison by Application

Chart on Comparison by Application
Data Table on Comparison by Application

10.3 Individual - Market size and forecast 2025-2030

Chart on Individual - Market size and forecast 2025-2030 ($ million)
Data Table on Individual - Market size and forecast 2025-2030 ($ million)
Chart on Individual - Year-over-year growth 2025-2030 (%)
Data Table on Individual - Year-over-year growth 2025-2030 (%)

10.4 Commercial - Market size and forecast 2025-2030

Chart on Commercial - Market size and forecast 2025-2030 ($ million)
Data Table on Commercial - Market size and forecast 2025-2030 ($ million)
Chart on Commercial - Year-over-year growth 2025-2030 (%)
Data Table on Commercial - Year-over-year growth 2025-2030 (%)

10.5 Market opportunity by Application

Market opportunity by Application ($ million)
Data Table on Market opportunity by Application ($ million)

11. Customer Landscape

11.1 Customer landscape overview

Analysis of price sensitivity, lifecycle, customer purchase basket, adoption rates, and purchase criteria

12. Geographic Landscape

12.1 Geographic segmentation

Chart on Market share by geography 2025-2030 (%)
Data Table on Market share by geography 2025-2030 (%)

12.2 Geographic comparison

Chart on Geographic comparison
Data Table on Geographic comparison

12.3 APAC - Market size and forecast 2025-2030

Chart on APAC - Market size and forecast 2025-2030 ($ million)
Data Table on APAC - Market size and forecast 2025-2030 ($ million)
Chart on APAC - Year-over-year growth 2025-2030 (%)
Data Table on APAC - Year-over-year growth 2025-2030 (%)
Chart on Regional Comparison - APAC
Data Table on Regional Comparison - APAC

12.3.1 China - Market size and forecast 2025-2030

Chart on China - Market size and forecast 2025-2030 ($ million)
Data Table on China - Market size and forecast 2025-2030 ($ million)
Chart on China - Year-over-year growth 2025-2030 (%)
Data Table on China - Year-over-year growth 2025-2030 (%)

12.3.2 India - Market size and forecast 2025-2030

Chart on India - Market size and forecast 2025-2030 ($ million)
Data Table on India - Market size and forecast 2025-2030 ($ million)
Chart on India - Year-over-year growth 2025-2030 (%)
Data Table on India - Year-over-year growth 2025-2030 (%)

12.3.3 Japan - Market size and forecast 2025-2030

Chart on Japan - Market size and forecast 2025-2030 ($ million)
Data Table on Japan - Market size and forecast 2025-2030 ($ million)
Chart on Japan - Year-over-year growth 2025-2030 (%)
Data Table on Japan - Year-over-year growth 2025-2030 (%)

12.3.4 South Korea - Market size and forecast 2025-2030

Chart on South Korea - Market size and forecast 2025-2030 ($ million)
Data Table on South Korea - Market size and forecast 2025-2030 ($ million)
Chart on South Korea - Year-over-year growth 2025-2030 (%)
Data Table on South Korea - Year-over-year growth 2025-2030 (%)

12.3.5 Australia - Market size and forecast 2025-2030

Chart on Australia - Market size and forecast 2025-2030 ($ million)
Data Table on Australia - Market size and forecast 2025-2030 ($ million)
Chart on Australia - Year-over-year growth 2025-2030 (%)
Data Table on Australia - Year-over-year growth 2025-2030 (%)

12.3.6 Indonesia - Market size and forecast 2025-2030

Chart on Indonesia - Market size and forecast 2025-2030 ($ million)
Data Table on Indonesia - Market size and forecast 2025-2030 ($ million)
Chart on Indonesia - Year-over-year growth 2025-2030 (%)
Data Table on Indonesia - Year-over-year growth 2025-2030 (%)

12.4 North America - Market size and forecast 2025-2030

Chart on North America - Market size and forecast 2025-2030 ($ million)
Data Table on North America - Market size and forecast 2025-2030 ($ million)
Chart on North America - Year-over-year growth 2025-2030 (%)
Data Table on North America - Year-over-year growth 2025-2030 (%)
Chart on Regional Comparison - North America
Data Table on Regional Comparison - North America

12.4.1 US - Market size and forecast 2025-2030

Chart on US - Market size and forecast 2025-2030 ($ million)
Data Table on US - Market size and forecast 2025-2030 ($ million)
Chart on US - Year-over-year growth 2025-2030 (%)
Data Table on US - Year-over-year growth 2025-2030 (%)

12.4.2 Canada - Market size and forecast 2025-2030

Chart on Canada - Market size and forecast 2025-2030 ($ million)
Data Table on Canada - Market size and forecast 2025-2030 ($ million)
Chart on Canada - Year-over-year growth 2025-2030 (%)
Data Table on Canada - Year-over-year growth 2025-2030 (%)

12.4.3 Mexico - Market size and forecast 2025-2030

Chart on Mexico - Market size and forecast 2025-2030 ($ million)
Data Table on Mexico - Market size and forecast 2025-2030 ($ million)
Chart on Mexico - Year-over-year growth 2025-2030 (%)
Data Table on Mexico - Year-over-year growth 2025-2030 (%)

12.5 Europe - Market size and forecast 2025-2030

Chart on Europe - Market size and forecast 2025-2030 ($ million)
Data Table on Europe - Market size and forecast 2025-2030 ($ million)
Chart on Europe - Year-over-year growth 2025-2030 (%)
Data Table on Europe - Year-over-year growth 2025-2030 (%)
Chart on Regional Comparison - Europe
Data Table on Regional Comparison - Europe

12.5.1 Germany - Market size and forecast 2025-2030

Chart on Germany - Market size and forecast 2025-2030 ($ million)
Data Table on Germany - Market size and forecast 2025-2030 ($ million)
Chart on Germany - Year-over-year growth 2025-2030 (%)
Data Table on Germany - Year-over-year growth 2025-2030 (%)

12.5.2 France - Market size and forecast 2025-2030

Chart on France - Market size and forecast 2025-2030 ($ million)
Data Table on France - Market size and forecast 2025-2030 ($ million)
Chart on France - Year-over-year growth 2025-2030 (%)
Data Table on France - Year-over-year growth 2025-2030 (%)

12.5.3 UK - Market size and forecast 2025-2030

Chart on UK - Market size and forecast 2025-2030 ($ million)
Data Table on UK - Market size and forecast 2025-2030 ($ million)
Chart on UK - Year-over-year growth 2025-2030 (%)
Data Table on UK - Year-over-year growth 2025-2030 (%)

12.5.4 Italy - Market size and forecast 2025-2030

Chart on Italy - Market size and forecast 2025-2030 ($ million)
Data Table on Italy - Market size and forecast 2025-2030 ($ million)
Chart on Italy - Year-over-year growth 2025-2030 (%)
Data Table on Italy - Year-over-year growth 2025-2030 (%)

12.5.5 Spain - Market size and forecast 2025-2030

Chart on Spain - Market size and forecast 2025-2030 ($ million)
Data Table on Spain - Market size and forecast 2025-2030 ($ million)
Chart on Spain - Year-over-year growth 2025-2030 (%)
Data Table on Spain - Year-over-year growth 2025-2030 (%)

12.5.6 The Netherlands - Market size and forecast 2025-2030

Chart on The Netherlands - Market size and forecast 2025-2030 ($ million)
Data Table on The Netherlands - Market size and forecast 2025-2030 ($ million)
Chart on The Netherlands - Year-over-year growth 2025-2030 (%)
Data Table on The Netherlands - Year-over-year growth 2025-2030 (%)

12.6 Middle East and Africa - Market size and forecast 2025-2030

Chart on Middle East and Africa - Market size and forecast 2025-2030 ($ million)
Data Table on Middle East and Africa - Market size and forecast 2025-2030 ($ million)
Chart on Middle East and Africa - Year-over-year growth 2025-2030 (%)
Data Table on Middle East and Africa - Year-over-year growth 2025-2030 (%)
Chart on Regional Comparison - Middle East and Africa
Data Table on Regional Comparison - Middle East and Africa

12.6.1 Saudi Arabia - Market size and forecast 2025-2030

Chart on Saudi Arabia - Market size and forecast 2025-2030 ($ million)
Data Table on Saudi Arabia - Market size and forecast 2025-2030 ($ million)
Chart on Saudi Arabia - Year-over-year growth 2025-2030 (%)
Data Table on Saudi Arabia - Year-over-year growth 2025-2030 (%)

12.6.2 UAE - Market size and forecast 2025-2030

Chart on UAE - Market size and forecast 2025-2030 ($ million)
Data Table on UAE - Market size and forecast 2025-2030 ($ million)
Chart on UAE - Year-over-year growth 2025-2030 (%)
Data Table on UAE - Year-over-year growth 2025-2030 (%)

12.6.3 South Africa - Market size and forecast 2025-2030

Chart on South Africa - Market size and forecast 2025-2030 ($ million)
Data Table on South Africa - Market size and forecast 2025-2030 ($ million)
Chart on South Africa - Year-over-year growth 2025-2030 (%)
Data Table on South Africa - Year-over-year growth 2025-2030 (%)

12.6.4 Egypt - Market size and forecast 2025-2030

Chart on Egypt - Market size and forecast 2025-2030 ($ million)
Data Table on Egypt - Market size and forecast 2025-2030 ($ million)
Chart on Egypt - Year-over-year growth 2025-2030 (%)
Data Table on Egypt - Year-over-year growth 2025-2030 (%)

12.6.5 Nigeria - Market size and forecast 2025-2030

Chart on Nigeria - Market size and forecast 2025-2030 ($ million)
Data Table on Nigeria - Market size and forecast 2025-2030 ($ million)
Chart on Nigeria - Year-over-year growth 2025-2030 (%)
Data Table on Nigeria - Year-over-year growth 2025-2030 (%)

12.7 South America - Market size and forecast 2025-2030

Chart on South America - Market size and forecast 2025-2030 ($ million)
Data Table on South America - Market size and forecast 2025-2030 ($ million)
Chart on South America - Year-over-year growth 2025-2030 (%)
Data Table on South America - Year-over-year growth 2025-2030 (%)
Chart on Regional Comparison - South America
Data Table on Regional Comparison - South America

12.7.1 Brazil - Market size and forecast 2025-2030

Chart on Brazil - Market size and forecast 2025-2030 ($ million)
Data Table on Brazil - Market size and forecast 2025-2030 ($ million)
Chart on Brazil - Year-over-year growth 2025-2030 (%)
Data Table on Brazil - Year-over-year growth 2025-2030 (%)

12.7.2 Argentina - Market size and forecast 2025-2030

Chart on Argentina - Market size and forecast 2025-2030 ($ million)
Data Table on Argentina - Market size and forecast 2025-2030 ($ million)
Chart on Argentina - Year-over-year growth 2025-2030 (%)
Data Table on Argentina - Year-over-year growth 2025-2030 (%)

12.7.3 Chile - Market size and forecast 2025-2030

Chart on Chile - Market size and forecast 2025-2030 ($ million)
Data Table on Chile - Market size and forecast 2025-2030 ($ million)
Chart on Chile - Year-over-year growth 2025-2030 (%)
Data Table on Chile - Year-over-year growth 2025-2030 (%)

12.8 Market opportunity by geography

Market opportunity by geography ($ million)
Data Tables on Market opportunity by geography ($ million)

13. Drivers, Challenges, and Opportunity

13.1 Market drivers

Strategic hybridization and premiumization of service models
Fiscal policy liberalization and aviation tax repeals
Technological advancements in long range narrowbody aircraft

13.2 Market challenges

Severe aircraft delivery shortfalls and engine supply chain bottlenecks
Escalating aviation fuel prices and geopolitical disruptions
Rising environmental compliance costs and regulatory levies

13.3 Impact of drivers and challenges

Impact of drivers and challenges in 2025 and 2030

13.4 Market opportunities

Strategic pivot toward hybridization and premiumization
Technological convergence and high speed digital connectivity
Fiscal sensitivity and regional network rebalancing

14. Competitive Landscape

14.1 Overview

14.2

Overview on criticality of inputs and factors of differentiation

14.3 Landscape disruption

Overview on factors of disruption

14.4 Industry risks

Impact of key risks on business

15. Competitive Analysis

15.1 Companies profiled

Companies covered

15.2 Company ranking index

15.3 Market positioning of companies

Matrix on companies position and classification

15.4 Aeroenlaces Nacionales SA de CV

Aeroenlaces Nacionales SA de CV - Overview
Aeroenlaces Nacionales SA de CV - Product / Service
Aeroenlaces Nacionales SA de CV - Key offerings
SWOT

15.5 Air Arabia PJSC

Air Arabia PJSC - Overview
Air Arabia PJSC - Business segments
Air Arabia PJSC - Key offerings
Air Arabia PJSC - Segment focus
SWOT

15.6 Cebu Pacific

Cebu Pacific - Overview
Cebu Pacific - Product / Service
Cebu Pacific - Key offerings
SWOT

15.7 easyJet plc

easyJet plc - Overview
easyJet plc - Business segments
easyJet plc - Key offerings
easyJet plc - Segment focus
SWOT

15.8 Eurowings GmbH

Eurowings GmbH - Overview
Eurowings GmbH - Product / Service
Eurowings GmbH - Key offerings
SWOT

15.9 Frontier Group Holdings Inc.

Frontier Group Holdings Inc. - Overview
Frontier Group Holdings Inc. - Product / Service
Frontier Group Holdings Inc. - Key offerings
SWOT

15.10 InterGlobe Aviation Ltd.

InterGlobe Aviation Ltd. - Overview
InterGlobe Aviation Ltd. - Product / Service
InterGlobe Aviation Ltd. - Key offerings
SWOT

15.11 Move Travel Sdn Bhd

Move Travel Sdn Bhd - Overview
Move Travel Sdn Bhd - Product / Service
Move Travel Sdn Bhd - Key offerings
SWOT

15.12 Norwegian Air Shuttle ASA

Norwegian Air Shuttle ASA - Overview
Norwegian Air Shuttle ASA - Business segments
Norwegian Air Shuttle ASA - Key offerings
Norwegian Air Shuttle ASA - Segment focus
SWOT

15.13 Pegasus Hava Tasimaciligi A.S.

Pegasus Hava Tasimaciligi A.S. - Overview
Pegasus Hava Tasimaciligi A.S. - Business segments
Pegasus Hava Tasimaciligi A.S. - Key offerings
Pegasus Hava Tasimaciligi A.S. - Segment focus
SWOT

15.14 Ryanair Holdings plc

Ryanair Holdings plc - Overview
Ryanair Holdings plc - Product / Service
Ryanair Holdings plc - Key offerings
SWOT

15.15 Southwest Airlines Co.

Southwest Airlines Co. - Overview
Southwest Airlines Co. - Product / Service
Southwest Airlines Co. - Key offerings
SWOT

15.16 Volaris

Volaris - Overview
Volaris - Product / Service
Volaris - Key offerings
SWOT

15.17 Volotea S.A.

Volotea S.A. - Overview
Volotea S.A. - Product / Service
Volotea S.A. - Key offerings
SWOT

15.18 Wizz Air Ltd.

Wizz Air Ltd. - Overview
Wizz Air Ltd. - Product / Service
Wizz Air Ltd. - Key offerings
SWOT

16. Appendix

16.1 Scope of the report

Market definition
Objectives
Notes and caveats

16.2 Inclusions and exclusions checklist

Inclusions checklist
Exclusions checklist

16.3 Currency conversion rates for US$

16.4 Research methodology

16.5 Data procurement

Information sources

16.6 Data validation

16.7 Validation techniques employed for market sizing

16.8 Data synthesis

16.9 360 degree market analysis

16.10 List of abbreviations

Research Methodology

Technavio presents a detailed picture of the market by way of study, synthesis, and summation of data from multiple sources. The analysts have presented the various facets of the market with a particular focus on identifying the key industry influencers. The data thus presented is comprehensive, reliable, and the result of extensive research, both primary and secondary.

INFORMATION SOURCES

Primary sources

  • Manufacturers and suppliers
  • Channel partners
  • Industry experts
  • Strategic decision makers

Secondary sources

  • Industry journals and periodicals
  • Government data
  • Financial reports of key industry players
  • Historical data
  • Press releases

DATA ANALYSIS

Data Synthesis

  • Collation of data
  • Estimation of key figures
  • Analysis of derived insights

Data Validation

  • Triangulation with data models
  • Reference against proprietary databases
  • Corroboration with industry experts

REPORT WRITING

Qualitative

  • Market drivers
  • Market challenges
  • Market trends
  • Five forces analysis

Quantitative

  • Market size and forecast
  • Market segmentation
  • Geographical insights
  • Competitive landscape

Interested in this report?

Get your sample now to see our research methodology and insights!

Download Now

Frequently Asked Questions

Low-cost Carrier (LCC) market growth will increase by USD 406530.1 million during 2026-2030.

The Low-cost Carrier (LCC) market is expected to grow at a CAGR of 15.6% during 2026-2030.

Low-cost Carrier (LCC) market is segmented by Service (Passenger service, Cargo service) Type (Narrow body, Wide body) Application (Individual, Commercial)

Aeroenlaces Nacionales SA de CV, Air Arabia PJSC, Cebu Pacific, Dubai Aviation Corp., easyJet plc, Eurowings GmbH, Flynas LCC, Frontier Group Holdings Inc., Hong Kong Express Airways Ltd., InterGlobe Aviation Ltd., Move Travel Sdn Bhd, Norwegian Air Shuttle ASA, Pegasus Hava Tasimaciligi A.S., Ryanair Holdings plc, Scoot Pte. Ltd., Southwest Airlines Co., Volaris, Volotea S.A., Wizz Air Ltd. are a few of the key vendors in the Low-cost Carrier (LCC) market.

APAC will register the highest growth rate of 42.1% among the other regions. Therefore, the Low-cost Carrier (LCC) market in APAC is expected to garner significant business opportunities for the vendors during the forecast period.

China, India, Japan, South Korea, Australia, Indonesia, US, Canada, Mexico, Germany, France, UK, Italy, Spain, The Netherlands, Saudi Arabia, UAE, South Africa, Egypt, Nigeria, Brazil, Argentina, Chile

  • Strategic hybridization and premiumization of service models is the driving factor this market.

The Low-cost Carrier (LCC) market vendors should focus on grabbing business opportunities from the Service segment as it accounted for the largest market share in the base year.
RIA - Research AI Assistant
Ask RIA