Lubricant Packaging Market Size 2024-2028
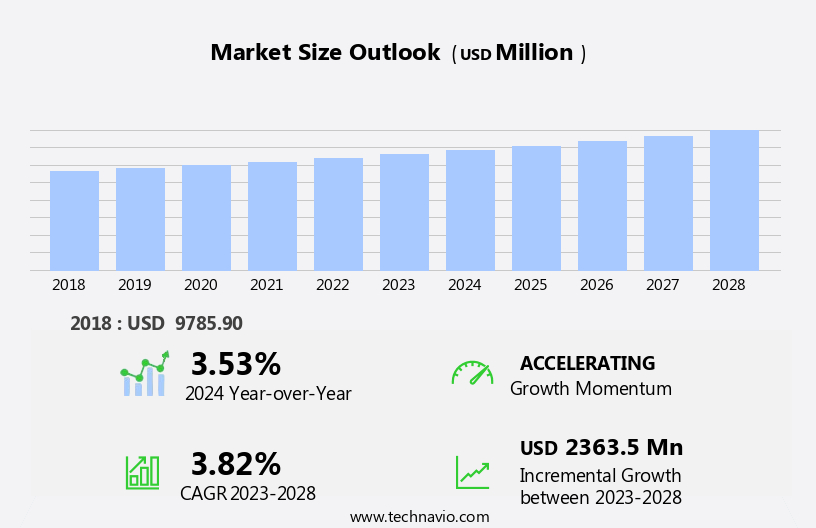
The lubricant packaging market size is forecast to increase by USD 2.36 billion, at a CAGR of 3.82% between 2023 and 2028.
- The market is experiencing significant growth, driven primarily by the expansion of the automotive industry. The increasing demand for automobiles, particularly in emerging economies, is fueling the need for lubricants and, consequently, their packaging. Additionally, there is a growing trend towards environmentally friendly packaging solutions, as consumers and regulatory bodies push for more sustainable options. However, the market faces challenges in the form of fluctuating raw material prices, which can impact the cost of production and profitability for manufacturers. To capitalize on the market's opportunities, companies must stay abreast of these trends and adapt their strategies accordingly.
- This may involve investing in eco-friendly packaging technologies or implementing cost management strategies to mitigate the impact of raw material price fluctuations. Overall, the market presents both challenges and opportunities for players, requiring strategic planning and agility to succeed.
What will be the Size of the Lubricant Packaging Market during the forecast period?
Explore in-depth regional segment analysis with market size data - historical 2018-2022 and forecasts 2024-2028 - in the full report.
Request Free Sample
The market continues to evolve, driven by advancements in technology and shifting consumer preferences. Moisture barrier films and oxygen barrier packaging are increasingly popular choices to ensure product efficacy and prolong shelf life. Automated filling systems streamline production processes, while sustainable packaging materials reduce environmental impact. E-commerce packaging demands child-resistant closures and label adhesion strength for safe delivery. Supply chain optimization and container design optimization are crucial for reducing lead times and improving packaging line efficiency. High-viscosity packaging solutions require specialized equipment and materials, such as UV resistance coatings and aerosol packaging technology. Industrial lubricant packaging necessitates tamper-evident features and leakage detection methods.
Bulk packaging solutions and cartridge packaging design cater to large-scale operations. Packaging material selection, additive compatibility testing, and seal integrity assessment are essential for ensuring product safety and performance. The market is expected to grow by over 5% annually, fueled by the increasing demand for efficient and sustainable packaging solutions. For instance, a leading lubricant manufacturer reported a 15% increase in sales due to the implementation of custom packaging solutions tailored to specific customer needs.
How is this Lubricant Packaging Industry segmented?
The lubricant packaging industry research report provides comprehensive data (region-wise segment analysis), with forecasts and estimates in "USD million" for the period 2024-2028, as well as historical data from 2018-2022 for the following segments.
- End-user
- Automotive
- Metalworking
- Oil and gas
- Others
- Geography
- North America
- US
- Canada
- Europe
- UK
- APAC
- China
- India
- Rest of World (ROW)
- North America
By End-user Insights
The automotive segment is estimated to witness significant growth during the forecast period.
In the market, advancements in technology have led to the adoption of moisture and oxygen barrier films, ensuring product efficacy and longevity. Automated filling systems streamline production processes, enhancing efficiency and reducing human error. Sustainable packaging materials, such as biodegradable plastics and recycled paper, are gaining popularity due to growing environmental concerns. E-commerce packaging requires child-resistant closures and tamper-evident features for safety. Label adhesion strength is crucial for maintaining product integrity during transportation and storage. Supply chain optimization is essential for minimizing costs and ensuring timely delivery. High-viscosity lubricants necessitate container design optimization for ease of dispensing. Flexible packaging options, including pouches and bags, offer advantages in terms of cost, space efficiency, and environmental impact.
UV resistance coatings protect against degradation from sunlight, while aerosol packaging technology offers convenience and portability. Industrial lubricant packaging demands rigorous testing for barrier properties, additive compatibility, and seal integrity. Recycling rates optimization and bulk packaging solutions reduce waste and minimize costs. The automotive lubricant packaging sector is expected to grow by 5% annually due to increasing vehicle production and sales. Packaging material selection, leakage detection methods, and packaging line efficiency are critical considerations for manufacturers. Corrosion prevention methods, such as UV resistance coatings and nitrogen flushing, are essential for protecting lubricants from environmental hazards. Hazardous material packaging requires specialized design and handling procedures.
Custom packaging solutions cater to specific customer needs and preferences. In conclusion, the market is dynamic, with a focus on innovation, sustainability, and efficiency.
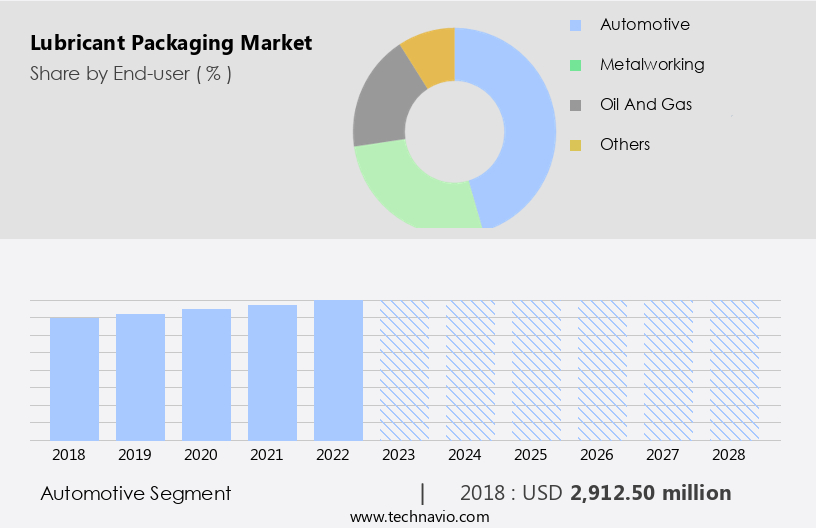
The Automotive segment was valued at USD 2.91 billion in 2018 and showed a gradual increase during the forecast period.
Regional Analysis
APAC is estimated to contribute 49% to the growth of the global market during the forecast period. Technavio's analysts have elaborately explained the regional trends and drivers that shape the market during the forecast period.
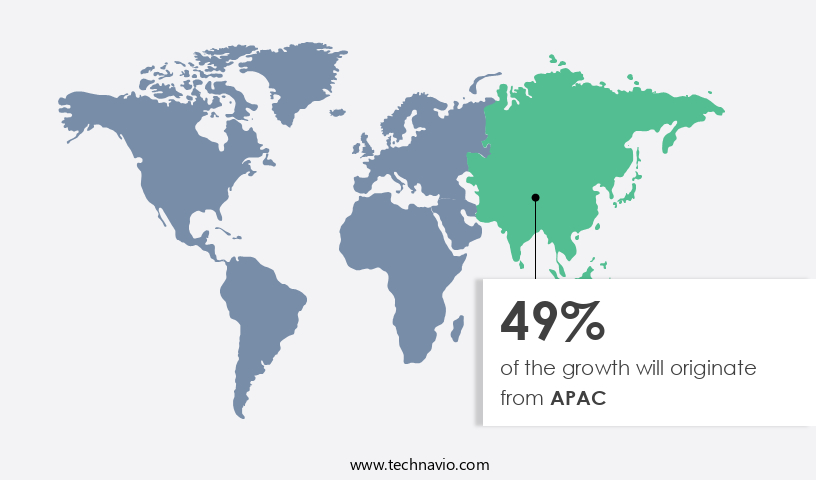
The lubricants market in the Asia Pacific (APAC) region is experiencing significant growth due to high consumption in sectors like automotive, construction, and refining. China, India, Japan, and Korea are key contributors to this demand. The market in APAC is diverse, with numerous regional and local suppliers, driven by industrialization and a growing corporate sector. The automotive industry's expansion, particularly in China, India, and Japan, is the primary driver of lubricant consumption. In 2020, passenger and commercial vehicle sales in APAC reached over 24 million units, leading to increased demand for lubricants. Moisture and oxygen barrier films, automated filling systems, sustainable packaging materials, e-commerce packaging, child-resistant closures, and tamper-evident packaging are essential for maintaining product quality and safety.
Container design optimization, flexible packaging options, and leakage detection methods ensure efficient production and reduced waste. The industry is expected to grow by over 5% annually, with a focus on high-viscosity packaging, UV resistance coatings, aerosol technology, and recycling rates optimization. Custom packaging solutions, additive compatibility testing, seal integrity assessment, and packaging line efficiency are also crucial for meeting industry standards. Bulk packaging solutions, automotive lubricant packaging, and hazardous material packaging are other market trends. Corrosion prevention methods and cartridge packaging design are essential considerations for lubricant packaging, ensuring product longevity and safety.
Market Dynamics
Our researchers analyzed the data with 2023 as the base year, along with the key drivers, trends, and challenges. A holistic analysis of drivers will help companies refine their marketing strategies to gain a competitive advantage.
The market is a critical sector in the global industrial landscape, with high-performance materials playing a pivotal role in optimizing the transportation and protection of lubricants. The design of lubricant packaging is essential in maintaining the shelf life of these valuable products, as it shields them from external factors that may degrade their quality. Sustainability is a significant consideration in today's lubricant packaging solutions for industry, with eco-friendly materials and reduced waste being key priorities. Evaluating the effectiveness of lubricant packaging seals is a crucial aspect of ensuring product integrity during transportation and storage. Comparing various lubricant packaging technologies, such as steel drums, plastic containers, and flexible bags, involves a cost-benefit analysis that considers factors like material costs, production efficiency, and environmental impact. Improving the environmental profile of lubricant packaging is a significant trend in the industry, with innovative solutions focusing on sustainable material choices and automated processes for production. Designing tamper-evident packaging for security and regulatory compliance is also essential, as is reducing waste and enhancing safety features. Testing methods for lubricant packaging integrity are vital in ensuring product quality and consumer satisfaction. Selecting appropriate packaging materials for lubricants, such as high-density polyethylene or polyethylene terephthalate, is crucial in maintaining the chemical properties of the lubricant. Latest advancements in lubricant packaging technology include the use of biodegradable materials, smart packaging solutions, and innovative designs for e-commerce applications. Consumer perception of different lubricant packaging designs plays a significant role in market success, making design aesthetics and functionality essential considerations.
What are the key market drivers leading to the rise in the adoption of Lubricant Packaging Industry?
- The expansion of the automotive industry significantly contributes to the market's growth, serving as its primary driver.
- The market experiences significant growth due to the expanding automotive industry and increasing demand for commercial vehicles. With the rise in vehicle sales, the need for lubricants has escalated, subsequently boosting the market. The commercial vehicle sector, particularly small, medium, and heavy vehicles, has gained traction for logistics and transport services related to e-commerce. The logistics industry's shift towards customer-centric solutions has led to an uptick in demand for utility vehicles. Furthermore, the industrial sector's expansion in emerging markets and the growth of logistics businesses fuel the demand for commercial vehicles, thereby propelling the market.
- For instance, the logistics sector's market size is projected to reach USD 5.5 trillion by 2023, signifying a substantial increase from its 2018 value. This growth trajectory underscores the potential for market expansion.
What are the market trends shaping the Lubricant Packaging Industry?
- The demand for environmentally friendly packaging is becoming increasingly mandatory in the current market trend. A growing number of consumers prioritize sustainable packaging solutions over traditional options.
- The market is witnessing a significant shift towards sustainable packaging solutions due to increasing environmental consciousness and regulatory pressures. According to recent studies, the adoption of sustainable lubricant packaging is projected to surge by 25% in the next five years. This growth is driven by several factors, including the global push towards a circular economy and consumers' increasing preference for eco-friendly products. One way the industry is responding to this trend is by reducing the amount of raw materials used in packaging. For instance, lighter-weight steel drums have gained popularity due to their lower environmental impact.
- Additionally, the use of recycled plastics in lubricant packaging is becoming more common, further reducing the demand for virgin materials. These sustainable packaging initiatives are not only beneficial for the environment but also for businesses. By adopting sustainable practices, companies can differentiate themselves from competitors and appeal to eco-conscious consumers. Furthermore, implementing sustainable packaging solutions can help reduce costs in the long run by optimizing resources and minimizing waste. In conclusion, the market is experiencing a robust growth in sustainable packaging solutions, driven by regulatory pressures and consumer preferences. The market is expected to continue this trend in the coming years, with a projected increase of 20% in sustainable packaging adoption.
What challenges does the Lubricant Packaging Industry face during its growth?
- The volatile pricing of raw materials poses a significant challenge to the industry's growth trajectory.
- The market is influenced by the volatility of raw material prices, particularly polyethylene terephthalate and high-density polyethylene, which are essential for manufacturing bottles. The availability and cost of these raw materials significantly impact their prices, ultimately affecting the lubricant industry's supply and manufacturers' profit margins. According to industry reports, raw materials account for over 50% of the total cost of lubricant packaging. To mitigate the increased costs, container manufacturers may raise the prices of their end products. For instance, a 20% increase in the price of a raw material could lead to a corresponding price hike for the final product.
- Despite these challenges, the global lubricants market is expected to grow by over 4% annually, driven by increasing demand for lubricants in various industries.
Exclusive Customer Landscape
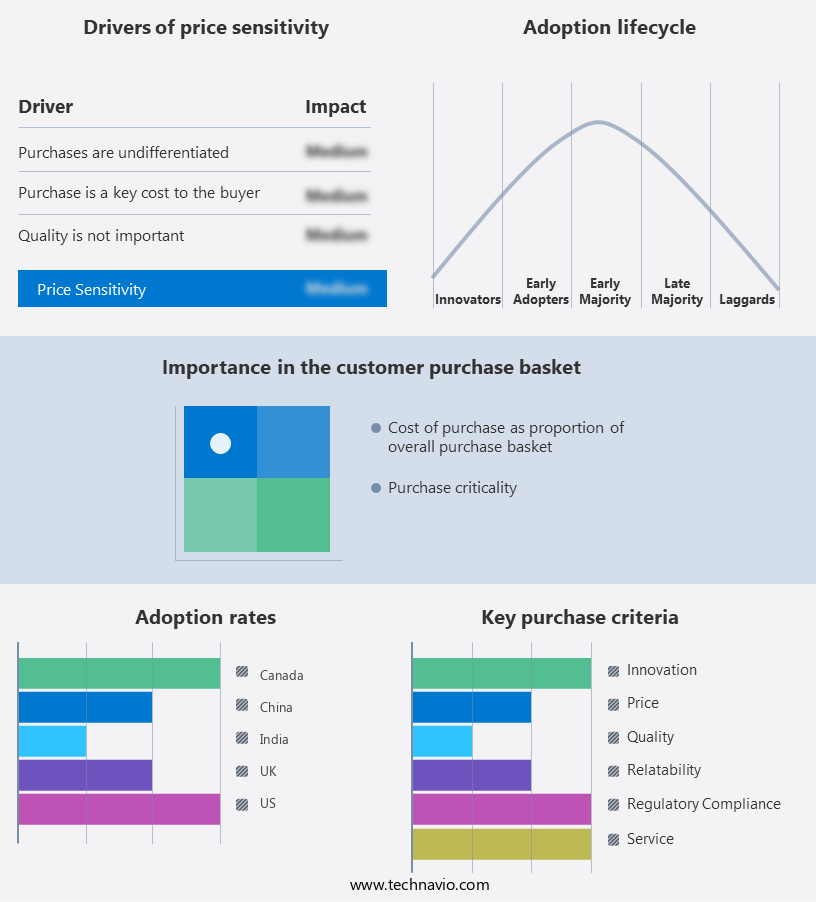
The lubricant packaging market forecasting report includes the adoption lifecycle of the market, covering from the innovator's stage to the laggard's stage. It focuses on adoption rates in different regions based on penetration. Furthermore, the lubricant packaging market report also includes key purchase criteria and drivers of price sensitivity to help companies evaluate and develop their market growth analysis strategies.
Customer Landscape
Key Companies & Market Insights
Companies are implementing various strategies, such as strategic alliances, lubricant packaging market forecast, partnerships, mergers and acquisitions, geographical expansion, and product/service launches, to enhance their presence in the industry.
Amcor Plc - The company specializes in innovative lubricant packaging solutions, including Spouted Stand Up pouches, which enhance product convenience and efficiency for various industries.
The industry research and growth report includes detailed analyses of the competitive landscape of the market and information about key companies, including:
- Amcor Plc
- BAM Packaging Consulting GmbH
- Berry Global Inc.
- BWAY Corp.
- CDF Corp.
- CYL Corp. Berhad
- FUCHS PETROLUB SE
- Glenroy Inc.
- Graham Packaging Co. LP
- Greif Inc.
- Mold Tek Packaging Ltd.
- Nipa Industry
- Shell plc
- SIG Group AG
- Smurfit Kappa Group
- Sonoco Products Co.
- Takween Advanced Industries
- Time Technoplast Ltd
- Valvoline Inc.
- ZAMIL PLASTIC Corp.
Qualitative and quantitative analysis of companies has been conducted to help clients understand the wider business environment as well as the strengths and weaknesses of key industry players. Data is qualitatively analyzed to categorize companies as pure play, category-focused, industry-focused, and diversified; it is quantitatively analyzed to categorize companies as dominant, leading, strong, tentative, and weak.
Recent Development and News in Lubricant Packaging Market
- In January 2024, BASF Corporation, a leading chemical producer, announced the launch of its new line of sustainable lubricant packaging solutions, made from renewable raw materials, at the Lubricants World Expo. This innovation aimed to reduce the environmental footprint of lubricant packaging (BASF press release, 2024).
- In March 2024, Dow Inc. and LyondellBasell Industries N.V. Joined forces to create a strategic partnership for the development and production of advanced lubricant packaging solutions. The collaboration was expected to boost both companies' market presence and expand their product offerings (Dow Inc. Press release, 2024).
- In May 2024, ExxonMobil Chemical Company unveiled its new state-of-the-art lubricant packaging manufacturing facility in Singapore. The USD 500 million investment was aimed at increasing production capacity and enhancing the company's global competitiveness (ExxonMobil press release, 2024).
- In April 2025, the European Union (EU) passed a new regulation mandating the use of recyclable or biodegradable lubricant packaging materials by 2030. This initiative aimed to reduce plastic waste and promote sustainability within the lubricant industry (European Parliament press release, 2025).
Research Analyst Overview
- The market for lubricant packaging continues to evolve, with ongoing activities shaping its dynamics across various sectors. Material sourcing strategies and end-of-life solutions are increasingly important, as companies seek to minimize costs and reduce environmental impact. Packaging cost analysis, regulatory compliance testing, and product traceability systems are essential components of this process. Consumer preference research plays a significant role in determining the design for manufacturability and label durability of lubricant packaging. Distribution logistics impact, performance testing protocols, and quality control procedures are crucial for ensuring seal integrity and durability assessment. Filling equipment maintenance, environmental impact assessment, and biodegradable packaging options are also gaining traction.
- According to a recent industry report, The market is expected to grow by 5% annually over the next five years. For instance, a leading lubricant manufacturer reported a 7% increase in sales due to the implementation of packaging line optimization and leakage rate quantification techniques. The market also focuses on closure system reliability, strength testing methods, and packaging process automation to enhance efficiency and reduce costs. Packaging weight reduction, recycling program effectiveness, material compatibility studies, and packaging waste management are key areas of ongoing research and development. The industry is also exploring the use of biodegradable packaging options, label durability testing, and design for manufacturability to meet evolving consumer demands and regulatory requirements.
Dive into Technavio's robust research methodology, blending expert interviews, extensive data synthesis, and validated models for unparalleled Lubricant Packaging Market insights. See full methodology.
|
Market Scope |
|
|
Report Coverage |
Details |
|
Page number |
150 |
|
Base year |
2023 |
|
Historic period |
2018-2022 |
|
Forecast period |
2024-2028 |
|
Growth momentum & CAGR |
Accelerate at a CAGR of 3.82% |
|
Market growth 2024-2028 |
USD 2363.5 million |
|
Market structure |
Fragmented |
|
YoY growth 2023-2024(%) |
3.53 |
|
Key countries |
US, China, India, UK, and Canada |
|
Competitive landscape |
Leading Companies, Market Positioning of Companies, Competitive Strategies, and Industry Risks |
What are the Key Data Covered in this Lubricant Packaging Market Research and Growth Report?
- CAGR of the Lubricant Packaging industry during the forecast period
- Detailed information on factors that will drive the growth and forecasting between 2024 and 2028
- Precise estimation of the size of the market and its contribution of the industry in focus to the parent market
- Accurate predictions about upcoming growth and trends and changes in consumer behaviour
- Growth of the market across APAC, North America, Europe, South America, and Middle East and Africa
- Thorough analysis of the market's competitive landscape and detailed information about companies
- Comprehensive analysis of factors that will challenge the lubricant packaging market growth of industry companies
We can help! Our analysts can customize this lubricant packaging market research report to meet your requirements.
 RIA -
RIA - 
