
Magazine Publishing Market Size 2025-2029
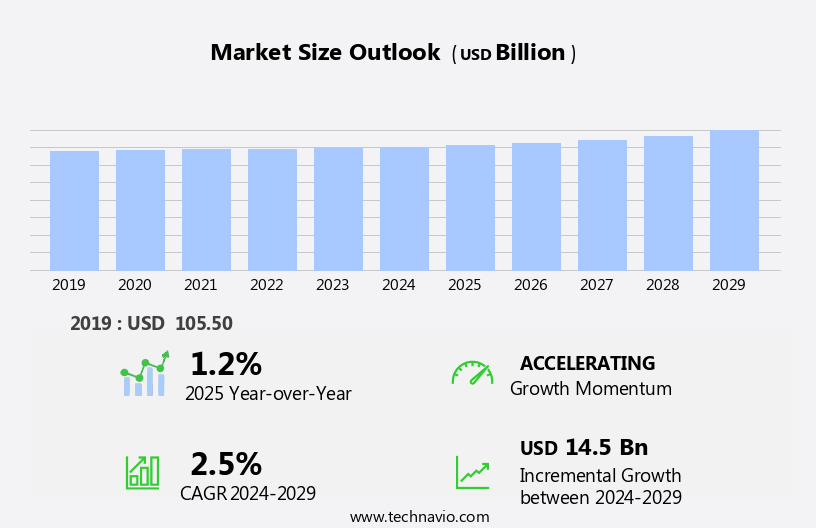
The magazine publishing market size is forecast to increase by USD 14.5 billion, at a CAGR of 2.5% between 2024 and 2029.
- The market is experiencing significant shifts in consumer behavior and competitive dynamics. The rise of mobile devices, particularly smartphones and tablets, is driving a shift in how consumers engage with magazine content. This trend is leading to an increase in digital subscriptions and a decline in print sales. Simultaneously, magazines are being recognized as effective focused advertising platforms, offering targeted reach and engagement opportunities for advertisers. However, this market is not without challenges. Increasing competition among magazine publishers is intensifying, with new entrants and established players vying for market share. To stay competitive, publishers must continually innovate and differentiate their offerings, whether through unique content, enhanced digital experiences, or strategic partnerships.
- Additionally, navigating the complexities of digital advertising and subscription models requires a deep understanding of consumer preferences and behavior, as well as the ability to adapt quickly to emerging technologies and trends. Companies seeking to capitalize on market opportunities and navigate challenges effectively must remain agile and focused on delivering value to their audiences and advertisers.
What will be the Size of the Magazine Publishing Market during the forecast period?
Explore in-depth regional segment analysis with market size data - historical 2019-2023 and forecasts 2025-2029 - in the full report.
Request Free Sample
In the dynamic and ever-evolving the market, various sectors continue to adapt and innovate to meet the demands of audiences and advertisers. The production process, from content creation to distribution, undergoes constant transformation. Content production costs are influenced by factors such as pay-per-click advertising, licensing agreements, and labor costs. Printing plates, paper stock, and print quality are essential considerations for lithographic and inkjet printing. User experience and e-commerce platforms are crucial for engaging audiences and maximizing subscription revenue. Data analytics plays a significant role in understanding readership metrics and audience segmentation, enabling effective circulation management and conversion optimization. Subscription fulfillment and reprint rights are essential components of the subscription model.
Multimedia content, including podcasts, video, and interactive elements, are increasingly popular. Augmented reality and virtual reality offer new opportunities for immersive experiences. Digital printing and distribution channels cater to the growing demand for on-demand content. Customer service, community building, and influencer marketing contribute to audience engagement. Social media marketing, email marketing, and content syndication expand reach. Brand awareness is enhanced through print and digital advertising, marketing costs, and search engine optimization. The design team's role in layout design, graphic design, and web design is pivotal in creating visually appealing and user-friendly content. Pre-press production, conversion optimization, and post-press finishing ensure high-quality output.
In this continuously evolving landscape, market dynamics unfold, shaping the future of magazine publishing.
How is this Magazine Publishing Industry segmented?
The magazine publishing industry research report provides comprehensive data (region-wise segment analysis), with forecasts and estimates in "USD billion" for the period 2025-2029, as well as historical data from 2019-2023 for the following segments.
- Type
- Digital
- Application
- Offline
- Online
- Geography
- North America
- US
- Canada
- Europe
- France
- Germany
- UK
- APAC
- Australia
- China
- India
- Japan
- South Korea
- Rest of World (ROW)
- North America
By Type Insights
The print segment is estimated to witness significant growth during the forecast period.
In the market, print segment faces a decline as publishers transition to digital platforms. This shift is driven by the emergence of innovative digital publishing startups and the convenience of instant access to content through mobile apps and e-commerce platforms. However, print magazines still maintain a presence, requiring robust distribution networks for timely delivery. The supply chain management in print magazine publishing can be complex and costly, leading to increased operational expenses. Digital publishing, on the other hand, offers cost savings through digital advertising, pay-per-click advertising, and subscription models. Content production costs are reduced with digital publishing, enabling publishers to focus on audience engagement, community building, and influencer marketing.
Design teams utilize various printing techniques, including lithographic, screen, and inkjet printing, to create visually appealing magazines. Data analytics and customer relationship management tools help publishers understand their readership and tailor content to specific audience segments. As the market evolves, publishers explore new formats such as augmented reality, interactive content, and podcasts to enhance user experience and boost engagement rates. Subscription fulfillment and conversion optimization are crucial elements of circulation management. Printing presses, paper stock, and print quality remain essential factors in maintaining brand awareness. Publishers also leverage social media marketing, content syndication, email marketing, and editorial calendars to expand their reach and target specific demographics.
The market is dynamic, with ongoing trends in color printing, virtual reality, and video content production. Publishers must continually adapt to these changes while managing printing costs, distribution costs, and circulation figures to maximize return on investment.
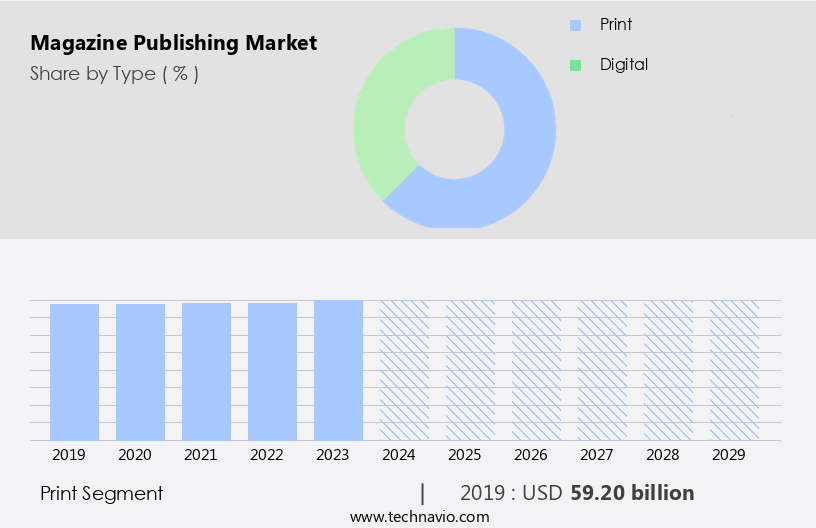
The Print segment was valued at USD 59.20 billion in 2019 and showed a gradual increase during the forecast period.
Regional Analysis
Europe is estimated to contribute 41% to the growth of the global market during the forecast period.Technavio’s analysts have elaborately explained the regional trends and drivers that shape the market during the forecast period.
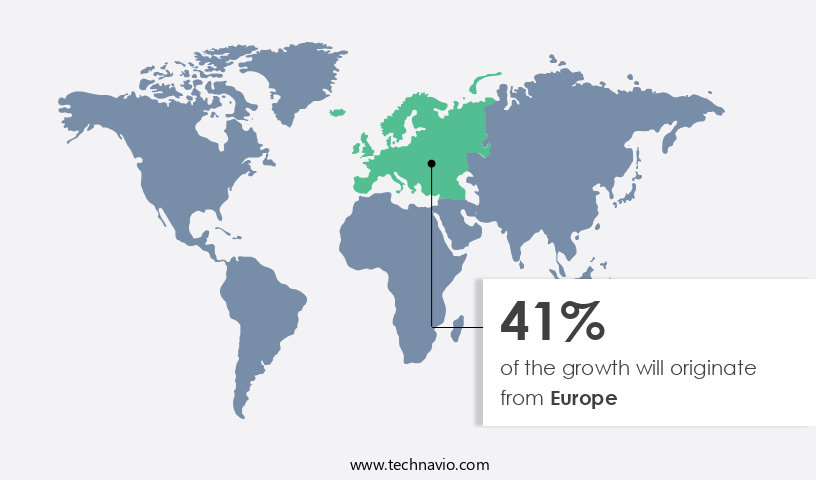
The market in Europe is experiencing growth as businesses recognize the value of this medium for marketing purposes. Traditional publishers are adapting to the digital age, expanding their reach and engaging readers more effectively through various channels. Lithographic and inkjet printing techniques ensure high-quality design and production, while customer service and circulation management optimize distribution. Readership analysis and audience engagement metrics provide insights for targeted marketing, including influencer collaborations and search engine optimization. Content creation and production costs are managed through a design team and content management systems, allowing for multimedia content, podcasts, and interactive elements.
Subscription models and e-commerce platforms facilitate user experience and revenue generation, with data analytics and digital asset management streamlining operations. Social media marketing and community building further enhance audience engagement and brand awareness. Offset and flexographic printing, along with binding methods, ensure the physical production of magazines, while distribution costs are minimized through various channels. The market's evolution reflects the importance of targeted marketing, user experience, and digital innovation in the publishing industry.
Market Dynamics
Our researchers analyzed the data with 2024 as the base year, along with the key drivers, trends, and challenges. A holistic analysis of drivers will help companies refine their marketing strategies to gain a competitive advantage.
What are the key market drivers leading to the rise in the adoption of Magazine Publishing Industry?
- The prevalent trend in consumer technology is driven primarily by the escalating usage of smartphones and tablets.
- The market experiences significant growth due to the increasing usage of digital devices for accessing content. High-speed Internet connectivity facilitates streaming and downloading activities, leading to a surge in demand for digital magazines. Mobile applications have become essential for publishers to engage audiences effectively, as smartphones and tablets are the preferred platforms for consuming digital content. Consequently, numerous enterprises are launching mobile applications, offering both digital and print versions of magazines. The design team focuses on optimizing paper stock, print quality, and user experience to create immersive and harmonious mobile-first experiences. Customer service, circulation management, and audience engagement are crucial elements in these applications, ensuring customer relationship management and high click-through rates.
- Influencer marketing and search engine optimization are employed to expand reach and readership analysis is conducted to understand customer preferences and tailor content accordingly. Lithographic printing and screen printing are used for producing high-quality printed magazines, while inkjet printing offers cost-effectiveness and flexibility. Distribution channels are optimized to ensure seamless delivery of digital and print content.
What are the market trends shaping the Magazine Publishing Industry?
- The adoption of magazines as a focused advertising platform is an emerging market trend. This traditional medium continues to offer unique benefits for brands seeking targeted reach and engagement with their audience.
- Magazines, as content-specific publications, cater to various industries and audiences worldwide. Advertisers can leverage this targeted reach by aligning their promotions with the magazine's focus genre. For instance, a food magazine attracts readers interested in recipes and restaurants, making it an ideal platform for related advertisements. This targeted approach ensures higher relevance and potential conversion rates for advertisers. Moreover, magazines offer advertisers the flexibility to choose between print and digital formats, enabling them to reach a broader audience. Printing plates and printing presses are essential for traditional magazine publishing, while e-commerce platforms and data analytics tools facilitate digital advertising.
- Labor costs, content production, and licensing agreements are significant factors influencing magazine publishing. User experience, website traffic, and audience segmentation are essential considerations for advertisers to maximize their return on investment. Multimedia content, including augmented reality and interactive features, enhances the user experience and attracts a more engaged audience. Direct mail and pay-per-click advertising are additional revenue streams for magazines. Gravure printing and content creation are essential components of magazine publishing, ensuring high-quality visuals and informative articles. Advertisers can also benefit from the data analytics provided by magazines to better understand their target demographics and optimize their campaigns.
- In conclusion, magazines offer advertisers a targeted and effective platform to reach their desired audience, with various formats, content types, and advertising options available.
What challenges does the Magazine Publishing Industry face during its growth?
- The magazine publishing industry faces significant growth challenges due to intensifying competition amongst its participants.
- The market faces challenges from intensifying competition and declining profit margins. Major players in the industry grapple with price wars due to an increase in local publishers offering magazine content. This competition can lead to a decrease in quality and potentially hinder market growth. Furthermore, regions such as MEA and South America exhibit a low penetration of both global and local publishers, presenting opportunities for expansion. In the digital realm, magazine publishers must navigate the complexities of digital printing, reprint rights, and pre-press production, while optimizing conversion rates for digital advertising. Graphic design, web design, content syndication, email marketing, and social media engagement are essential strategies for enhancing engagement rates and return on investment.
- Ink costs and distribution costs remain significant expenses for publishers, while flexographic printing and podcast content offer potential cost savings and new revenue streams. Magazine publishers must adapt to these market dynamics to remain competitive and thrive in the evolving media landscape.
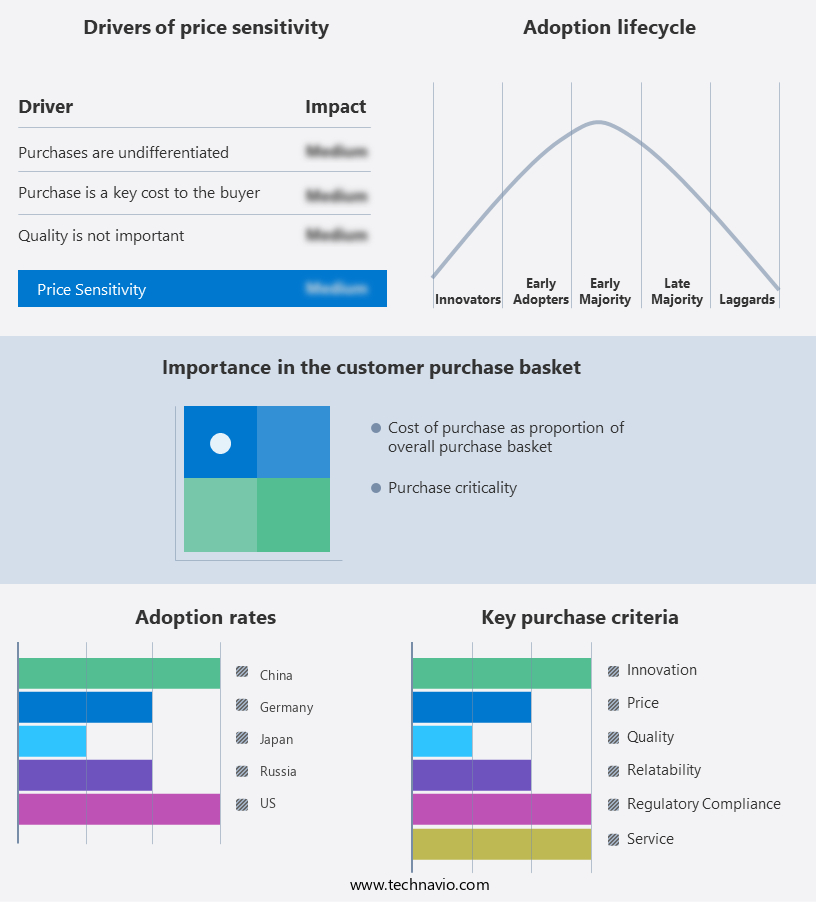
Exclusive Customer Landscape
The magazine publishing market forecasting report includes the adoption lifecycle of the market, covering from the innovator’s stage to the laggard’s stage. It focuses on adoption rates in different regions based on penetration. Furthermore, the magazine publishing market report also includes key purchase criteria and drivers of price sensitivity to help companies evaluate and develop their market growth analysis strategies.
Customer Landscape
Key Companies & Market Insights
Companies are implementing various strategies, such as strategic alliances, magazine publishing market forecast, partnerships, mergers and acquisitions, geographical expansion, and product/service launches, to enhance their presence in the industry.
Bertelsmann SE and Co. KGaA - Gruner Jahr, a renowned magazine publishing entity, delivers a diverse array of high-quality publications spanning genres such as lifestyle, health, and business. These magazines cater to audiences globally, expanding reach and influence. Our offerings reflect a commitment to original content, captivating storytelling, and in-depth analysis. Each publication is meticulously crafted to engage and inform readers, fostering a deep connection and fostering a loyal following.
The industry research and growth report includes detailed analyses of the competitive landscape of the market and information about key companies, including:
- Bertelsmann SE and Co. KGaA
- Bloomberg LP
- British Broadcasting Corp.
- Cairo Communication Spa
- CJK Group Inc.
- Dazed Media
- Forbes Media LLC
- Gakken Holdings Co. Ltd.
- Gannett Co. Inc.
- Guardian Media Group plc
- Hearst Communications Inc.
- Heinrich Bauer Verlag KG
- HT Media Ltd.
- InterActiveCorp
- Kadokawa Corp.
- Nine Entertainment Co. Holdings Ltd.
- Paramount Global
- Paste Media Group
- The New York Times Co.
- The Walt Disney Co.
Qualitative and quantitative analysis of companies has been conducted to help clients understand the wider business environment as well as the strengths and weaknesses of key industry players. Data is qualitatively analyzed to categorize companies as pure play, category-focused, industry-focused, and diversified; it is quantitatively analyzed to categorize companies as dominant, leading, strong, tentative, and weak.
Recent Development and News in Magazine Publishing Market
- In February 2023, Condé Nast announced the launch of its new digital-only magazine, "Condé Nast Traveler Select," focusing on luxury travel experiences. This marks a strategic shift towards digital-only publications for the renowned publishing house (Condé Nast Press Release).
- In April 2024, Hearst Magazines entered into a major partnership with Google, allowing for the integration of Google's voice technology into Hearst's magazines. This collaboration aims to enhance user experience and increase engagement through voice commands and personalized content recommendations (Google Press Release).
- In July 2024, Meredith Corporation completed the acquisition of Time Inc., significantly expanding its portfolio and increasing its market share in the magazine publishing industry. This merger creates a leading media company with a diverse range of print and digital brands (Meredith Corporation Press Release).
- In October 2025, BBC Worldwide announced the launch of a new digital subscription platform, BBC Magazine+, offering ad-free access to its entire archive of magazine content. This technological advancement enables readers to access a vast collection of articles, past issues, and multimedia content on demand (BBC Worldwide Press Release).
Research Analyst Overview
- In the dynamic the market, subscription management and customer feedback play crucial roles in shaping marketing strategies. Brands strive to enhance user interface design and editorial style to captivate audiences, while circulation data informs industry trends. Cover design, image licensing, and digital publishing platforms are essential for content monetization. Advertising rates and printing technology influence revenue streams, while circulation data and audience insights inform content distribution strategies.
- Mobile optimization and digital transformation are key to reaching wider demographics. Interactive features, event marketing, public relations, brand partnerships, and content strategy strengthen brand identity. Social media presence and audience demographics shape magazine layout and editorial direction. Magazine publishers continually adapt to these market shifts to remain competitive.
Dive into Technavio’s robust research methodology, blending expert interviews, extensive data synthesis, and validated models for unparalleled Magazine Publishing Market insights. See full methodology.
|
Market Scope |
|
|
Report Coverage |
Details |
|
Page number |
193 |
|
Base year |
2024 |
|
Historic period |
2019-2023 |
|
Forecast period |
2025-2029 |
|
Growth momentum & CAGR |
Accelerate at a CAGR of 2.5% |
|
Market growth 2025-2029 |
USD 14.5 billion |
|
Market structure |
Fragmented |
|
YoY growth 2024-2025(%) |
1.2 |
|
Key countries |
US, Germany, China, Japan, UK, India, Canada, France, South Korea, and Australia |
|
Competitive landscape |
Leading Companies, Market Positioning of Companies, Competitive Strategies, and Industry Risks |
What are the Key Data Covered in this Magazine Publishing Market Research and Growth Report?
- CAGR of the Magazine Publishing industry during the forecast period
- Detailed information on factors that will drive the growth and forecasting between 2025 and 2029
- Precise estimation of the size of the market and its contribution of the industry in focus to the parent market
- Accurate predictions about upcoming growth and trends and changes in consumer behaviour
- Growth of the market across Europe, APAC, North America, Middle East and Africa, and South America
- Thorough analysis of the market’s competitive landscape and detailed information about companies
- Comprehensive analysis of factors that will challenge the magazine publishing market growth of industry companies
We can help! Our analysts can customize this magazine publishing market research report to meet your requirements.
 RIA -
RIA - 
