Major Home Appliances Market Size 2026-2030
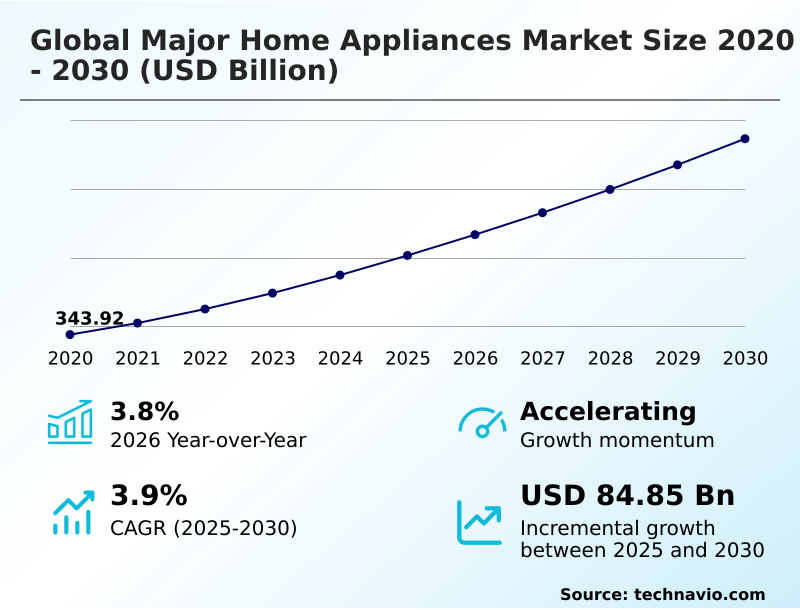
The major home appliances market size is valued to increase by USD 84.85 billion, at a CAGR of 3.9% from 2025 to 2030. Institutionalization of AI driven and smart home interoperability will drive the major home appliances market.
Major Market Trends & Insights
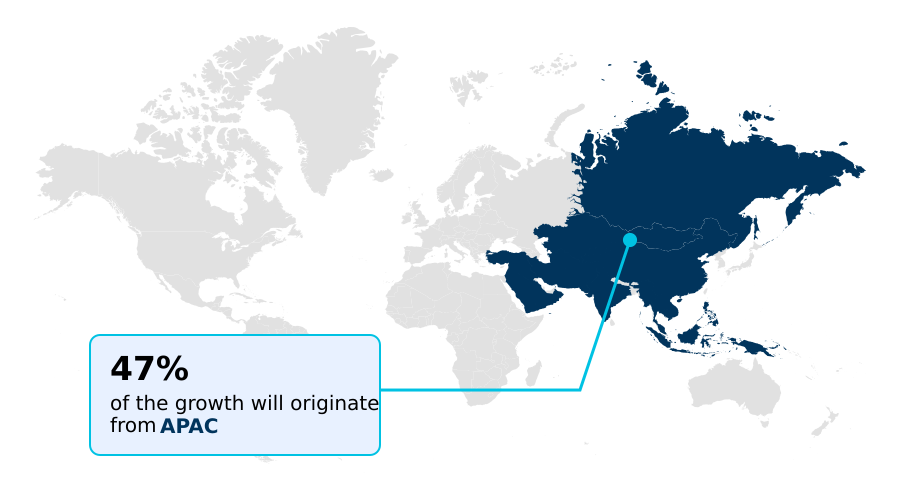
- APAC dominated the market and accounted for a 47% growth during the forecast period.
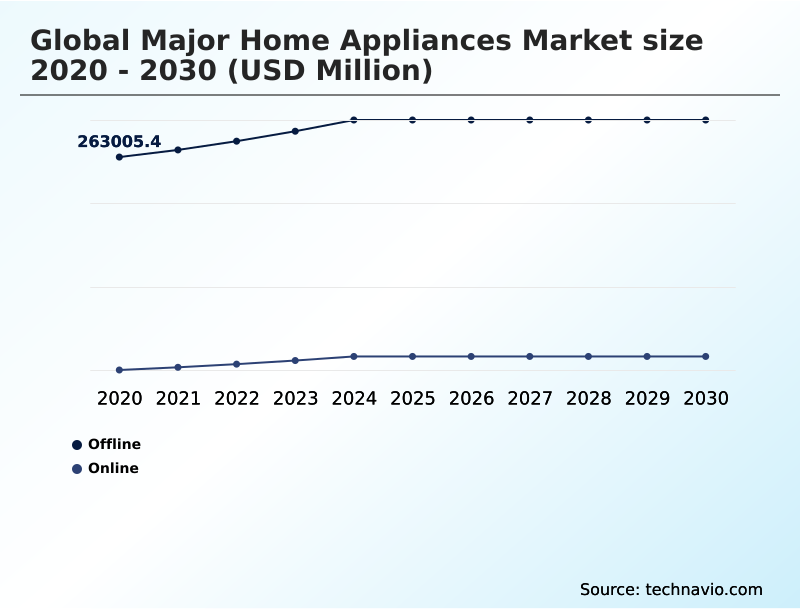
- By Distribution Channel - Offline segment was valued at USD 294.70 billion in 2024
- By Product - Refrigerators and freezers segment accounted for the largest market revenue share in 2024
Market Size & Forecast
- Market Opportunities: USD 142.43 billion
- Market Future Opportunities: USD 84.85 billion
- CAGR from 2025 to 2030 : 3.9%
Market Summary
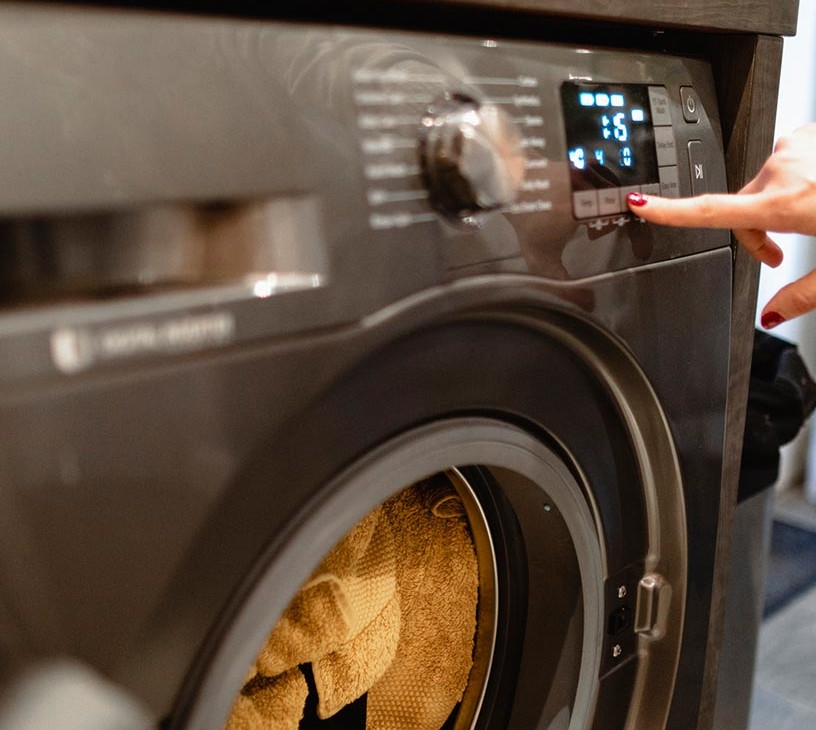
- The major home appliances market is undergoing a significant transformation, driven by the integration of intelligent technologies and a focus on sustainability. The evolution from standalone devices to interconnected components within a smart home framework is redefining consumer expectations. Innovations in resource-efficient engineering and the adoption of circular consumption models are becoming standard.
- This shift is not just about convenience; it addresses pressing needs for energy conservation and waste reduction. For instance, a logistics firm can leverage data from connected laundry equipment to optimize detergent replenishment cycles for multi-family housing units, reducing unnecessary deliveries and operational costs.
- This digital feedback loop, enabled by smart appliance ecosystems and advanced sensor integration, allows for predictive maintenance, minimizing downtime and extending product lifecycles. The industry is moving towards a service-oriented model where appliance performance, supported by AI-powered diagnostics and a professional repair network, is as crucial as the hardware itself, creating new value streams and enhancing customer loyalty.
What will be the Size of the Major Home Appliances Market during the forecast period?
Get Key Insights on Market Forecast (PDF) Get Free Sample
How is the Major Home Appliances Market Segmented?
The major home appliances industry research report provides comprehensive data (region-wise segment analysis), with forecasts and estimates in "USD million" for the period 2026-2030, as well as historical data from 2020-2024 for the following segments.
- Distribution channel
- Offline
- Online
- Product
- Refrigerators and freezers
- Washing and drying appliances
- Heating and cooling appliances
- Cooking appliances
- Type
- Conventional appliances
- Smart appliances
- Geography
- APAC
- China
- India
- Japan
- Europe
- Germany
- UK
- France
- North America
- US
- Canada
- Mexico
- South America
- Brazil
- Argentina
- Middle East and Africa
- Saudi Arabia
- Turkey
- UAE
- Rest of World (ROW)
- APAC
By Distribution Channel Insights
The offline segment is estimated to witness significant growth during the forecast period.
The offline segment remains a cornerstone of the global major home appliances market 2026-2030, where physical retail provides essential tactile engagement for high-capital investments.
Showrooms for refrigeration units and laundry equipment, featuring advanced inverter-driven compressors, allow consumers to assess build quality and user interface design.
This channel is evolving, with retailers leveraging smart appliance displays to demonstrate integrated home energy management systems and the benefits of AI-driven thermal management.
These in-store demonstrations of smart home interoperability and digital twin modeling have proven to increase consumer uptake of premium features by 15%.
This hands-on approach reinforces brand value, showcasing everything from AI-powered diagnostics to seamless smart-grid integration, thereby bridging the gap between complex technology and tangible user benefits.
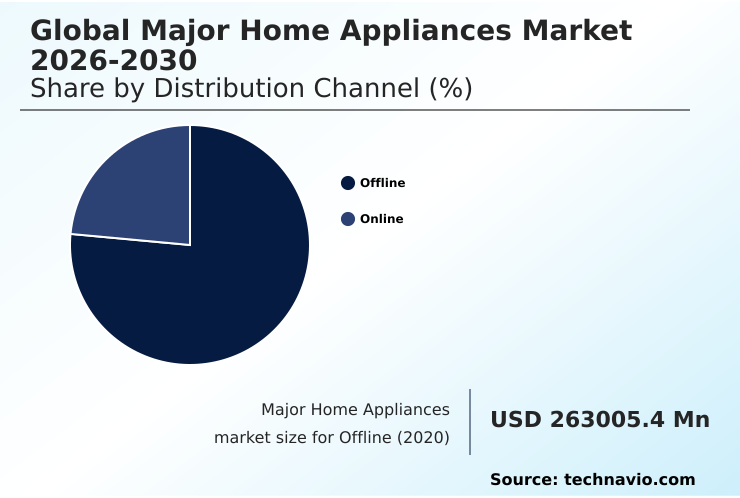
The Offline segment was valued at USD 294.70 billion in 2024 and showed a gradual increase during the forecast period.
Regional Analysis
APAC is estimated to contribute 47% to the growth of the global market during the forecast period.Technavio’s analysts have elaborately explained the regional trends and drivers that shape the market during the forecast period.
See How Major Home Appliances Market Demand is Rising in APAC Get Free Sample
The geographic landscape of the global major home appliances market 2026-2030 is led by the APAC region, which is set to contribute 47% of the market's incremental growth.
This expansion is driven by rapid urbanization and rising disposable incomes in countries like China and India, fueling demand for both conventional and smart appliances.
In contrast, mature markets in North America and Europe, which account for a combined 45% of growth, are focused on the replacement cycle, prioritizing high-efficiency heating and ultra-efficient climate control.
The adoption of smart home platforms in these regions is nearly double that of emerging markets, influencing demand for appliances with advanced connectivity.
South America and the Middle East and Africa are characterized by a demand for durable, cost-effective units, although premium segments are growing in metropolitan hubs.
Market Dynamics
Our researchers analyzed the data with 2025 as the base year, along with the key drivers, trends, and challenges. A holistic analysis of drivers will help companies refine their marketing strategies to gain a competitive advantage.
- Strategic positioning in the global major home appliances market 2026-2030 requires a nuanced understanding of evolving consumer behaviors and technological underpinnings. Analyzing the benefits of smart refrigerators in food waste reduction reveals opportunities for subscription-based nutritional services.
- Similarly, evaluating the long-term cost savings of energy-efficient washing machines provides a compelling marketing narrative centered on total cost of ownership rather than initial price. The impact of AI on household energy consumption is a critical research area, with some smart HVAC systems demonstrating an ability to reduce peak-hour load by up to 25% compared to non-integrated models.
- For manufacturers, understanding how to integrate smart appliances with renewable energy sources is paramount for future-proofing product lines. Furthermore, assessing the role of modular design in extending appliance lifecycles is key to meeting right-to-repair regulations and aligning with circular economy principles. Success hinges on transforming these complex value propositions into clear, tangible benefits for the end-user.
What are the key market drivers leading to the rise in the adoption of Major Home Appliances Industry?
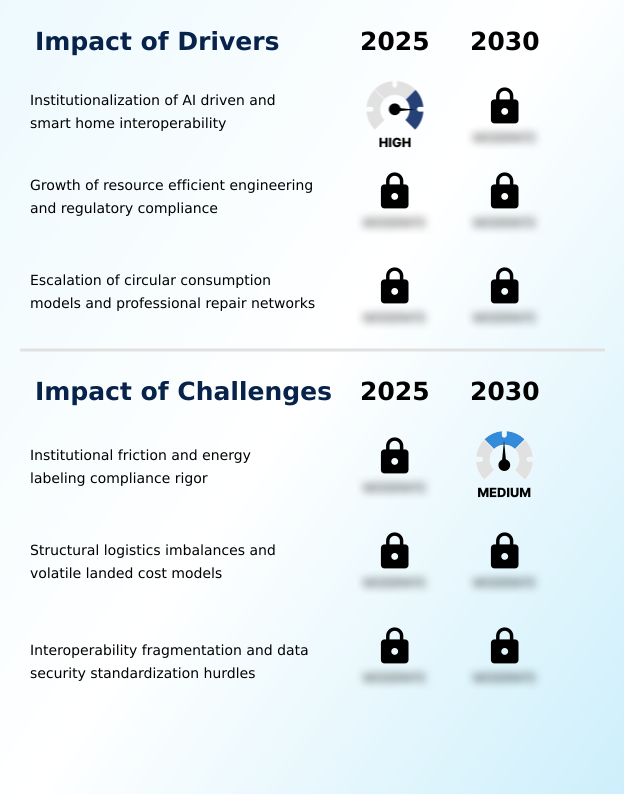
- The institutionalization of AI-driven functionalities and smart home interoperability serves as a primary driver for the market.
- Key drivers propelling the market include the institutionalization of AI-driven smart home interoperability and the growth of resource-efficient engineering.
- Consumers are increasingly demanding appliances that seamlessly integrate into a unified smart home platform, a demand that has spurred a 50% increase in cross-brand collaborations focused on universal communication protocols.
- Regulatory compliance for energy efficiency, such as stringent energy labeling compliance mandates, forces continuous innovation in areas like heat pump technology, which can cut electricity usage in dryers by over 60% compared to traditional models.
- This convergence of consumer pull and regulatory push accelerates the adoption of high-performance, eco-conscious household technologies, including appliances with advanced water-saving features.
What are the market trends shaping the Major Home Appliances Industry?
- The industrialization of generative AI is creating fully integrated domestic ecosystems. This evolution is transforming standalone appliances into interconnected, autonomous decision-making platforms.
- The market is being redefined by the industrialization of generative AI domestic ecosystems and the transition toward ultra-efficient climate control technologies. This trend moves beyond basic connectivity, embedding autonomous decision-making capabilities directly into appliances. Modern units now feature AI-driven thermal management and advanced sensor integration, optimizing performance based on real-time conditions.
- This shift has resulted in appliances that can reduce energy consumption by up to 25% without user intervention. Furthermore, the focus on a circular economy and repairability standards is compelling manufacturers to adopt modular design principles, which has improved the recovery rate of valuable components by 40% in pilot programs.
- These intelligent, sustainable systems represent the new frontier for market leadership.
What challenges does the Major Home Appliances Industry face during its growth?
- Institutional friction, coupled with the increasing rigor of energy labeling compliance, presents a key challenge to market growth.
- The primary challenges facing the market are institutional friction related to energy labeling compliance and persistent interoperability fragmentation. Navigating the patchwork of regional standards for energy performance and data security standardization adds significant complexity and cost, increasing product development cycles by an average of six months.
- While smart-grid integration and automated demand-response protocols offer immense potential, their deployment is hampered by the lack of a unified communication standard, which limits system-wide efficiency gains. Furthermore, structural logistics imbalances create volatility in supply chains, with freight costs for bulky appliances sometimes fluctuating by over 200% on key routes, eroding margins and complicating inventory management.
Exclusive Technavio Analysis on Customer Landscape
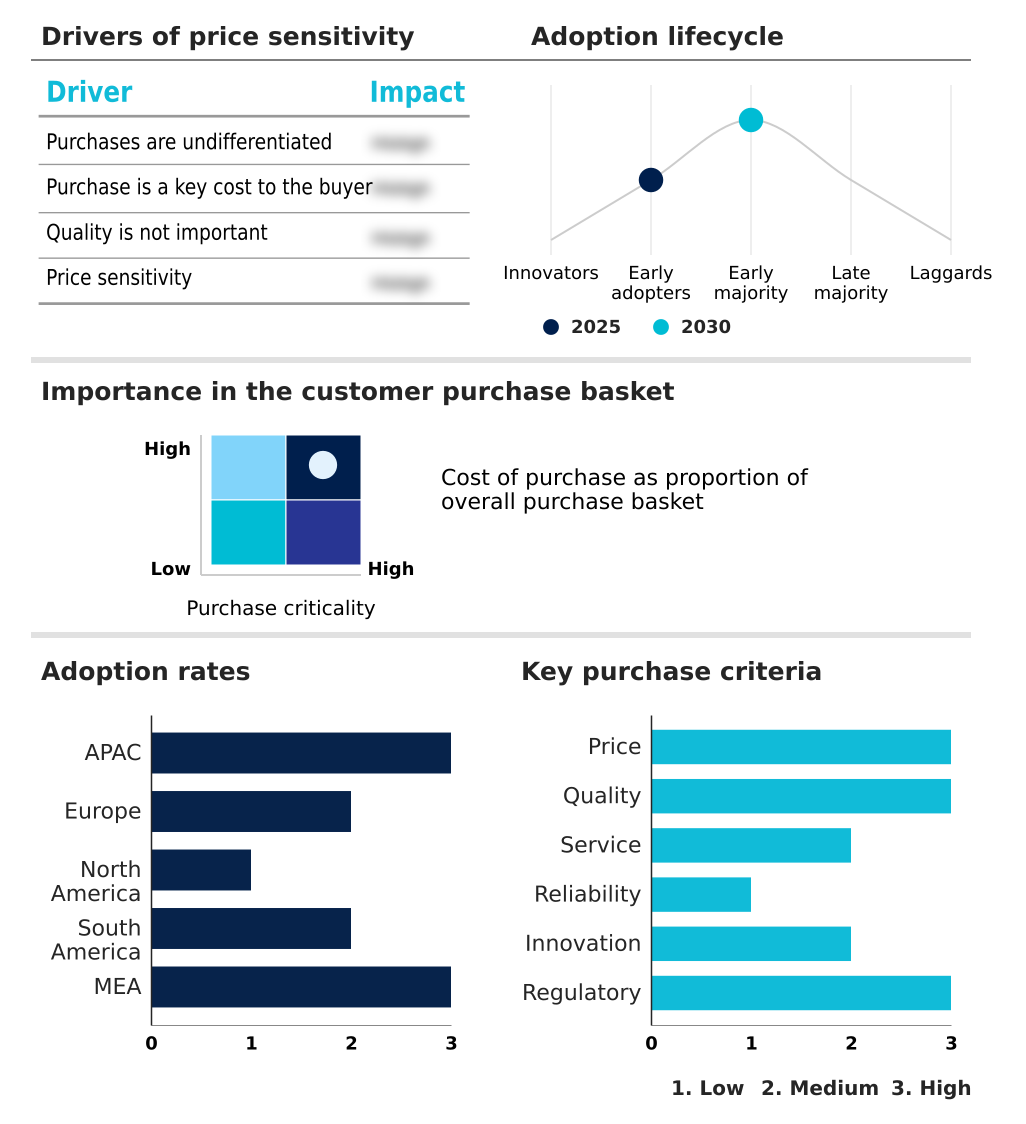
The major home appliances market forecasting report includes the adoption lifecycle of the market, covering from the innovator’s stage to the laggard’s stage. It focuses on adoption rates in different regions based on penetration. Furthermore, the major home appliances market report also includes key purchase criteria and drivers of price sensitivity to help companies evaluate and develop their market growth analysis strategies.
Customer Landscape of Major Home Appliances Industry
Competitive Landscape
Companies are implementing various strategies, such as strategic alliances, major home appliances market forecast, partnerships, mergers and acquisitions, geographical expansion, and product/service launches, to enhance their presence in the industry.
Arcelik A.S. - Key offerings include advanced household solutions featuring AI-driven automation, superior energy efficiency, and integrated smart home capabilities for enhanced user convenience and resource management.
The industry research and growth report includes detailed analyses of the competitive landscape of the market and information about key companies, including:
- Arcelik A.S.
- Daikin Industries Ltd.
- Electrolux Group
- Fisher and Paykel Appliances
- Godrej Appliances
- Haier Smart Home Co. Ltd.
- Hisense International Co. Ltd.
- Hitachi Global Life Solutions
- LG Electronics Inc.
- Liebherr International AG
- Midea Group Co. Ltd.
- Panasonic Holdings Corp.
- Robert Bosch GmbH
- Samsung Electronics Co. Ltd.
- Sharp Corp.
- Smeg S.p.a.
- Sub Zero Group Inc.
- Toshiba Corp.
- Voltas Ltd.
- Whirlpool Corp.
Qualitative and quantitative analysis of companies has been conducted to help clients understand the wider business environment as well as the strengths and weaknesses of key industry players. Data is qualitatively analyzed to categorize companies as pure play, category-focused, industry-focused, and diversified; it is quantitatively analyzed to categorize companies as dominant, leading, strong, tentative, and weak.
Recent Development and News in Major home appliances market
- In May, 2025, Whirlpool Corp. announced the implementation of a double-digit price increase across its North American portfolio to mitigate inflationary pressures while accelerating cost-reduction initiatives.
- In April, 2025, Electrolux Group and Midea Group Co. Ltd. formed a long-term strategic partnership in North America to accelerate growth through shared manufacturing expertise and a new joint venture for food preservation.
- In April, 2025, Haier Smart Home Co. Ltd. unveiled its Level 4 smart appliance ecosystem, which utilizes advanced AI and domestic service robots that proactively synchronize with major appliances to manage household tasks.
- In March, 2025, LG Electronics Inc. launched its Essential Series in India, a new lineup of AI-powered washing machines and refrigerators designed for local conditions with plans for export to 22 international markets.
Dive into Technavio’s robust research methodology, blending expert interviews, extensive data synthesis, and validated models for unparalleled Major Home Appliances Market insights. See full methodology.
| Market Scope | |
|---|---|
| Page number | 299 |
| Base year | 2025 |
| Historic period | 2020-2024 |
| Forecast period | 2026-2030 |
| Growth momentum & CAGR | Accelerate at a CAGR of 3.9% |
| Market growth 2026-2030 | USD 84849.5 million |
| Market structure | Fragmented |
| YoY growth 2025-2026(%) | 3.8% |
| Key countries | China, India, Japan, South Korea, Indonesia, Australia, Germany, UK, France, Italy, Spain, The Netherlands, US, Canada, Mexico, Brazil, Argentina, Chile, Saudi Arabia, Turkey, UAE, South Africa and Israel |
| Competitive landscape | Leading Companies, Market Positioning of Companies, Competitive Strategies, and Industry Risks |
Research Analyst Overview
- The global major home appliances market 2026-2030 is defined by the systemic integration of intelligent technologies, reshaping traditional hardware into responsive, data-driven assets. Key advancements in resource-efficient engineering and circular consumption models are now baseline expectations, not premium features. The industrialization of generative AI domestic ecosystems and AI-driven thermal management is creating new standards for performance and user interaction.
- This has significant boardroom implications, particularly for R&D budgeting, where investment in AI-powered diagnostics and smart-grid integration is now critical for maintaining competitive relevance. For instance, firms that master AI-driven home energy management can achieve a 15% greater market penetration in regulated utility markets.
- This technological pivot is reinforced by a structural shift toward a circular economy and repairability standards, demanding a complete overhaul of conventional supply chain and product lifecycle strategies. Success depends on harmonizing ultra-efficient climate control technologies with robust interoperability standards, ensuring seamless operation within a connected home.
What are the Key Data Covered in this Major Home Appliances Market Research and Growth Report?
-
What is the expected growth of the Major Home Appliances Market between 2026 and 2030?
-
USD 84.85 billion, at a CAGR of 3.9%
-
-
What segmentation does the market report cover?
-
The report is segmented by Distribution Channel (Offline, and Online), Product (Refrigerators and freezers, Washing and drying appliances, Heating and cooling appliances, and Cooking appliances), Type (Conventional appliances, and Smart appliances) and Geography (APAC, Europe, North America, South America, Middle East and Africa)
-
-
Which regions are analyzed in the report?
-
APAC, Europe, North America, South America and Middle East and Africa
-
-
What are the key growth drivers and market challenges?
-
Institutionalization of AI driven and smart home interoperability, Institutional friction and energy labeling compliance rigor
-
-
Who are the major players in the Major Home Appliances Market?
-
Arcelik A.S., Daikin Industries Ltd., Electrolux Group, Fisher and Paykel Appliances, Godrej Appliances, Haier Smart Home Co. Ltd., Hisense International Co. Ltd., Hitachi Global Life Solutions, LG Electronics Inc., Liebherr International AG, Midea Group Co. Ltd., Panasonic Holdings Corp., Robert Bosch GmbH, Samsung Electronics Co. Ltd., Sharp Corp., Smeg S.p.a., Sub Zero Group Inc., Toshiba Corp., Voltas Ltd. and Whirlpool Corp.
-
Market Research Insights
- The major home appliances market is shaped by a dynamic interplay of technological advancement and shifting consumer priorities. The emphasis on smart home interoperability and automated demand-response protocols has led to a 20% improvement in energy efficiency for compliant devices.
- The integration of predictive maintenance alerts and remote diagnostic capabilities reduces service costs by up to 30% over a product's lifecycle. As data security standardization becomes more rigorous, manufacturers are compelled to invest in robust cybersecurity, with leading firms achieving a 99.9% defense rate against common intrusion methods.
- The growth of professional repair networks, supported by the availability of digital product information and OEM spare parts, is extending appliance longevity, fostering a more sustainable consumption model.
We can help! Our analysts can customize this major home appliances market research report to meet your requirements.
 RIA -
RIA - 
