Makeup Emulsion Market Analysis Europe, North America, APAC, South America, Middle East and Africa - US, China, Japan, Germany, France - Size and Forecast 2024-2028

Makeup Emulsion Market Analysis Europe, North America, APAC, South America, Middle East and Africa - US, China, Japan, Germany, France - Size and Forecast 2024-2028

Published: Nov 2023 165 Pages SKU: IRTNTR76820

Market Overview at a Glance

$107.62 Mn
Market Opportunity
7.43%
CAGR
6.79
YoY growth 2023-2024(%)

Makeup Emulsion Market Size 2024-2028 

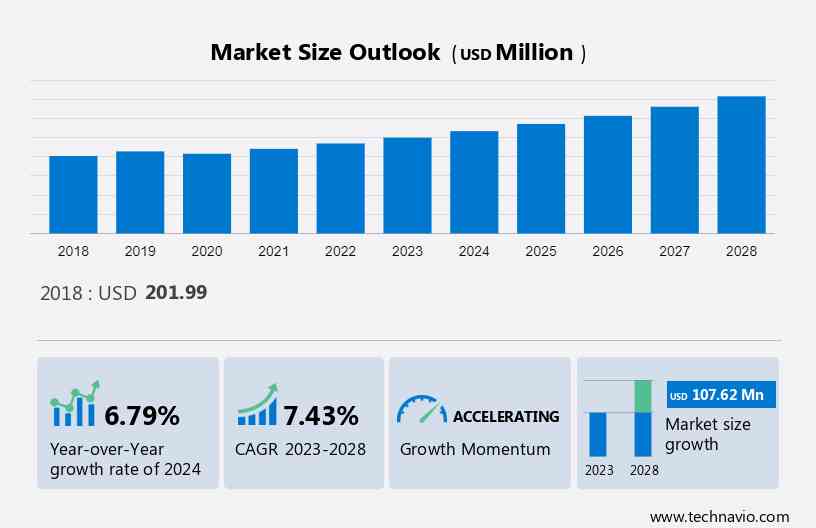
The makeup emulsion market size is estimated to grow at a CAGR of 7.43% between 2023 and 2028. The market size is forecast to increase by USD 107.62 million. The growth of the market depends on several factors such as the increasing demand for natural and organic cosmetic products, the growing influence of social media and celebrity endorsement, and the rising working women population. 

The report offers extensive research analysis on the Makeup Emulsion Market, with a categorization based on  Type including emollient water, and emollient lotion. Application segment includes over 25 years old, 18 to 25 years old. Additionally, the report provides geographical segmentation, covering Europe, North America, APAC, South America, and Middle East and AfricaMarket size, historical data for 2018-2022, and future projections are presented in terms of value (in USD million) for all the mentioned segments.

What will be the Size of the Market During the Forecast Period?

Makeup Emulsion Market Size

For More Highlights About this Report, Download Free Sample in a Minute 

Makeup Emulsion Market Dynamics

Our researchers analyzed the data with 2023 as the base year, along with the key drivers, trends, and challenges. A holistic analysis of drivers will help companies refine their marketing strategies to gain a competitive advantage.

Key Makeup Emulsion Market Driver

The rising working women population is the key factor driving market growth. Young and affluent women are the primary target customers for makeup products, including makeup emulsions, as they desire value for money. Transforming consumer preferences and fashion trends forces producers to present new products. There are different types of makeup emulsions, such as primers, available in the market. Growing consciousness about one's appearance and continuous product innovations are also assisting in driving the growth of the market.

The population of working women has been increasing in developing countries, such as China, for the last few years. The growth in the number of working women has raised the number of dual-income households. The growth in the working women population has bolstered their purchasing power, in turn, stimulating the purchase of cosmetic emulsion products. Hence, the rising working women population will drive the growth of the global makeup emulsion market during the forecast period.

Key Makeup Emulsion Market Trends

The rising adoption of multichannel marketing is the primary trend shaping market growth. Omnichannel marketing or multichannel marketing is driven by multichannel shoppers. Multichannel shoppers use multiple channels to shop, for instance, offline or online mode. The online mode has marketing through e-mail, social media, or smartphones. In the offline mode, marketing is done through specialty stores, such as Nordstrom or Sephora, or salons and spas. Moreover, multichannel marketing helps market players optimize their businesses across channels and generate higher revenue by offering consumers a better shopping experience across different channels.

In addition, the rising Internet penetration and smartphones and the increasing number of customer-engagement practices by market players (through their web portals and third-party online sellers) have contributed to the overall sales volume and revenue of market players over the last five years. Hence, the rising adoption of multichannel marketing will drive the growth of the global makeup emulsion market during the forecast period.

Key Makeup Emulsion Market Challenge

The presence of local and unorganized players is a challenge that affects market growth. This has negatively affected the sales revenue of prominent market players. Local players are also entertaining the shelf area for makeup base emulsion product brands in offline stores. A shortage of brand loyalty among consumers leads them to switch from one brand to another. Unorganized players do not add to the overall market income as their companies are not registered with the company-listing authority.

Moreover, in developing countries such as India, China, and Brazil, even with the raised penetration of organized retail, the unorganized retail sector holds the major market share. Unorganized market players sell low-priced products to end customers, which is a major challenge for international players in the global makeup emulsion market. Therefore, the presence of local and unorganized players may impede the growth of the market during the forecast period.

Makeup Emulsion Market Customer Landscape

The market research report includes the adoption lifecycle of the market, covering from the innovator’s stage to the laggard’s stage. It focuses on adoption rates in different regions based on penetration. Furthermore, the report also includes key purchase criteria and drivers of price sensitivity to help companies evaluate and develop their growth strategies.

Makeup Emulsion Market Share by Geography

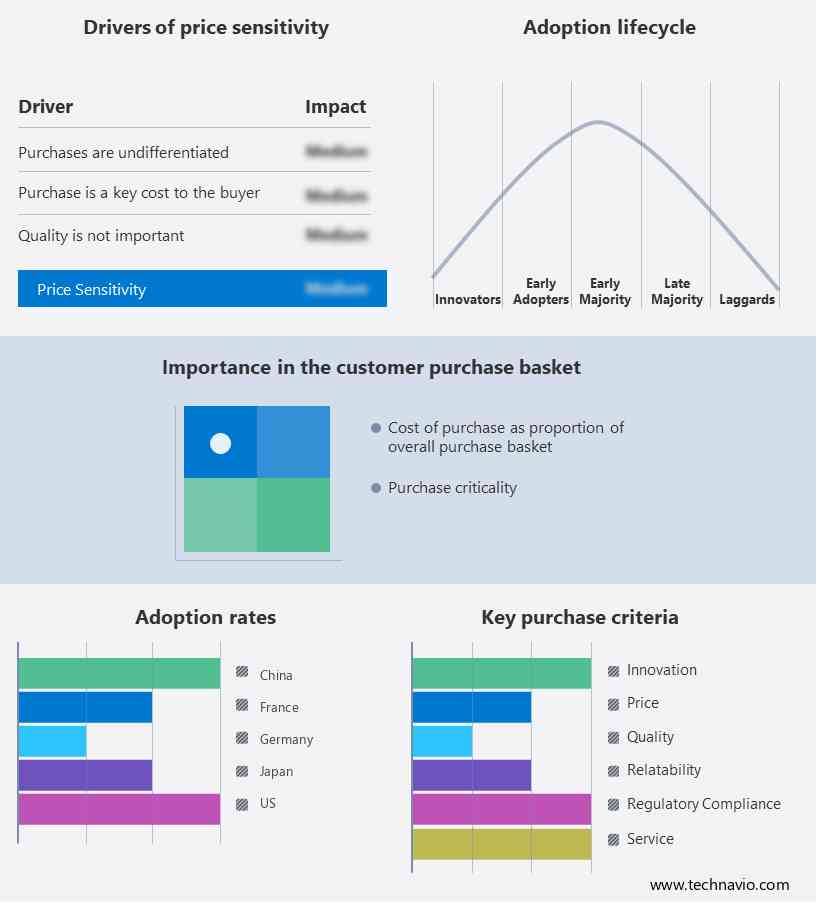
Global Makeup Emulsion Market Customer Landscape

Who are the Major Makeup Emulsion Market Companies?

Companies are implementing various strategies, such as strategic alliances, partnerships, mergers and acquisitions, geographical expansion, and product/service launches, to enhance their presence in the market.

  • AMOREPACIFIC Group Inc.: The company offers makeup emulsion such as Color Control Cushion Compact Broad Spectrum.

The research report also includes detailed analyses of the competitive landscape of the market and information about 20 market companies, including:

  • Christian Dior SE
  • DWJA Cosmetics Pvt. Ltd.
  • Erno Laszlo Inc.
  • Giorgio Armani S.p.A.
  • Glossier Inc.
  • HB USA Holdings Inc.
  • Image International Manufacturing LLC
  • Kering SA
  • Kose Corp.
  • LOreal SA
  • LVMH Moet Hennessy Louis Vuitton SE
  • Mountain Valley Springs India Pvt. Ltd.
  • Natura and Co Holding SA
  • PUIG S.L.
  • Revlon Inc.
  • Shiseido Co. Ltd.
  • The Estee Lauder Companies Inc.
  • The Procter and Gamble Co.
  • Tom Ford International LLC

Qualitative and quantitative analysis of companies has been conducted to help clients understand the wider business environment as well as the strengths and weaknesses of key market players. Data is qualitatively analyzed to categorize companies as pure play, category-focused, industry-focused, and diversified; it is quantitatively analyzed to categorize companies as dominant, leading, strong, tentative, and weak.

What is the Largest-Growing Segments in the Makeup Emulsion Market?

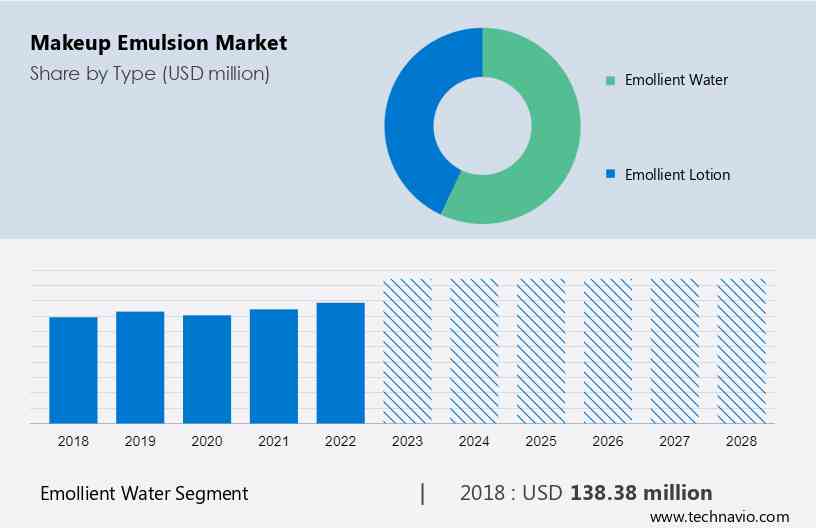
 The emollient water segment is estimated to witness significant growth during the forecast period. The emollient water segment defines a variety of products that incorporate the benefits of water-based formulations with emollient properties. Emollient water-type makeup emulsions have earned popularity due to their weightless texture, hydrating abilities, and capacity to provide a smooth and even application.

Makeup Emulsion Market Size

Get a glance at the market contribution of various segments Download the PDF Sample

The emollient water segment was the largest segment and was valued at USD 138.38 million in 2018. The rising popularity of online shopping for makeup is propelling the growth of the emollient water segment. Online beauty retailers are evolving popular, and this is delivering more possibilities for customers to buy emollient water-type makeup emulsions. In addition, beauty bloggers and influencers are mainly using emollient water-type makeup emulsions in their tutorials and videos. Thus, such factors will drive the growth of the market segment during the forecast period. 

Which are the Key Regions for the Makeup Emulsion Market?

Makeup Emulsion Market Share by Geography

For more insights on the market share of various regions Download PDF Sample now!

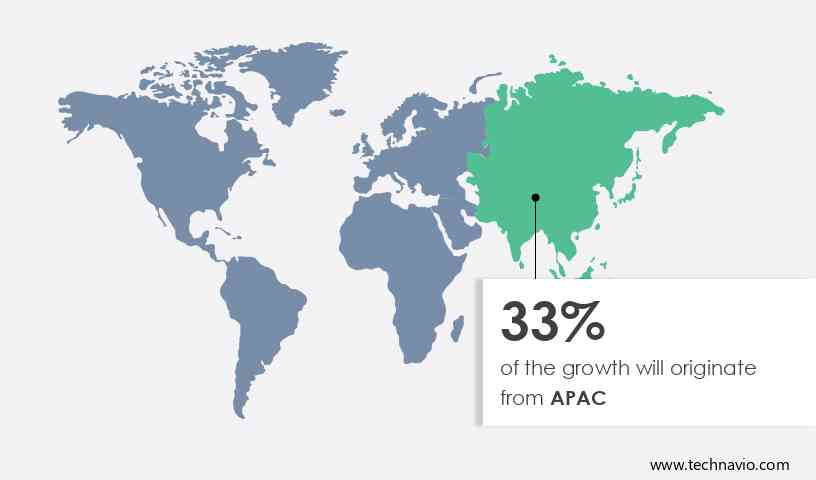
APAC is estimated to contribute 33% to the growth of the global market during the forecast period. Technavio’s analysts have elaborately explained the regional trends and drivers that shape the market during the forecast period. Another region offering significant growth opportunities to market players is Europe. The European makeup emulsion market is driven by ongoing innovation in face makeup products. Foundation makeup products are the fastest-growing category in this region. Customers are mainly ordering natural and organic cosmetics, and makeup emulsions are a good way to fulfill this demand. 

Furthermore, growing Internet penetration and the rising number of smartphone users have helped beauty product brands to grow their sales through online distribution channels. Multinational retailers of personal care and beauty products, such as Shiseido.com, spurred the sale of these products and extended their reach by giving customers lucrative discounts and other offers. The retailers are also engaged in launching campaigns for brand positioning. Hence, such factors will drive the growth of the regional market during the forecast period.

The outbreak of COVID-19 in 2020 had a negative impact on the makeup emulsion market in Europe. However, in 2021, the initiation of large-scale vaccination drives?lifted the lockdown and travel restrictions, which led to the resumption of supply chain activities. Furthermore, rising consumer preference for lightweight, skincare-infused formulations, growing demand for natural and sustainable beauty products, coupled with inventions in emulsion technology, the impact of beauty trends, the favor of multifunctional products, and the increasing awareness of skincare benefits within makeup products will drive the growth of the makeup emulsion market in Europe during the forecast period.

Segment Overview

The makeup emulsion market report forecasts market growth by revenue at global, regional & country levels and provides an analysis of the latest trends and growth opportunities from 2018 to 2028. 

  • Type Outlook 
    • Emollient water
    • Emollient lotion
  • Application Outlook
    • Over 25 years old
    • 18 to 25 years old
  • Region Outlook 
    • North America
      • The U.S.
      • Canada
    • Europe
      • U.K.
      • Germany
      • France
      • Rest of Europe
    • APAC
      • China
      • India
    • South America
      • Chile
      • Brazil 
      • Argentina
    • Middle East & Africa
      • Saudi Arabia
      • South Africa
      • Rest of the Middle East & Africa

Makeup Emulsion Market Scope

Report Coverage

Details

Page number

165

Base year

2023

Historic period

2018-2022

Forecast period

2024-2028

Growth momentum & CAGR

Accelerate at a CAGR of 7.43%

Market Growth 2024-2028

USD 107.62 million

Market structure

Fragmented

YoY growth 2023-2024(%)

6.79

Regional analysis

Europe, North America, APAC, South America, and Middle East and Africa

Performing market contribution

APAC at 33%

Key countries

US, China, Japan, Germany, and France

Competitive landscape

Leading Companies, Market Positioning of Companies, Competitive Strategies, and Industry Risks

Key companies profiled

AMOREPACIFIC Group Inc., Christian Dior SE, DWJA Cosmetics Pvt. Ltd., Erno Laszlo Inc., Giorgio Armani S.p.A., Glossier Inc., HB USA Holdings Inc., Image International Manufacturing LLC, Kering SA, Kose Corp., LOreal SA, LVMH Moet Hennessy Louis Vuitton SE, Mountain Valley Springs India Pvt. Ltd., Natura and Co Holding SA, PUIG S.L., Revlon Inc., Shiseido Co. Ltd., The Estee Lauder Companies Inc., The Procter and Gamble Co., and Tom Ford International LLC

Market dynamics

Parent market analysis, Market growth inducers and obstacles, Fast-growing and slow-growing segment analysis, COVID-19 impact and recovery analysis and future consumer dynamics, Market condition analysis for the forecast period. 

Customization purview

If our report has not included the data that you are looking for, you can reach out to our analysts and get segments customized.

Download PDF Sample

What are the Key Data Covered in this Makeup Emulsion Market Research Report?

  • CAGR of the market during the forecast period
  • Detailed information on factors that will drive the growth of the market between 2024 and 2028
  • Precise estimation of the market size and its contribution of the market in focus to the parent market
  • Accurate predictions about upcoming trends and changes in consumer behaviour
  • Growth of the market across Europe, North America, APAC, South America, and Middle East and Africa
  • Thorough analysis of the market’s competitive landscape and detailed information about companies
  • Comprehensive analysis of factors that will challenge the growth of market companies

We can help! Our analysts can customize this market research report to meet your requirements. 

Get in touch

1 Executive Summary

  • 1.1 Market overview
    • Exhibit 01: Executive Summary – Chart on Market Overview
    • Exhibit 02: Executive Summary – Data Table on Market Overview
    • Exhibit 03: Executive Summary – Chart on Global Market Characteristics
    • Exhibit 04: Executive Summary – Chart on Market by Geography
    • Exhibit 05: Executive Summary – Chart on Market Segmentation by Type
    • Exhibit 06: Executive Summary – Chart on Market Segmentation by Application
    • Exhibit 07: Executive Summary – Chart on Incremental Growth
    • Exhibit 08: Executive Summary – Data Table on Incremental Growth
    • Exhibit 09: Executive Summary – Chart on Vendor Market Positioning

2 Market Landscape

  • 2.1 Market ecosystem
    • Exhibit 10: Parent market
    • Exhibit 11: Market Characteristics

3 Market Sizing

  • 3.1 Market definition
    • Exhibit 12: Offerings of vendors included in the market definition
  • 3.2 Market segment analysis
    • Exhibit 13: Market segments
  • 3.3 Market size 2023
    • 3.4 Market outlook: Forecast for 2023-2028
      • Exhibit 14: Chart on Global - Market size and forecast 2023-2028 ($ million)
      • Exhibit 15: Data Table on Global - Market size and forecast 2023-2028 ($ million)
      • Exhibit 16: Chart on Global Market: Year-over-year growth 2023-2028 (%)
      • Exhibit 17: Data Table on Global Market: Year-over-year growth 2023-2028 (%)

    4 Historic Market Size

    • 4.1 Global makeup emulsion market 2018 - 2022
      • Exhibit 18: Historic Market Size – Data Table on global makeup emulsion market 2018 - 2022 ($ million)
    • 4.2 Type Segment Analysis 2018 - 2022
      • Exhibit 19: Historic Market Size – Type Segment 2018 - 2022 ($ million)
    • 4.3 Application Segment Analysis 2018 - 2022
      • Exhibit 20: Historic Market Size – Application Segment 2018 - 2022 ($ million)
    • 4.4 Geography Segment Analysis 2018 - 2022
      • Exhibit 21: Historic Market Size – Geography Segment 2018 - 2022 ($ million)
    • 4.5 Country Segment Analysis 2018 - 2022
      • Exhibit 22: Historic Market Size – Country Segment 2018 - 2022 ($ million)

    5 Five Forces Analysis

    • 5.1 Five forces summary
      • Exhibit 23: Five forces analysis - Comparison between 2023 and 2028
    • 5.2 Bargaining power of buyers
      • Exhibit 24: Chart on Bargaining power of buyers – Impact of key factors 2023 and 2028
    • 5.3 Bargaining power of suppliers
      • Exhibit 25: Bargaining power of suppliers – Impact of key factors in 2023 and 2028
    • 5.4 Threat of new entrants
      • Exhibit 26: Threat of new entrants – Impact of key factors in 2023 and 2028
    • 5.5 Threat of substitutes
      • Exhibit 27: Threat of substitutes – Impact of key factors in 2023 and 2028
    • 5.6 Threat of rivalry
      • Exhibit 28: Threat of rivalry – Impact of key factors in 2023 and 2028
    • 5.7 Market condition
      • Exhibit 29: Chart on Market condition - Five forces 2023 and 2028

    6 Market Segmentation by Type

    • 6.1 Market segments
      • Exhibit 30: Chart on Type - Market share 2023-2028 (%)
      • Exhibit 31: Data Table on Type - Market share 2023-2028 (%)
    • 6.2 Comparison by Type
      • Exhibit 32: Chart on Comparison by Type
      • Exhibit 33: Data Table on Comparison by Type
    • 6.3 Emollient water - Market size and forecast 2023-2028
      • Exhibit 34: Chart on Emollient water - Market size and forecast 2023-2028 ($ million)
      • Exhibit 35: Data Table on Emollient water - Market size and forecast 2023-2028 ($ million)
      • Exhibit 36: Chart on Emollient water - Year-over-year growth 2023-2028 (%)
      • Exhibit 37: Data Table on Emollient water - Year-over-year growth 2023-2028 (%)
    • 6.4 Emollient lotion - Market size and forecast 2023-2028
      • Exhibit 38: Chart on Emollient lotion - Market size and forecast 2023-2028 ($ million)
      • Exhibit 39: Data Table on Emollient lotion - Market size and forecast 2023-2028 ($ million)
      • Exhibit 40: Chart on Emollient lotion - Year-over-year growth 2023-2028 (%)
      • Exhibit 41: Data Table on Emollient lotion - Year-over-year growth 2023-2028 (%)
    • 6.5 Market opportunity by Type
      • Exhibit 42: Market opportunity by Type ($ million)
      • Exhibit 43: Data Table on Market opportunity by Type ($ million)

    7 Market Segmentation by Application

    • 7.1 Market segments
      • Exhibit 44: Chart on Application - Market share 2023-2028 (%)
      • Exhibit 45: Data Table on Application - Market share 2023-2028 (%)
    • 7.2 Comparison by Application
      • Exhibit 46: Chart on Comparison by Application
      • Exhibit 47: Data Table on Comparison by Application
    • 7.3 Over 25 years old - Market size and forecast 2023-2028
      • Exhibit 48: Chart on Over 25 years old - Market size and forecast 2023-2028 ($ million)
      • Exhibit 49: Data Table on Over 25 years old - Market size and forecast 2023-2028 ($ million)
      • Exhibit 50: Chart on Over 25 years old - Year-over-year growth 2023-2028 (%)
      • Exhibit 51: Data Table on Over 25 years old - Year-over-year growth 2023-2028 (%)
    • 7.4 18 to 25 years old - Market size and forecast 2023-2028
      • Exhibit 52: Chart on 18 to 25 years old - Market size and forecast 2023-2028 ($ million)
      • Exhibit 53: Data Table on 18 to 25 years old - Market size and forecast 2023-2028 ($ million)
      • Exhibit 54: Chart on 18 to 25 years old - Year-over-year growth 2023-2028 (%)
      • Exhibit 55: Data Table on 18 to 25 years old - Year-over-year growth 2023-2028 (%)
    • 7.5 Market opportunity by Application
      • Exhibit 56: Market opportunity by Application ($ million)
      • Exhibit 57: Data Table on Market opportunity by Application ($ million)

    8 Customer Landscape

    • 8.1 Customer landscape overview
      • Exhibit 58: Analysis of price sensitivity, lifecycle, customer purchase basket, adoption rates, and purchase criteria

    9 Geographic Landscape

    • 9.1 Geographic segmentation
      • Exhibit 59: Chart on Market share by geography 2023-2028 (%)
      • Exhibit 60: Data Table on Market share by geography 2023-2028 (%)
    • 9.2 Geographic comparison
      • Exhibit 61: Chart on Geographic comparison
      • Exhibit 62: Data Table on Geographic comparison
    • 9.3 Europe - Market size and forecast 2023-2028
      • Exhibit 63: Chart on Europe - Market size and forecast 2023-2028 ($ million)
      • Exhibit 64: Data Table on Europe - Market size and forecast 2023-2028 ($ million)
      • Exhibit 65: Chart on Europe - Year-over-year growth 2023-2028 (%)
      • Exhibit 66: Data Table on Europe - Year-over-year growth 2023-2028 (%)
    • 9.4 North America - Market size and forecast 2023-2028
      • Exhibit 67: Chart on North America - Market size and forecast 2023-2028 ($ million)
      • Exhibit 68: Data Table on North America - Market size and forecast 2023-2028 ($ million)
      • Exhibit 69: Chart on North America - Year-over-year growth 2023-2028 (%)
      • Exhibit 70: Data Table on North America - Year-over-year growth 2023-2028 (%)
    • 9.5 APAC - Market size and forecast 2023-2028
      • Exhibit 71: Chart on APAC - Market size and forecast 2023-2028 ($ million)
      • Exhibit 72: Data Table on APAC - Market size and forecast 2023-2028 ($ million)
      • Exhibit 73: Chart on APAC - Year-over-year growth 2023-2028 (%)
      • Exhibit 74: Data Table on APAC - Year-over-year growth 2023-2028 (%)
    • 9.6 South America - Market size and forecast 2023-2028
      • Exhibit 75: Chart on South America - Market size and forecast 2023-2028 ($ million)
      • Exhibit 76: Data Table on South America - Market size and forecast 2023-2028 ($ million)
      • Exhibit 77: Chart on South America - Year-over-year growth 2023-2028 (%)
      • Exhibit 78: Data Table on South America - Year-over-year growth 2023-2028 (%)
    • 9.7 Middle East and Africa - Market size and forecast 2023-2028
      • Exhibit 79: Chart on Middle East and Africa - Market size and forecast 2023-2028 ($ million)
      • Exhibit 80: Data Table on Middle East and Africa - Market size and forecast 2023-2028 ($ million)
      • Exhibit 81: Chart on Middle East and Africa - Year-over-year growth 2023-2028 (%)
      • Exhibit 82: Data Table on Middle East and Africa - Year-over-year growth 2023-2028 (%)
    • 9.8 US - Market size and forecast 2023-2028
      • Exhibit 83: Chart on US - Market size and forecast 2023-2028 ($ million)
      • Exhibit 84: Data Table on US - Market size and forecast 2023-2028 ($ million)
      • Exhibit 85: Chart on US - Year-over-year growth 2023-2028 (%)
      • Exhibit 86: Data Table on US - Year-over-year growth 2023-2028 (%)
    • 9.9 China - Market size and forecast 2023-2028
      • Exhibit 87: Chart on China - Market size and forecast 2023-2028 ($ million)
      • Exhibit 88: Data Table on China - Market size and forecast 2023-2028 ($ million)
      • Exhibit 89: Chart on China - Year-over-year growth 2023-2028 (%)
      • Exhibit 90: Data Table on China - Year-over-year growth 2023-2028 (%)
    • 9.10 Germany - Market size and forecast 2023-2028
      • Exhibit 91: Chart on Germany - Market size and forecast 2023-2028 ($ million)
      • Exhibit 92: Data Table on Germany - Market size and forecast 2023-2028 ($ million)
      • Exhibit 93: Chart on Germany - Year-over-year growth 2023-2028 (%)
      • Exhibit 94: Data Table on Germany - Year-over-year growth 2023-2028 (%)
    • 9.11 Japan - Market size and forecast 2023-2028
      • Exhibit 95: Chart on Japan - Market size and forecast 2023-2028 ($ million)
      • Exhibit 96: Data Table on Japan - Market size and forecast 2023-2028 ($ million)
      • Exhibit 97: Chart on Japan - Year-over-year growth 2023-2028 (%)
      • Exhibit 98: Data Table on Japan - Year-over-year growth 2023-2028 (%)
    • 9.12 France - Market size and forecast 2023-2028
      • Exhibit 99: Chart on France - Market size and forecast 2023-2028 ($ million)
      • Exhibit 100: Data Table on France - Market size and forecast 2023-2028 ($ million)
      • Exhibit 101: Chart on France - Year-over-year growth 2023-2028 (%)
      • Exhibit 102: Data Table on France - Year-over-year growth 2023-2028 (%)
    • 9.13 Market opportunity by geography
      • Exhibit 103: Market opportunity by geography ($ million)
      • Exhibit 104: Data Tables on Market opportunity by geography ($ million)

    10 Drivers, Challenges, and Trends

    • 10.1 Market drivers
      • 10.2 Market challenges
        • 10.3 Impact of drivers and challenges
          • Exhibit 105: Impact of drivers and challenges in 2023 and 2028
        • 10.4 Market trends

          11 Vendor Landscape

          • 11.1 Overview
            • 11.2 Vendor landscape
              • Exhibit 106: Overview on Criticality of inputs and Factors of differentiation
            • 11.3 Landscape disruption
              • Exhibit 107: Overview on factors of disruption
            • 11.4 Industry risks
              • Exhibit 108: Impact of key risks on business

            12 Vendor Analysis

            • 12.1 Vendors covered
              • Exhibit 109: Vendors covered
            • 12.2 Market positioning of vendors
              • Exhibit 110: Matrix on vendor position and classification
            • 12.3 AMOREPACIFIC Group Inc.
              • Exhibit 111: AMOREPACIFIC Group Inc. - Overview
              • Exhibit 112: AMOREPACIFIC Group Inc. - Business segments
              • Exhibit 113: AMOREPACIFIC Group Inc. - Key news
              • Exhibit 114: AMOREPACIFIC Group Inc. - Key offerings
              • Exhibit 115: AMOREPACIFIC Group Inc. - Segment focus
            • 12.4 Christian Dior SE
              • Exhibit 116: Christian Dior SE - Overview
              • Exhibit 117: Christian Dior SE - Product / Service
              • Exhibit 118: Christian Dior SE - Key offerings
            • 12.5 Erno Laszlo Inc.
              • Exhibit 119: Erno Laszlo Inc. - Overview
              • Exhibit 120: Erno Laszlo Inc. - Product / Service
              • Exhibit 121: Erno Laszlo Inc. - Key offerings
            • 12.6 Giorgio Armani S.p.A.
              • Exhibit 122: Giorgio Armani S.p.A. - Overview
              • Exhibit 123: Giorgio Armani S.p.A. - Product / Service
              • Exhibit 124: Giorgio Armani S.p.A. - Key offerings
            • 12.7 Glossier Inc.
              • Exhibit 125: Glossier Inc. - Overview
              • Exhibit 126: Glossier Inc. - Product / Service
              • Exhibit 127: Glossier Inc. - Key offerings
            • 12.8 Image International Manufacturing LLC
              • Exhibit 128: Image International Manufacturing LLC - Overview
              • Exhibit 129: Image International Manufacturing LLC - Product / Service
              • Exhibit 130: Image International Manufacturing LLC - Key offerings
            • 12.9 Kose Corp.
              • Exhibit 131: Kose Corp. - Overview
              • Exhibit 132: Kose Corp. - Product / Service
              • Exhibit 133: Kose Corp. - Key offerings
            • 12.10 LOreal SA
              • Exhibit 134: LOreal SA - Overview
              • Exhibit 135: LOreal SA - Business segments
              • Exhibit 136: LOreal SA - Key news
              • Exhibit 137: LOreal SA - Key offerings
              • Exhibit 138: LOreal SA - Segment focus
            • 12.11 LVMH Moet Hennessy Louis Vuitton SE
              • Exhibit 139: LVMH Moet Hennessy Louis Vuitton SE - Overview
              • Exhibit 140: LVMH Moet Hennessy Louis Vuitton SE - Business segments
              • Exhibit 141: LVMH Moet Hennessy Louis Vuitton SE - Key news
              • Exhibit 142: LVMH Moet Hennessy Louis Vuitton SE - Key offerings
              • Exhibit 143: LVMH Moet Hennessy Louis Vuitton SE - Segment focus
            • 12.12 Mountain Valley Springs India Pvt. Ltd.
              • Exhibit 144: Mountain Valley Springs India Pvt. Ltd. - Overview
              • Exhibit 145: Mountain Valley Springs India Pvt. Ltd. - Product / Service
              • Exhibit 146: Mountain Valley Springs India Pvt. Ltd. - Key offerings
            • 12.13 Natura and Co Holding SA
              • Exhibit 147: Natura and Co Holding SA - Overview
              • Exhibit 148: Natura and Co Holding SA - Business segments
              • Exhibit 149: Natura and Co Holding SA - Key offerings
              • Exhibit 150: Natura and Co Holding SA - Segment focus
            • 12.14 Revlon Inc.
              • Exhibit 151: Revlon Inc. - Overview
              • Exhibit 152: Revlon Inc. - Business segments
              • Exhibit 153: Revlon Inc. - Key offerings
              • Exhibit 154: Revlon Inc. - Segment focus
            • 12.15 Shiseido Co. Ltd.
              • Exhibit 155: Shiseido Co. Ltd. - Overview
              • Exhibit 156: Shiseido Co. Ltd. - Product / Service
              • Exhibit 157: Shiseido Co. Ltd. - Key offerings
            • 12.16 The Estee Lauder Companies Inc.
              • Exhibit 158: The Estee Lauder Companies Inc. - Overview
              • Exhibit 159: The Estee Lauder Companies Inc. - Product / Service
              • Exhibit 160: The Estee Lauder Companies Inc. - Key offerings
            • 12.17 The Procter and Gamble Co.
              • Exhibit 161: The Procter and Gamble Co. - Overview
              • Exhibit 162: The Procter and Gamble Co. - Business segments
              • Exhibit 163: The Procter and Gamble Co. - Key news
              • Exhibit 164: The Procter and Gamble Co. - Key offerings
              • Exhibit 165: The Procter and Gamble Co. - Segment focus

            13 Appendix

            • 13.1 Scope of the report
              • 13.2 Inclusions and exclusions checklist
                • Exhibit 166: Inclusions checklist
                • Exhibit 167: Exclusions checklist
              • 13.3 Currency conversion rates for US$
                • Exhibit 168: Currency conversion rates for US$
              • 13.4 Research methodology
                • Exhibit 169: Research methodology
                • Exhibit 170: Validation techniques employed for market sizing
                • Exhibit 171: Information sources
              • 13.5 List of abbreviations
                • Exhibit 172: List of abbreviations

                Research Methodology

                Technavio presents a detailed picture of the market by way of study, synthesis, and summation of data from multiple sources. The analysts have presented the various facets of the market with a particular focus on identifying the key industry influencers. The data thus presented is comprehensive, reliable, and the result of extensive research, both primary and secondary.

                INFORMATION SOURCES

                Primary sources

                • Manufacturers and suppliers
                • Channel partners
                • Industry experts
                • Strategic decision makers

                Secondary sources

                • Industry journals and periodicals
                • Government data
                • Financial reports of key industry players
                • Historical data
                • Press releases

                DATA ANALYSIS

                Data Synthesis

                • Collation of data
                • Estimation of key figures
                • Analysis of derived insights

                Data Validation

                • Triangulation with data models
                • Reference against proprietary databases
                • Corroboration with industry experts

                REPORT WRITING

                Qualitative

                • Market drivers
                • Market challenges
                • Market trends
                • Five forces analysis

                Quantitative

                • Market size and forecast
                • Market segmentation
                • Geographical insights
                • Competitive landscape

                Interested in this report?

                Get your sample now to see our research methodology and insights!

                Download Now

                Frequently Asked Questions

                Makeup Emulsion market growth will increase by 107.62 million during 2024-2028.

                The Makeup Emulsion market is expected to grow at a CAGR of 7.43% during 2024-2028.

                Makeup Emulsion market is segmented by Type( Emollient water, Emollient lotion) Application( Over 25 years old, 18 to 25 years old)

                AMOREPACIFIC Group Inc., Christian Dior SE, DWJA Cosmetics Pvt. Ltd., Erno Laszlo Inc., Giorgio Armani S.p.A., Glossier Inc., HB USA Holdings Inc., Image International Manufacturing LLC, Kering SA, Kose Corp., LOreal SA, LVMH Moet Hennessy Louis Vuitton SE, Mountain Valley Springs India Pvt. Ltd., Natura and Co Holding SA, PUIG S.L., Revlon Inc., Shiseido Co. Ltd., The Estee Lauder Companies Inc., The Procter and Gamble Co., Tom Ford International LLC are a few of the key vendors in the Makeup Emulsion market.

                APAC will register the highest growth rate of 33.04% among the other regions. Therefore, the Makeup Emulsion market in APAC is expected to garner significant business opportunities for the vendors during the forecast period.

                US, China, Japan, Germany, France

                • Increasing demand for natural and organic cosmetic productsConsumer preferences have shifted toward cosmetics products that contain natural and organic ingredients. Makeup emulsions is the driving factor this market.
                • such as plant-based emulsifiers derived from natural sources is the driving factor this market.
                • are in high demand due to this trend. Manufacturers of makeup emulsions are responding to this demand by developing emulsifiers sourced from botanical extracts is the driving factor this market.
                • natural oils is the driving factor this market.
                • and organic materials. The clean beauty movement emphasizes ingredient transparency and avoiding potentially harmful substances. Emulsifiers that are used in natural and organic cosmetics must align with these principles is the driving factor this market.
                • which means they should have a clean and safe ingredient profile. Consumers are increasingly conscious of the environmental impact of the cosmetic products they use. Natural and organic cosmetic products often promote sustainability and eco-friendliness is the driving factor this market.
                • and therefore is the driving factor this market.
                • emulsifiers that meet these criteria are preferred. Natural and organic cosmetics and personal care products are perceived to be safer and gentler on the skin. Emulsifiers used in these formulations should ensure that they minimize the risk of skin irritation and allergies is the driving factor this market.
                • thus catering to consumer concerns about health and safety. Emulsifiers that are hypoallergenic and free from common allergens are sought after for natural and organic cosmetic products. These emulsifiers cater to the needs of individuals with sensitive or reactive skin. In addition to this is the driving factor this market.
                • the demand for natural and organic cosmetics extends to personalized skincare products. Emulsifiers play a critical role in formulating customized skincare products that are tailored to address specific skin concerns using natural and organic ingredients. Consumers look for product certifications that include labels such as organic is the driving factor this market.
                • vegan is the driving factor this market.
                • cruelty-free is the driving factor this market.
                • and non-genetically modified organism (GMO). Emulsifiers used in certified natural and organic cosmetic products must comply with the relevant regulatory standards to maintain product integrity and retain the trust of consumers. Thus is the driving factor this market.
                • the growing demand for natural and organic cosmetics will propel the growth of the global makeup emulsion market during the forecast period. is the driving factor this market.

                The Makeup Emulsion market vendors should focus on grabbing business opportunities from the Emollient water segment as it accounted for the largest market share in the base year.