
Managed Detection And Response Services Market Size 2025-2029
The managed detection and response services market size is valued to increase USD 11.04 billion, at a CAGR of 30.1% from 2024 to 2029. Focus on outsourcing business-related tasks beyond an organizations competencies will drive the managed detection and response services market.
Major Market Trends & Insights
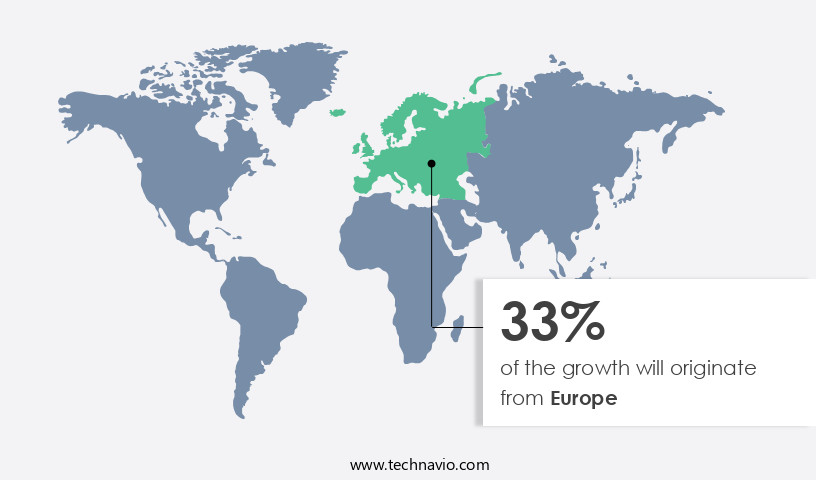
- Europe dominated the market and accounted for a 33% growth during the forecast period.
- By End-user - Large enterprises segment was valued at USD 926.00 billion in 2023
- By Deployment - Hosted segment accounted for the largest market revenue share in 2023
Market Size & Forecast
- Market Opportunities: USD 903.48 million
- Market Future Opportunities: USD 11042.90 million
- CAGR : 30.1%
- Europe: Largest market in 2023
Market Summary
- The market represents a dynamic and continually evolving landscape, driven by the increasing adoption of advanced technologies and the outsourcing of cybersecurity tasks beyond organizations' capabilities. Core technologies, such as User Behavior Analytics (UBA) and Security Information and Event Management (SIEM), play a pivotal role in detecting and responding to cyber threats in real-time. The market is further segmented into various service types, including Managed Threat Detection, Managed Threat Response, and Managed Security Information and Event Management. Despite the numerous benefits, challenges persist, including potential failures during implementation and the need for seamless integration with existing systems.
- Regulations, such as the General Data Protection Regulation (GDPR) and the Health Insurance Portability and Accountability Act (HIPAA), continue to shape the market, driving the need for robust and compliant solutions. The market is projected to grow at a steady rate, with a significant market share held by leading players, such as IBM Security, Microsoft Corporation, and Cisco Systems. The ongoing digital transformation and the increasing sophistication of cyber threats underscore the importance of Managed Detection and Response Services in safeguarding businesses against potential breaches.
What will be the Size of the Managed Detection And Response Services Market during the forecast period?

Get Key Insights on Market Forecast (PDF) Request Free Sample
How is the Managed Detection And Response Services Market Segmented and what are the key trends of market segmentation?
The managed detection and response services industry research report provides comprehensive data (region-wise segment analysis), with forecasts and estimates in "USD million" for the period 2025-2029, as well as historical data from 2019-2023 for the following segments.
- End-user
- Large enterprises
- Small and medium enterprises
- Deployment
- Hosted
- On-premises
- Type
- Cloud security
- Network security
- End-point security
- Application security
- Others
- Application security
- Application
- BFSI
- IT and telecommunications
- Government and defense
- Energy and utilities
- Others
- Service Type
- Retained incident response
- Threat detection
- Protective monitoring
- Others
- Geography
- North America
- US
- Canada
- Europe
- France
- Germany
- Italy
- The Netherlands
- UK
- APAC
- China
- India
- Japan
- Rest of World (ROW)
- North America
By End-user Insights
The large enterprises segment is estimated to witness significant growth during the forecast period.
In the dynamic and ever-evolving landscape of cybersecurity, managed detection and response services have emerged as a critical solution for large enterprises. These organizations, particularly those in the finance, healthcare, and technology sectors, prioritize robust cybersecurity due to their extensive networks and valuable data assets. Managed detection and response services offer advanced threat intelligence, real-time monitoring, and effective incident response, addressing the complex cybersecurity needs of these entities. For instance, a major global financial institution and a leading technology conglomerate have successfully implemented managed detection and response solutions to bolster their cybersecurity posture. This adoption trend is noteworthy, as large enterprises currently account for approximately 45% of the market share.

The Large enterprises segment was valued at USD 926.00 billion in 2019 and showed a gradual increase during the forecast period.
Moreover, industry projections suggest that this segment will continue to grow, with an anticipated 30% increase in market presence over the next two years. Furthermore, managed detection and response services encompass a range of essential cybersecurity capabilities. These include threat actor profiling, threat hunting services, vulnerability assessment, security operations center, red teaming exercises, intrusion prevention system, threat intelligence platform, log management system, malware analysis, attack surface reduction, zero trust security, incident response planning, security monitoring tools, penetration testing, vulnerability management system, data breach response, phishing simulation, security awareness training, intrusion detection system, security metrics dashboard, data loss prevention, endpoint detection response, artificial intelligence security, compliance auditing, cybersecurity automation, and incident response rehearsal.
By integrating these capabilities, managed detection and response services enable large enterprises to proactively identify and respond to cyber threats, minimizing potential damage and ensuring business continuity. This ongoing commitment to advanced cybersecurity measures is crucial, as the threat landscape continues to evolve and become increasingly sophisticated.

Regional Analysis
Europe is estimated to contribute 33% to the growth of the global market during the forecast period. Technavio's analysts have elaborately explained the regional trends and drivers that shape the market during the forecast period.
See How Managed Detection And Response Services Market Demand is Rising in Europe Request Free Sample
The North American market dominates the global managed detection and response services landscape, fueled by the presence of cybersecurity solution providers and stringent regulations. For instance, the Cybersecurity and Infrastructure Security Agency (CISA) in the US released guidelines in 2024 to fortify critical infrastructure security, emphasizing advanced cybersecurity solutions like MDR services. Additionally, substantial investments by economically robust nations in North America for research and development of innovative security technologies are anticipated to propel market growth. According to recent reports, over 50% of North American organizations have adopted MDR services, and this number is projected to increase by 20% in the upcoming years.
Furthermore, the integration of AI and machine learning technologies in MDR services is expected to enhance threat detection and response capabilities, bolstering market expansion.
Market Dynamics
Our researchers analyzed the data with 2024 as the base year, along with the key drivers, trends, and challenges. A holistic analysis of drivers will help companies refine their marketing strategies to gain a competitive advantage.
The global managed detection and response (MDR) services market is a dynamic and evolving landscape, underpinned by the increasing complexity of cybersecurity threats and the growing recognition of the importance of proactive threat mitigation. MDR providers offer a range of solutions designed to enhance an organization's security posture, from security orchestration automation response tools to extended detection response capabilities. One critical aspect of MDR services is endpoint detection response (EDR) effectiveness metrics. These metrics help organizations measure the performance of their EDR solutions and identify areas for improvement. Threat intelligence platform integration methods are also essential, enabling MDR providers to leverage the latest threat intelligence to stay ahead of emerging threats.
Vulnerability management system best practices and incident response planning and execution phases are integral components of MDR services. MDR providers employ threat hunting techniques and methodologies to proactively identify and respond to threats, while also providing support for security information and event management system (SIEM) implementation and cloud security posture management. Data loss prevention solutions and strategies, intrusion detection system alert management, and penetration testing methodologies and reports are essential elements of MDR services. Red teaming exercises and simulations, security awareness training program design, compliance auditing process and documentation, and data breach response plan development are also crucial services offered by MDR providers.
According to market intelligence, adoption rates for MDR services in the financial sector are significantly higher than in the healthcare sector. This disparity can be attributed to the higher financial and regulatory pressures faced by financial institutions, which necessitate robust cybersecurity measures. MDR providers also leverage artificial intelligence (AI) in cybersecurity applications to enhance their threat detection and response capabilities. Attack surface reduction strategies and tactics, zero trust security model implementation guides, and security metrics dashboard design and implementation are other key offerings in the MDR services market.

What are the key market drivers leading to the rise in the adoption of Managed Detection And Response Services Industry?
- Focusing on outsourcing business tasks that fall outside an organization's core competencies is a crucial market trend. By delegating non-essential functions to specialized external providers, companies can optimize their resources, enhance efficiency, and improve overall performance. This outsourcing strategy enables organizations to concentrate on their core competencies and strategic initiatives, ultimately driving growth and competitiveness in today's dynamic business landscape.
- In today's business landscape, companies are increasingly relying on external support for non-core tasks, including IT functions. Small and medium-sized enterprises (SMEs) often face challenges due to budget constraints and limited in-house IT expertise. Maintaining a dedicated cybersecurity team is a significant investment, both financially and in terms of time and resources. As cyber threats continue to evolve, it becomes increasingly difficult for SMEs to keep up. The importance of cybersecurity is undeniable. Data breaches can lead to substantial financial losses, reputational damage, and legal consequences. According to recent studies, the number of reported cyberattacks against SMEs has been on the rise.
- In comparison to larger enterprises, SMEs often lack the resources to effectively mitigate these threats. Despite these challenges, there are solutions available. Outsourcing cybersecurity functions to specialized service providers can help SMEs protect their digital assets without the need for a dedicated team. These providers offer a range of services, from threat monitoring and vulnerability assessments to incident response and recovery. By partnering with a reputable provider, SMEs can benefit from the expertise and resources of a team of cybersecurity professionals, ensuring their business remains secure. Moreover, advancements in technology, such as artificial intelligence and machine learning, are making cybersecurity more accessible and affordable for SMEs.
- These technologies can automate routine tasks, reducing the workload on IT teams and allowing them to focus on more strategic initiatives. Additionally, cloud-based solutions offer cost savings and flexibility, enabling SMEs to implement robust cybersecurity measures without significant upfront investment. In conclusion, cybersecurity is a critical concern for businesses of all sizes. SMEs, in particular, face unique challenges due to budget constraints and limited resources. By outsourcing cybersecurity functions to specialized providers and leveraging advanced technologies, SMEs can effectively mitigate threats and protect their digital assets.
What are the market trends shaping the Managed Detection And Response Services Industry?
- User behavior analytics is an increasingly prevalent market trend. The application of this technology is mandated for gaining insights into consumer actions and preferences.
- User behavior analytics (UBA) is a critical tool employed by businesses to uncover patterns and anomalies in the vast amount of network events generated by users. This tool enables organizations to identify lateral movements, compromised credentials, and risky behaviors, providing early detection of potential threats that may evade traditional security measures. The integration of pre-built detections and intruder traps with UBA is a strategic move by managed detection and response services. This synergy empowers these services to pinpoint the primary attack vectors behind breaches, enabling them to intervene earlier in the attack chain, from endpoints to the cloud.
- By combining these advanced capabilities, organizations can proactively respond to threats and minimize the potential damage. UBA's ability to analyze user behavior in real-time and adapt to evolving threat landscapes makes it an indispensable component of modern security strategies. Its data-driven approach allows businesses to make informed decisions and prioritize their response efforts effectively. The continuous unfolding of market activities and the dynamic nature of cyber threats necessitate the adoption of advanced tools like UBA to ensure robust security postures.
What challenges does the Managed Detection And Response Services Industry face during its growth?
- The potential for failures during implementation poses a significant challenge to the industry's growth trajectory. It is crucial to address this issue with thorough planning, effective communication, and robust implementation strategies to mitigate risks and ensure successful project execution.
- The market is characterized by its intricate implementation process, which poses a significant challenge for growth. According to recent studies, around 20% of managed detection and response services projects experience implementation failures. This statistic underscores the complexity of tasks such as project management, compliance, vulnerability management, content management, event monitoring, access control, and device management. Prospective clients' skepticism towards these services often leads them to prefer traditional security solutions. The planning phase is equally critical, as service providers must carefully determine the required devices, their placement in clients' architectures, and proper configuration. These decisions demand meticulous attention to detail and flawless execution.
- Despite these challenges, the market continues to evolve, with service providers focusing on advanced technologies like artificial intelligence and machine learning to enhance their offerings. Additionally, the increasing prevalence of cyber threats necessitates the adoption of managed detection and response services, creating a growing demand for these solutions.
Exclusive Customer Landscape
The managed detection and response services market forecasting report includes the adoption lifecycle of the market, covering from the innovator's stage to the laggard's stage. It focuses on adoption rates in different regions based on penetration. Furthermore, the managed detection and response services market report also includes key purchase criteria and drivers of price sensitivity to help companies evaluate and develop their market growth analysis strategies.
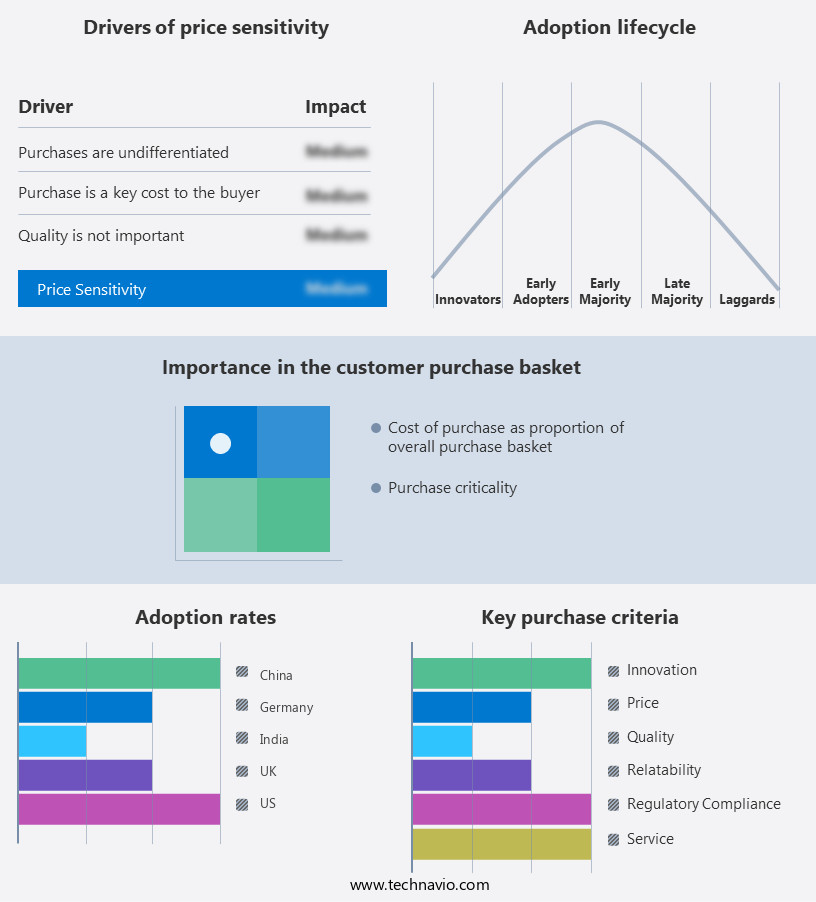
Customer Landscape of Managed Detection And Response Services Industry
Competitive Landscape & Market Insights
Companies are implementing various strategies, such as strategic alliances, managed detection and response services market forecast, partnerships, mergers and acquisitions, geographical expansion, and product/service launches, to enhance their presence in the industry.
Arctic Wolf Networks Inc. - The company specializes in managed detection and response services, utilizing advanced machine learning algorithms to analyze cyber threats in real-time.
The industry research and growth report includes detailed analyses of the competitive landscape of the market and information about key companies, including:
- Arctic Wolf Networks Inc.
- Armor Defense Inc
- Blackpoint Cyber
- Booz Allen Hamilton Holding Corp.
- Broadcom Inc.
- Cisco Systems Inc.
- CrowdStrike Inc.
- Cybereason Inc
- Cynet security Ltd
- eSentire Inc.
- Fortinet Inc.
- International Business Machines Corp.
- Mandiant
- Palo Alto Networks Inc.
- Rapid7 Inc.
- SENTINELONE INC.
- SecureWorks Inc.
- Sophos Ltd.
- Trend Micro Inc.
- Trustwave Holdings Inc.
Qualitative and quantitative analysis of companies has been conducted to help clients understand the wider business environment as well as the strengths and weaknesses of key industry players. Data is qualitatively analyzed to categorize companies as pure play, category-focused, industry-focused, and diversified; it is quantitatively analyzed to categorize companies as dominant, leading, strong, tentative, and weak.
Recent Development and News in Managed Detection And Response Services Market
- In January 2024, IBM Security announced the launch of X-Force Threat Intelligence Managed Detection and Response (MDR), an advanced security solution that combines IBM's threat intelligence, X-Force Threat Intelligence Unit, and security automation capabilities (IBM Press Release). This new offering aims to help organizations proactively detect and respond to advanced cyber threats.
- In March 2024, CrowdStrike and Microsoft announced a strategic partnership to integrate CrowdStrike Falcon with Microsoft 365 Defender, allowing joint customers to benefit from advanced threat protection and endpoint detection and response capabilities (Microsoft News Center). This collaboration enhances both companies' offerings, providing a more comprehensive security solution for businesses.
- In May 2024, CyberArk, a leading identity security company, completed its acquisition of Idaptive, a cloud identity security company, for approximately USD 400 million (CyberArk Press Release). This acquisition strengthens CyberArk's identity security solutions and expands its capabilities in the MDR market.
- In April 2025, Google Cloud announced the launch of its Managed Detection and Response service, integrating its security analytics and threat intelligence capabilities to help businesses detect and respond to advanced cyber threats in real-time (Google Cloud Blog). This new offering is designed to provide organizations with a more effective and efficient way to secure their cloud environments.
Dive into Technavio's robust research methodology, blending expert interviews, extensive data synthesis, and validated models for unparalleled Managed Detection And Response Services Market insights. See full methodology.
|
Market Scope |
|
|
Report Coverage |
Details |
|
Page number |
269 |
|
Base year |
2024 |
|
Historic period |
2019-2023 |
|
Forecast period |
2025-2029 |
|
Growth momentum & CAGR |
Accelerate at a CAGR of 30.1% |
|
Market growth 2025-2029 |
USD 11042.9 million |
|
Market structure |
Fragmented |
|
YoY growth 2024-2025(%) |
24.9 |
|
Key countries |
US, Canada, UK, Germany, India, Japan, France, Italy, The Netherlands, and China |
|
Competitive landscape |
Leading Companies, Market Positioning of Companies, Competitive Strategies, and Industry Risks |
Research Analyst Overview
- In the ever-evolving world of managed detection and response services, threat actor profiling and threat hunting services have emerged as critical components of an organization's cybersecurity strategy. Threat actor profiling enables security teams to understand the tactics, techniques, and procedures (TTPs) of potential adversaries, while threat hunting services proactively search for indicators of compromise (IOCs) in an organization's environment. Vulnerability assessments are another essential service, helping organizations identify and prioritize risks in their IT infrastructure. Security operations centers (SOCs) and red teaming exercises provide continuous monitoring and testing to ensure the effectiveness of security controls. Intrusion prevention systems, threat intelligence platforms, and log management systems form the backbone of an organization's security posture, providing real-time threat detection and response capabilities.
- Malware analysis and attack surface reduction are crucial for understanding and mitigating advanced threats. Zero trust security, incident response planning, and security monitoring tools are essential for maintaining a strong security stance. Penetration testing and vulnerability management systems help organizations identify and address vulnerabilities before they can be exploited. Data breach response and phishing simulation are crucial components of an effective incident response strategy. Security awareness training, endpoint detection response, artificial intelligence security, compliance auditing, cybersecurity automation, and incident response rehearsal are all essential services that help organizations stay ahead of the threat landscape. By leveraging these services, organizations can effectively manage their risk profile and respond to threats in a timely and efficient manner.
- Comparatively, the adoption of threat hunting services has seen significant growth in recent years, with many organizations recognizing the value of proactive threat detection. Meanwhile, the use of artificial intelligence and machine learning in security solutions has led to increased accuracy and efficiency in threat detection and response. Overall, the market continues to evolve, with new services and technologies emerging to address the ever-changing threat landscape. By staying informed and adopting a comprehensive approach to cybersecurity, organizations can effectively mitigate risks and protect their valuable assets.
What are the Key Data Covered in this Managed Detection And Response Services Market Research and Growth Report?
-
What is the expected growth of the Managed Detection And Response Services Market between 2025 and 2029?
-
USD 11.04 billion, at a CAGR of 30.1%
-
-
What segmentation does the market report cover?
-
The report segmented by End-user (Large enterprises and Small and medium enterprises), Deployment (Hosted and On-premises), Type (Cloud security, Network security, End-point security, Application security , Others, and Application security), Application (BFSI, IT and telecommunications, Government and defense, Energy and utilities, and Others), Service Type (Retained incident response, Threat detection, Protective monitoring, and Others), and Geography (North America, Europe, APAC, South America, and Middle East and Africa)
-
-
Which regions are analyzed in the report?
-
North America, Europe, APAC, South America, and Middle East and Africa
-
-
What are the key growth drivers and market challenges?
-
Focus on outsourcing business-related tasks beyond an organizations competencies, Possibilities of failures during implementation
-
-
Who are the major players in the Managed Detection And Response Services Market?
-
Key Companies Arctic Wolf Networks Inc., Armor Defense Inc, Blackpoint Cyber, Booz Allen Hamilton Holding Corp., Broadcom Inc., Cisco Systems Inc., CrowdStrike Inc., Cybereason Inc, Cynet security Ltd, eSentire Inc., Fortinet Inc., International Business Machines Corp., Mandiant, Palo Alto Networks Inc., Rapid7 Inc., SENTINELONE INC., SecureWorks Inc., Sophos Ltd., Trend Micro Inc., and Trustwave Holdings Inc.
-
Market Research Insights
- The managed detection and response (MDR) services market encompasses a range of offerings designed to help businesses fortify their cybersecurity posture. Two key components of this market are security monitoring and threat detection. According to industry estimates, the global security monitoring market is projected to reach USD 73.18 billion by 2026. In contrast, the threat detection market is expected to reach USD 24.9 billion by 2023. These figures underscore the importance of MDR services in today's complex threat landscape, where businesses require continuous security monitoring and swift threat detection to minimize risk.
- MDR solutions encompass various aspects of cybersecurity, including log analysis, business continuity, security architecture, incident communication, data encryption, cybersecurity strategy, compliance management, threat hunting, vulnerability management, security awareness, security automation, disaster recovery, identity security, risk management, cloud security, network security, security assessment, threat intelligence, endpoint security, forensic investigation, and risk assessment. By providing comprehensive, proactive security services, MDR companies enable organizations to strengthen their cybersecurity stance and effectively manage risk.
We can help! Our analysts can customize this managed detection and response services market research report to meet your requirements.