Managed Services Market Analysis, Size, and Forecast 2026-2030: North America (US, Canada, and Mexico), Europe (Germany, UK, and France), APAC (China, Japan, and India), South America (Brazil and Argentina), Middle East and Africa (Saudi Arabia, UAE, and South Africa), and Rest of World (ROW)

Managed Services Market Analysis, Size, and Forecast 2026-2030:
North America (US, Canada, and Mexico), Europe (Germany, UK, and France), APAC (China, Japan, and India), South America (Brazil and Argentina), Middle East and Africa (Saudi Arabia, UAE, and South Africa), and Rest of World (ROW)

Published: May 2026 317 Pages SKU: IRTNTR71355

Market Overview at a Glance

$250.12 B
Market Opportunity
11.7%
CAGR 2025 - 2030
38.3%
North America Growth
$101.63 B
MDS segment 2024

Managed Services Market Size 2026-2030

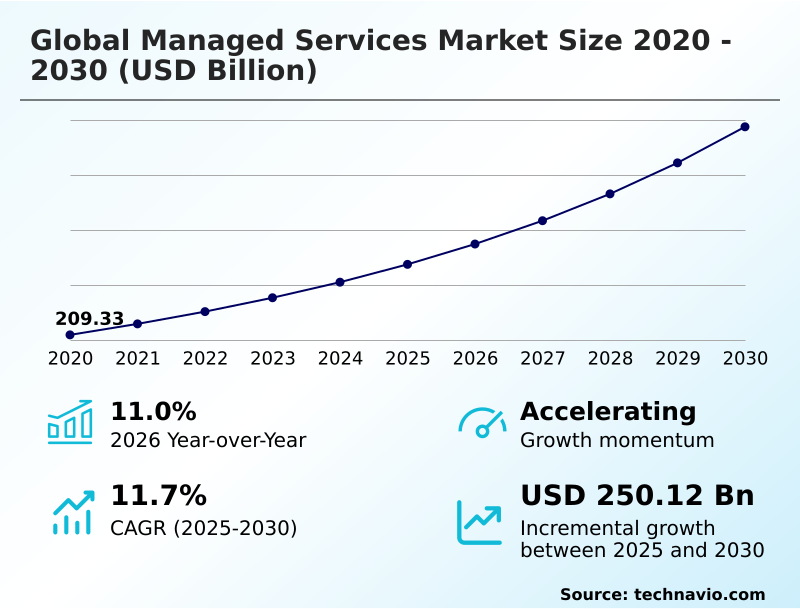
The managed services market size is valued to increase by USD 250.12 billion, at a CAGR of 11.7% from 2025 to 2030. Transition toward agentic AI and autonomous it service management orchestration will drive the managed services market.

Major Market Trends & Insights

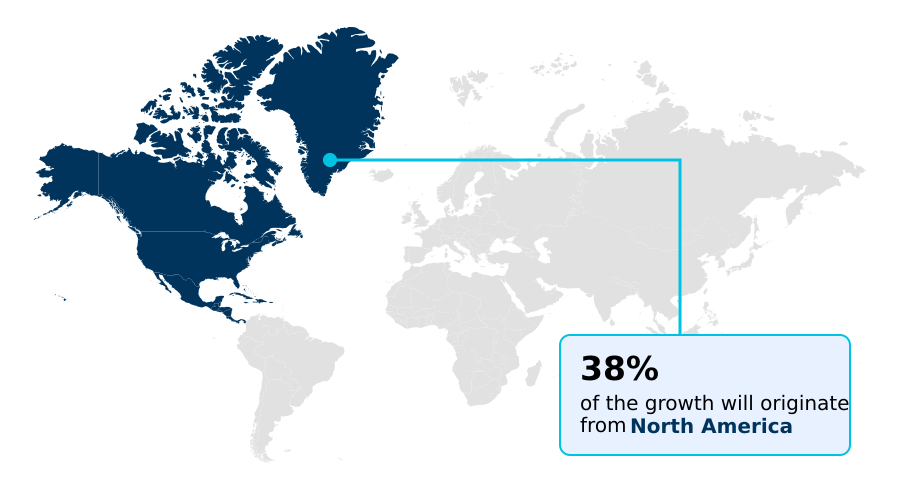
  • North America dominated the market and accounted for a 38.3% growth during the forecast period.
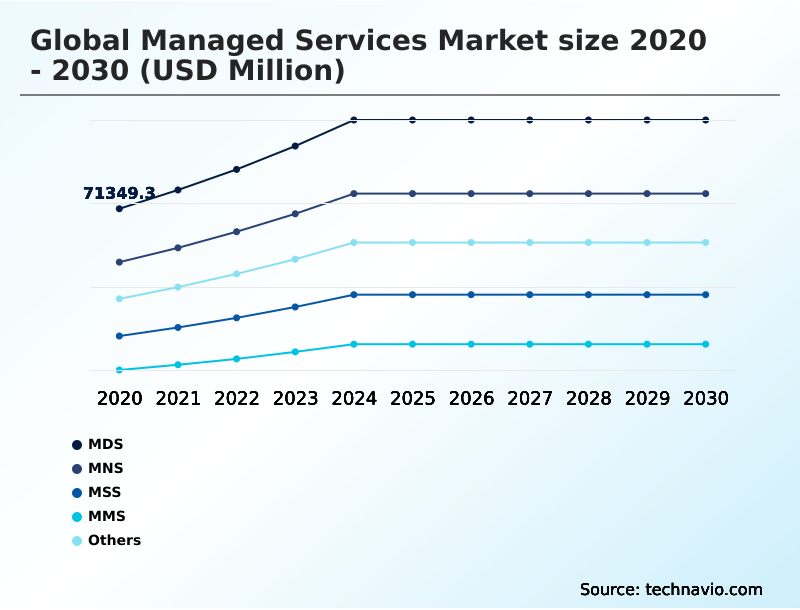
  • By Type - MDS segment was valued at USD 101.63 billion in 2024
  • By Deployment - Cloud segment accounted for the largest market revenue share in 2024

Market Size & Forecast

  • Market Opportunities: USD 378.31 billion
  • Market Future Opportunities: USD 250.12 billion
  • CAGR from 2025 to 2030 : 11.7%

Market Summary

  • The managed services market is undergoing a significant transformation, moving beyond reactive technical support to proactive, strategic partnerships focused on digital reinvention. This evolution is driven by the increasing complexity of enterprise IT, where multi-cloud architectures, cybersecurity monitoring, and the need for application modernization have surpassed the internal capacities of many organizations.
  • A key trend is the integration of AIOps and agentic AI, which utilize predictive analytics for autonomous remediation of system issues. For instance, in a manufacturing setting, a managed service can deploy a digital twin of a production line, using predictive analytics to foresee equipment failure and schedule maintenance without human intervention, thereby ensuring zero-downtime environments.
  • However, this shift introduces challenges, such as the need for specialized skills in prompt engineering and model governance, alongside the pressure to adopt value-based pricing models. The focus on digital sovereignty and sovereign cloud solutions is also reshaping service delivery, requiring providers to balance global scalability with local data compliance, especially within a zero trust architecture.
  • Consequently, providers are developing high-assurance environments to deliver on stringent service level agreements and support business continuity planning.

What will be the Size of the Managed Services Market during the forecast period?

Get Key Insights on Market Forecast (PDF) Get Free Sample

How is the Managed Services Market Segmented?

The managed services industry research report provides comprehensive data (region-wise segment analysis), with forecasts and estimates in "USD million" for the period 2026-2030, as well as historical data from 2020-2024 for the following segments.

  • Type
    • MDS
    • MNS
    • MSS
    • MMS
    • Others
  • Deployment
    • Cloud
    • On-premises
  • End-user
    • Large enterprises
    • SMEs
  • Geography
    • North America
      • US
      • Canada
      • Mexico
    • Europe
      • Germany
      • UK
      • France
    • APAC
      • China
      • Japan
      • India
    • South America
      • Brazil
      • Argentina
    • Middle East and Africa
      • Saudi Arabia
      • UAE
      • South Africa
    • Rest of World (ROW)

By Type Insights

The mds segment is estimated to witness significant growth during the forecast period.

The market for managed data center and IT infrastructure services is evolving from foundational computing and storage to strategic business enablement. Enterprises now leverage these services for complex application modernization and infrastructure orchestration in hybrid cloud environments.

This shift is driven by the adoption of AIOps for predictive analytics and autonomous remediation, which has been shown to improve incident detection accuracy by over 30%.

Managing these zero-downtime environments requires specialized oversight of physical servers and private cloud assets. As businesses adopt AI-native service delivery models, the demand for high-assurance environments with robust cybersecurity monitoring and business continuity planning is increasing.

The focus is now on delivering agentic service management that supports large-scale enterprise transformations, ensuring high availability and optimal performance for mission-critical digital operations.

Get Free Sample

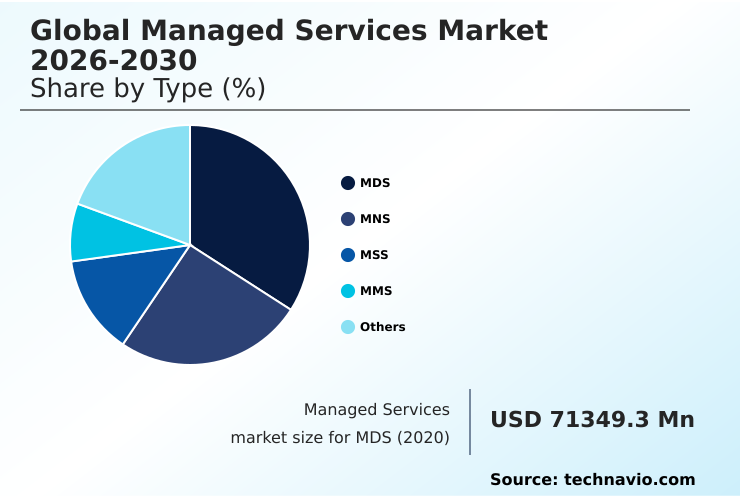
The MDS segment was valued at USD 101.63 billion in 2024 and showed a gradual increase during the forecast period.

Get Free Sample

Regional Analysis

North America is estimated to contribute 38.3% to the growth of the global market during the forecast period.Technavio’s analysts have elaborately explained the regional trends and drivers that shape the market during the forecast period.

See How Managed Services Market Demand is Rising in North America Get Free Sample

The geographic landscape of the managed services market is diverse, with North America leading in maturity and adoption, while the APAC region demonstrates the fastest growth trajectory.

North America's market, expanding at a rate nearly 5% higher than Europe's, is driven by advanced cloud-native adoption and high demand for managed detection and response services.

In Europe, the focus is sharply on digital sovereignty and compliance with strict data regulations, fostering a market for specialized sovereign cloud and SASE solutions.

The APAC region is characterized by a mobile-first approach, with emerging economies leapfrogging legacy systems, creating significant opportunities in edge computing and IT infrastructure management.

This regional variance necessitates that service providers tailor their strategies, addressing Europe's regulatory demands for high-assurance environments while catering to APAC's rapid scaling and mobile device management needs.

Market Dynamics

Our researchers analyzed the data with 2025 as the base year, along with the key drivers, trends, and challenges. A holistic analysis of drivers will help companies refine their marketing strategies to gain a competitive advantage.

  • The strategic evolution of enterprise IT hinges on the successful implementation of agentic AI for autonomous IT orchestration. This approach is fundamental to modernizing the network operations center, shifting from reactive problem-solving to proactive optimization through AIOps for predictive infrastructure maintenance.
  • As organizations scale, the complexity of managing multi-cloud FinOps strategies becomes a primary concern, necessitating a robust framework for cost control and resource allocation. This financial discipline must be paired with stringent security; consequently, implementing zero trust security in managed services is no longer optional but a baseline requirement for protecting distributed assets.
  • Furthermore, navigating the complex web of international regulations is driving demand for solutions that ensure sovereign cloud compliance for enterprises. To meet these demands, providers are focusing on global managed services market 2026-2030 platform integration and accelerating global managed services market 2026-2030 technology adoption.
  • Successful execution requires a cohesive global managed services market 2026-2030 system framework that promotes global managed services market 2026-2030 interoperability standards. Ultimately, the goal is comprehensive global managed services market 2026-2030 business process optimization, where firms leveraging a unified platform strategy achieve efficiency gains more than 30% greater than those with fragmented systems.

What are the key market drivers leading to the rise in the adoption of Managed Services Industry?

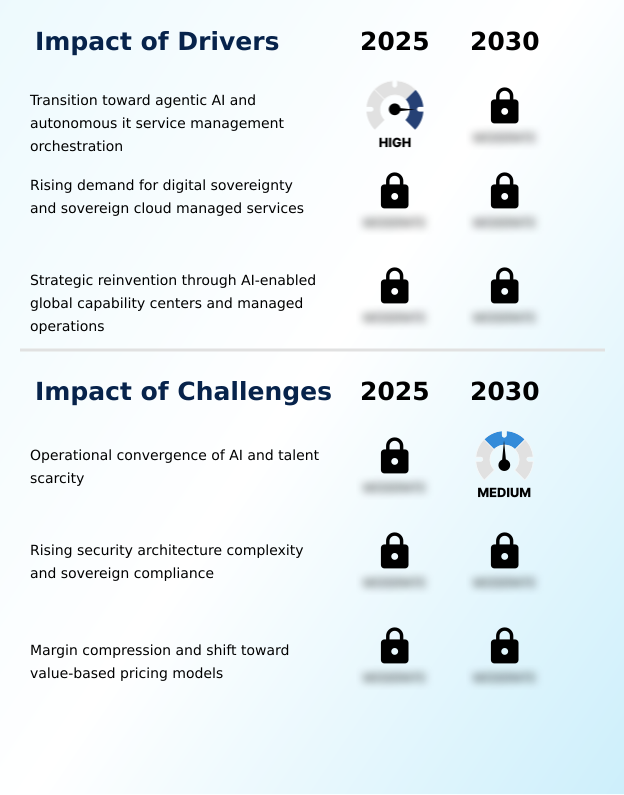
  • A key market driver is the transition toward agentic AI and autonomous IT service management orchestration.

  • Key market drivers are reshaping managed services from a cost-saving measure to a strategic enabler of business reinvention.
  • The foremost driver is the transition to agentic AI, which facilitates autonomous IT service management and improves operational efficiency by over 35% in complex hybrid cloud setups. This allows for compressed transformations within AI-enabled global capability centers.
  • A second major driver is the growing demand for digital sovereignty, pushing enterprises toward sovereign cloud solutions to ensure data residency and regulatory compliance. This is especially critical in high-assurance environments.
  • The third driver is the strategic use of managed services for business reinvention, where generative AI and digital twin technologies are leveraged to overhaul core processes, creating a more resilient and agile enterprise.

What are the market trends shaping the Managed Services Industry?

  • The integration of AI for IT operations is emerging as a significant market trend. This is driving a shift toward autonomous management capabilities.

  • The managed services market is increasingly shaped by intelligent automation and advanced security frameworks. A primary trend is the adoption of AIOps, which leverages machine learning for predictive analytics, enabling autonomous remediation and reducing mean time to resolution by up to 40%. This shift toward proactive management is critical in complex multi-cloud environments.
  • Concurrently, the rise of sophisticated cyber threats is accelerating the adoption of zero trust architecture and managed detection and response (MDR) services. Another key trend is the focus on cloud optimization through FinOps, where managed financial operations can reduce cloud expenditure by over 20%.
  • This financial discipline, combined with robust cybersecurity monitoring and support for everything-as-a-service models, defines the modern managed services landscape.

What challenges does the Managed Services Industry face during its growth?

  • A key challenge affecting industry growth is the operational convergence of AI, which is compounded by talent scarcity.

  • The managed services market faces significant challenges in its evolution toward AI-driven operations. A primary restraint is the convergence of advanced AI integration with a severe scarcity of talent skilled in prompt engineering and model governance, with reports indicating over half of organizations struggle to see AI ROI as a result.
  • Another major challenge is managing security complexity; implementing a consistent zero trust architecture across disparate multi-cloud and edge computing environments while adhering to sovereign cloud mandates creates significant operational overhead.
  • Lastly, the industry is experiencing intense margin pressure due to the client-driven shift toward outcome-driven commercial structures and value-based pricing models, forcing providers to invest heavily in proprietary platforms to maintain profitability.

Exclusive Technavio Analysis on Customer Landscape

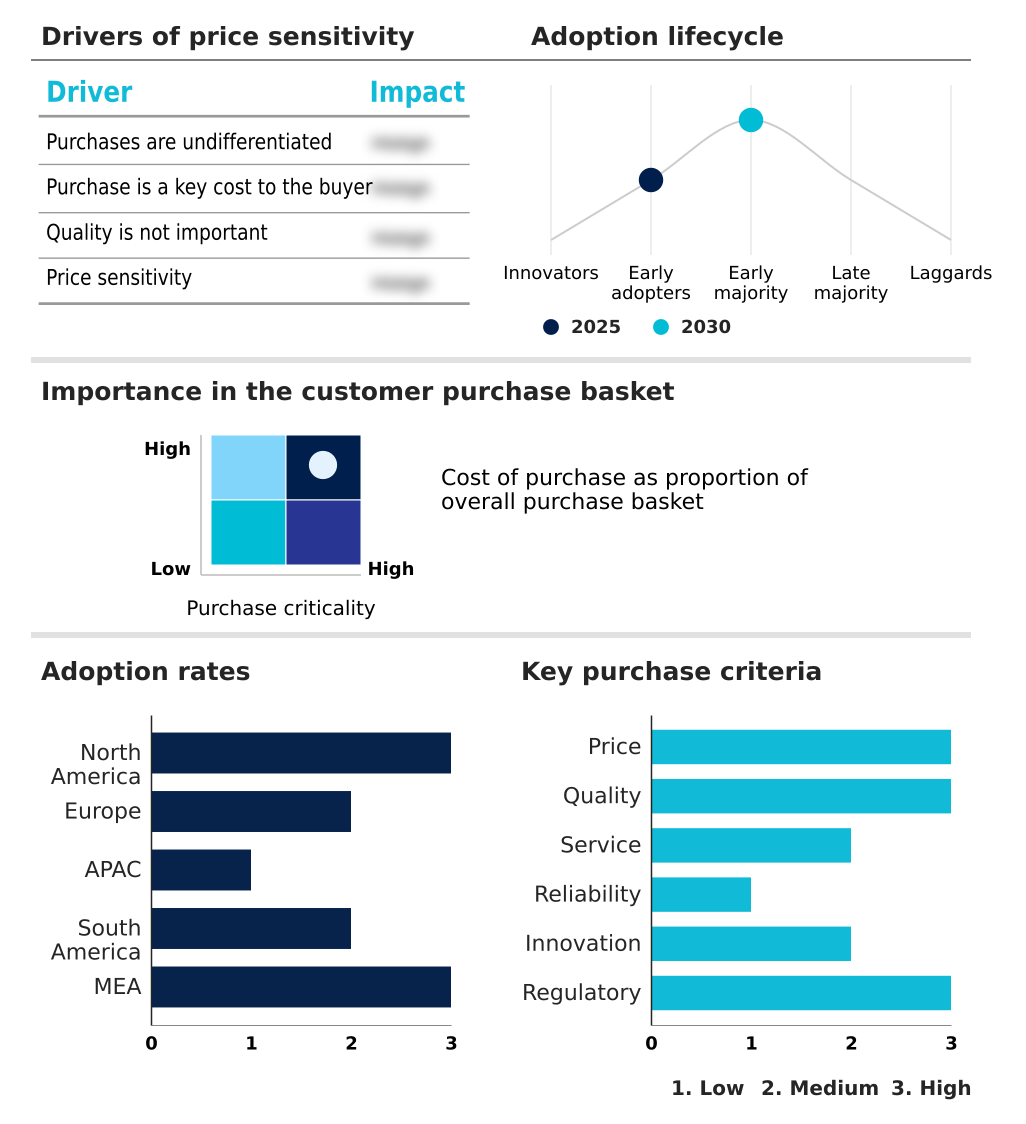
The managed services market forecasting report includes the adoption lifecycle of the market, covering from the innovator’s stage to the laggard’s stage. It focuses on adoption rates in different regions based on penetration. Furthermore, the managed services market report also includes key purchase criteria and drivers of price sensitivity to help companies evaluate and develop their market growth analysis strategies.

Customer Landscape of Managed Services Industry

Competitive Landscape

Companies are implementing various strategies, such as strategic alliances, managed services market forecast, partnerships, mergers and acquisitions, geographical expansion, and product/service launches, to enhance their presence in the industry.

Accenture Plc - Providers deliver application management and cybersecurity services, enabling businesses to fortify digital operations and optimize technology performance through specialized support.

The industry research and growth report includes detailed analyses of the competitive landscape of the market and information about key companies, including:

  • Accenture Plc
  • AT and T Inc.
  • Atos SE
  • Capgemini SE
  • CGI Inc.
  • Cognizant Technology Solution
  • DXC Technology Co.
  • Fujitsu Ltd.
  • HCL Technologies Ltd.
  • Hewlett Packard Enterprise Co.
  • IBM Corp.
  • Infosys Ltd.
  • Kyndryl Inc.
  • NTT DATA Corp.
  • Rackspace Technology Inc.
  • ScienceSoft USA Corp.
  • Tata Consultancy Services
  • Tech Mahindra Ltd.
  • Unisys Corp.
  • Wipro Ltd.

Qualitative and quantitative analysis of companies has been conducted to help clients understand the wider business environment as well as the strengths and weaknesses of key industry players. Data is qualitatively analyzed to categorize companies as pure play, category-focused, industry-focused, and diversified; it is quantitatively analyzed to categorize companies as dominant, leading, strong, tentative, and weak.

Recent Development and News in Managed services market

  • In June 2025, NWN Holdings announced the strategic acquisition of InterVision Systems to bolster its position in the AI-powered managed services sector, integrating advanced AWS-based artificial intelligence and customer experience solutions.
  • In March 2025, Globalgig introduced its Premier SSE Management solution, a managed Secure Service Edge platform built on Palo Alto Networks Prisma Access, combining 24/7 security operations center support with deep network intelligence.
  • In November 2025, Capgemini completed the acquisition of Cloud4C, a move aimed at enhancing its automation-driven and AI-enabled managed services, particularly for complex SAP migrations and enterprise cloud transformations.
  • In May 2026, IBM launched the general availability of IBM Sovereign Core, a software platform designed to help managed service clients build and operate AI-ready sovereign environments with verifiable control over data and infrastructure.

Dive into Technavio’s robust research methodology, blending expert interviews, extensive data synthesis, and validated models for unparalleled Managed Services Market insights. See full methodology.

Market Scope
Page number 317
Base year 2025
Historic period 2020-2024
Forecast period 2026-2030
Growth momentum & CAGR Accelerate at a CAGR of 11.7%
Market growth 2026-2030 USD 250121.1 million
Market structure Fragmented
YoY growth 2025-2026(%) 11.0%
Key countries US, Canada, Mexico, Germany, UK, France, Italy, Spain, The Netherlands, China, Japan, India, South Korea, Australia, Indonesia, Brazil, Argentina, Chile, Saudi Arabia, UAE, South Africa, Israel and Turkey
Competitive landscape Leading Companies, Market Positioning of Companies, Competitive Strategies, and Industry Risks

Request Free Sample

Research Analyst Overview

  • The managed services market is fundamentally reshaping enterprise operations by embedding intelligence into its core. The convergence of AIOps and agentic AI is enabling a transition from manual oversight to autonomous, self-healing systems.
  • Boardroom decisions are now heavily influenced by the need for digital sovereignty, compelling the adoption of sovereign cloud solutions and a stringent zero trust architecture to mitigate geopolitical and cyber risks. In this landscape, providers are leveraging generative AI and digital twin technologies for advanced application modernization and infrastructure orchestration across complex multi-cloud and edge computing environments.
  • Core offerings now center on proactive IT infrastructure management and continuous cybersecurity monitoring, with managed detection and response (MDR) and SASE becoming standard. Expertise in prompt engineering and model governance is a key differentiator.
  • The strategic application of predictive analytics within these frameworks has been shown to reduce critical system incidents by over 35%, solidifying the value of proactive, intelligence-driven managed services in achieving operational resilience and promoting workload rightsizing with a focus on endpoint protection and identity governance.

What are the Key Data Covered in this Managed Services Market Research and Growth Report?

  • What is the expected growth of the Managed Services Market between 2026 and 2030?

    • USD 250.12 billion, at a CAGR of 11.7%

  • What segmentation does the market report cover?

    • The report is segmented by Type (MDS, MNS, MSS, MMS, and Others), Deployment (Cloud, and On-premises), End-user (Large enterprises, and SMEs) and Geography (North America, Europe, APAC, South America, Middle East and Africa)

  • Which regions are analyzed in the report?

    • North America, Europe, APAC, South America and Middle East and Africa

  • What are the key growth drivers and market challenges?

    • Transition toward agentic AI and autonomous it service management orchestration, Operational convergence of AI and talent scarcity

  • Who are the major players in the Managed Services Market?

    • Accenture Plc, AT and T Inc., Atos SE, Capgemini SE, CGI Inc., Cognizant Technology Solution, DXC Technology Co., Fujitsu Ltd., HCL Technologies Ltd., Hewlett Packard Enterprise Co., IBM Corp., Infosys Ltd., Kyndryl Inc., NTT DATA Corp., Rackspace Technology Inc., ScienceSoft USA Corp., Tata Consultancy Services, Tech Mahindra Ltd., Unisys Corp. and Wipro Ltd.

Market Research Insights

  • The market is defined by a rapid shift toward intelligent automation and strategic value, with outcome-driven commercial structures replacing traditional contracts. This move toward AI-native service delivery is compelling providers to build AI-enabled global capability centers. Firms leveraging autonomous IT service management report up to a 40% reduction in mean time to resolution, demonstrating clear ROI.
  • Concurrently, the adoption of everything-as-a-service models supports business continuity planning and enhances financial flexibility. As enterprises undergo compressed transformations, the ability to deliver on service level agreements through advanced security information and event management and disaster recovery as a service is critical.
  • These dynamics show a market where FinOps-driven cloud optimization can reduce cloud spend by 25%, proving the tangible benefits of strategic managed partnerships.

We can help! Our analysts can customize this managed services market research report to meet your requirements.

Get in touch

1. Executive Summary

1.1 Market overview

Executive Summary - Chart on Market Overview
Executive Summary - Data Table on Market Overview
Executive Summary - Chart on Global Market Characteristics
Executive Summary - Chart on Market by Geography
Executive Summary - Chart on Market Segmentation by Type
Executive Summary - Chart on Market Segmentation by Deployment
Executive Summary - Chart on Market Segmentation by End-user
Executive Summary - Chart on Incremental Growth
Executive Summary - Data Table on Incremental Growth
Executive Summary - Chart on Company Market Positioning

2. Technavio Analysis

2.1 Analysis of price sensitivity, lifecycle, customer purchase basket, adoption rates, and purchase criteria

2.2 Criticality of inputs and Factors of differentiation

Chart on Overview on criticality of inputs and factors of differentiation

2.3 Factors of disruption

Chart on Overview on factors of disruption

2.4 Impact of drivers and challenges

Chart on Impact of drivers and challenges in 2025 and 2030

3. Market Landscape

3.1 Market ecosystem

Chart on Parent Market
Data Table on - Parent Market

3.2 Market characteristics

Chart on Market characteristics analysis

3.3 Value chain analysis

Chart on Value chain analysis

4. Market Sizing

4.1 Market definition

Data Table on Offerings of companies included in the market definition

4.2 Market segment analysis

Market segments

4.3 Market size 2025

4.4 Market outlook: Forecast for 2025-2030

Chart on Global - Market size and forecast 2025-2030 ($ million)
Data Table on Global - Market size and forecast 2025-2030 ($ million)
Chart on Global Market: Year-over-year growth 2025-2030 (%)
Data Table on Global Market: Year-over-year growth 2025-2030 (%)

5. Historic Market Size

5.1 Global Managed Services Market 2020 - 2024

Historic Market Size - Data Table on Global Managed Services Market 2020 - 2024 ($ million)

5.2 Type segment analysis 2020 - 2024

Historic Market Size - Type Segment 2020 - 2024 ($ million)

5.3 Deployment segment analysis 2020 - 2024

Historic Market Size - Deployment Segment 2020 - 2024 ($ million)

5.4 End-user segment analysis 2020 - 2024

Historic Market Size - End-user Segment 2020 - 2024 ($ million)

5.5 Geography segment analysis 2020 - 2024

Historic Market Size - Geography Segment 2020 - 2024 ($ million)

5.6 Country segment analysis 2020 - 2024

Historic Market Size - Country Segment 2020 - 2024 ($ million)

6. Qualitative Analysis

6.1 Impact of AI on global managed services market

6.2 Impact of geopolitical conflict on global managed services market

7. Five Forces Analysis

7.1 Five forces summary

Five forces analysis - Comparison between 2025 and 2030

7.2 Bargaining power of buyers

Bargaining power of buyers - Impact of key factors 2025 and 2030

7.3 Bargaining power of suppliers

Bargaining power of suppliers - Impact of key factors in 2025 and 2030

7.4 Threat of new entrants

Threat of new entrants - Impact of key factors in 2025 and 2030

7.5 Threat of substitutes

Threat of substitutes - Impact of key factors in 2025 and 2030

7.6 Threat of rivalry

Threat of rivalry - Impact of key factors in 2025 and 2030

7.7 Market condition

Chart on Market condition - Five forces 2025 and 2030

8. Market Segmentation by Type

8.1 Market segments

Chart on Type - Market share 2025-2030 (%)
Data Table on Type - Market share 2025-2030 (%)

8.2 Comparison by Type

Chart on Comparison by Type
Data Table on Comparison by Type

8.3 MDS - Market size and forecast 2025-2030

Chart on MDS - Market size and forecast 2025-2030 ($ million)
Data Table on MDS - Market size and forecast 2025-2030 ($ million)
Chart on MDS - Year-over-year growth 2025-2030 (%)
Data Table on MDS - Year-over-year growth 2025-2030 (%)

8.4 MNS - Market size and forecast 2025-2030

Chart on MNS - Market size and forecast 2025-2030 ($ million)
Data Table on MNS - Market size and forecast 2025-2030 ($ million)
Chart on MNS - Year-over-year growth 2025-2030 (%)
Data Table on MNS - Year-over-year growth 2025-2030 (%)

8.5 MSS - Market size and forecast 2025-2030

Chart on MSS - Market size and forecast 2025-2030 ($ million)
Data Table on MSS - Market size and forecast 2025-2030 ($ million)
Chart on MSS - Year-over-year growth 2025-2030 (%)
Data Table on MSS - Year-over-year growth 2025-2030 (%)

8.6 MMS - Market size and forecast 2025-2030

Chart on MMS - Market size and forecast 2025-2030 ($ million)
Data Table on MMS - Market size and forecast 2025-2030 ($ million)
Chart on MMS - Year-over-year growth 2025-2030 (%)
Data Table on MMS - Year-over-year growth 2025-2030 (%)

8.7 Others - Market size and forecast 2025-2030

Chart on Others - Market size and forecast 2025-2030 ($ million)
Data Table on Others - Market size and forecast 2025-2030 ($ million)
Chart on Others - Year-over-year growth 2025-2030 (%)
Data Table on Others - Year-over-year growth 2025-2030 (%)

8.8 Market opportunity by Type

Market opportunity by Type ($ million)
Data Table on Market opportunity by Type ($ million)

9. Market Segmentation by Deployment

9.1 Market segments

Chart on Deployment - Market share 2025-2030 (%)
Data Table on Deployment - Market share 2025-2030 (%)

9.2 Comparison by Deployment

Chart on Comparison by Deployment
Data Table on Comparison by Deployment

9.3 Cloud - Market size and forecast 2025-2030

Chart on Cloud - Market size and forecast 2025-2030 ($ million)
Data Table on Cloud - Market size and forecast 2025-2030 ($ million)
Chart on Cloud - Year-over-year growth 2025-2030 (%)
Data Table on Cloud - Year-over-year growth 2025-2030 (%)

9.4 On-premises - Market size and forecast 2025-2030

Chart on On-premises - Market size and forecast 2025-2030 ($ million)
Data Table on On-premises - Market size and forecast 2025-2030 ($ million)
Chart on On-premises - Year-over-year growth 2025-2030 (%)
Data Table on On-premises - Year-over-year growth 2025-2030 (%)

9.5 Market opportunity by Deployment

Market opportunity by Deployment ($ million)
Data Table on Market opportunity by Deployment ($ million)

10. Market Segmentation by End-user

10.1 Market segments

Chart on End-user - Market share 2025-2030 (%)
Data Table on End-user - Market share 2025-2030 (%)

10.2 Comparison by End-user

Chart on Comparison by End-user
Data Table on Comparison by End-user

10.3 Large enterprises - Market size and forecast 2025-2030

Chart on Large enterprises - Market size and forecast 2025-2030 ($ million)
Data Table on Large enterprises - Market size and forecast 2025-2030 ($ million)
Chart on Large enterprises - Year-over-year growth 2025-2030 (%)
Data Table on Large enterprises - Year-over-year growth 2025-2030 (%)

10.4 SMEs - Market size and forecast 2025-2030

Chart on SMEs - Market size and forecast 2025-2030 ($ million)
Data Table on SMEs - Market size and forecast 2025-2030 ($ million)
Chart on SMEs - Year-over-year growth 2025-2030 (%)
Data Table on SMEs - Year-over-year growth 2025-2030 (%)

10.5 Market opportunity by End-user

Market opportunity by End-user ($ million)
Data Table on Market opportunity by End-user ($ million)

11. Customer Landscape

11.1 Customer landscape overview

Analysis of price sensitivity, lifecycle, customer purchase basket, adoption rates, and purchase criteria

12. Geographic Landscape

12.1 Geographic segmentation

Chart on Market share by geography 2025-2030 (%)
Data Table on Market share by geography 2025-2030 (%)

12.2 Geographic comparison

Chart on Geographic comparison
Data Table on Geographic comparison

12.3 North America - Market size and forecast 2025-2030

Chart on North America - Market size and forecast 2025-2030 ($ million)
Data Table on North America - Market size and forecast 2025-2030 ($ million)
Chart on North America - Year-over-year growth 2025-2030 (%)
Data Table on North America - Year-over-year growth 2025-2030 (%)
Chart on Regional Comparison - North America
Data Table on Regional Comparison - North America

12.3.1 US - Market size and forecast 2025-2030

Chart on US - Market size and forecast 2025-2030 ($ million)
Data Table on US - Market size and forecast 2025-2030 ($ million)
Chart on US - Year-over-year growth 2025-2030 (%)
Data Table on US - Year-over-year growth 2025-2030 (%)

12.3.2 Canada - Market size and forecast 2025-2030

Chart on Canada - Market size and forecast 2025-2030 ($ million)
Data Table on Canada - Market size and forecast 2025-2030 ($ million)
Chart on Canada - Year-over-year growth 2025-2030 (%)
Data Table on Canada - Year-over-year growth 2025-2030 (%)

12.3.3 Mexico - Market size and forecast 2025-2030

Chart on Mexico - Market size and forecast 2025-2030 ($ million)
Data Table on Mexico - Market size and forecast 2025-2030 ($ million)
Chart on Mexico - Year-over-year growth 2025-2030 (%)
Data Table on Mexico - Year-over-year growth 2025-2030 (%)

12.4 Europe - Market size and forecast 2025-2030

Chart on Europe - Market size and forecast 2025-2030 ($ million)
Data Table on Europe - Market size and forecast 2025-2030 ($ million)
Chart on Europe - Year-over-year growth 2025-2030 (%)
Data Table on Europe - Year-over-year growth 2025-2030 (%)
Chart on Regional Comparison - Europe
Data Table on Regional Comparison - Europe

12.4.1 Germany - Market size and forecast 2025-2030

Chart on Germany - Market size and forecast 2025-2030 ($ million)
Data Table on Germany - Market size and forecast 2025-2030 ($ million)
Chart on Germany - Year-over-year growth 2025-2030 (%)
Data Table on Germany - Year-over-year growth 2025-2030 (%)

12.4.2 UK - Market size and forecast 2025-2030

Chart on UK - Market size and forecast 2025-2030 ($ million)
Data Table on UK - Market size and forecast 2025-2030 ($ million)
Chart on UK - Year-over-year growth 2025-2030 (%)
Data Table on UK - Year-over-year growth 2025-2030 (%)

12.4.3 France - Market size and forecast 2025-2030

Chart on France - Market size and forecast 2025-2030 ($ million)
Data Table on France - Market size and forecast 2025-2030 ($ million)
Chart on France - Year-over-year growth 2025-2030 (%)
Data Table on France - Year-over-year growth 2025-2030 (%)

12.4.4 Italy - Market size and forecast 2025-2030

Chart on Italy - Market size and forecast 2025-2030 ($ million)
Data Table on Italy - Market size and forecast 2025-2030 ($ million)
Chart on Italy - Year-over-year growth 2025-2030 (%)
Data Table on Italy - Year-over-year growth 2025-2030 (%)

12.4.5 Spain - Market size and forecast 2025-2030

Chart on Spain - Market size and forecast 2025-2030 ($ million)
Data Table on Spain - Market size and forecast 2025-2030 ($ million)
Chart on Spain - Year-over-year growth 2025-2030 (%)
Data Table on Spain - Year-over-year growth 2025-2030 (%)

12.4.6 The Netherlands - Market size and forecast 2025-2030

Chart on The Netherlands - Market size and forecast 2025-2030 ($ million)
Data Table on The Netherlands - Market size and forecast 2025-2030 ($ million)
Chart on The Netherlands - Year-over-year growth 2025-2030 (%)
Data Table on The Netherlands - Year-over-year growth 2025-2030 (%)

12.5 APAC - Market size and forecast 2025-2030

Chart on APAC - Market size and forecast 2025-2030 ($ million)
Data Table on APAC - Market size and forecast 2025-2030 ($ million)
Chart on APAC - Year-over-year growth 2025-2030 (%)
Data Table on APAC - Year-over-year growth 2025-2030 (%)
Chart on Regional Comparison - APAC
Data Table on Regional Comparison - APAC

12.5.1 China - Market size and forecast 2025-2030

Chart on China - Market size and forecast 2025-2030 ($ million)
Data Table on China - Market size and forecast 2025-2030 ($ million)
Chart on China - Year-over-year growth 2025-2030 (%)
Data Table on China - Year-over-year growth 2025-2030 (%)

12.5.2 Japan - Market size and forecast 2025-2030

Chart on Japan - Market size and forecast 2025-2030 ($ million)
Data Table on Japan - Market size and forecast 2025-2030 ($ million)
Chart on Japan - Year-over-year growth 2025-2030 (%)
Data Table on Japan - Year-over-year growth 2025-2030 (%)

12.5.3 India - Market size and forecast 2025-2030

Chart on India - Market size and forecast 2025-2030 ($ million)
Data Table on India - Market size and forecast 2025-2030 ($ million)
Chart on India - Year-over-year growth 2025-2030 (%)
Data Table on India - Year-over-year growth 2025-2030 (%)

12.5.4 South Korea - Market size and forecast 2025-2030

Chart on South Korea - Market size and forecast 2025-2030 ($ million)
Data Table on South Korea - Market size and forecast 2025-2030 ($ million)
Chart on South Korea - Year-over-year growth 2025-2030 (%)
Data Table on South Korea - Year-over-year growth 2025-2030 (%)

12.5.5 Australia - Market size and forecast 2025-2030

Chart on Australia - Market size and forecast 2025-2030 ($ million)
Data Table on Australia - Market size and forecast 2025-2030 ($ million)
Chart on Australia - Year-over-year growth 2025-2030 (%)
Data Table on Australia - Year-over-year growth 2025-2030 (%)

12.5.6 Indonesia - Market size and forecast 2025-2030

Chart on Indonesia - Market size and forecast 2025-2030 ($ million)
Data Table on Indonesia - Market size and forecast 2025-2030 ($ million)
Chart on Indonesia - Year-over-year growth 2025-2030 (%)
Data Table on Indonesia - Year-over-year growth 2025-2030 (%)

12.6 South America - Market size and forecast 2025-2030

Chart on South America - Market size and forecast 2025-2030 ($ million)
Data Table on South America - Market size and forecast 2025-2030 ($ million)
Chart on South America - Year-over-year growth 2025-2030 (%)
Data Table on South America - Year-over-year growth 2025-2030 (%)
Chart on Regional Comparison - South America
Data Table on Regional Comparison - South America

12.6.1 Brazil - Market size and forecast 2025-2030

Chart on Brazil - Market size and forecast 2025-2030 ($ million)
Data Table on Brazil - Market size and forecast 2025-2030 ($ million)
Chart on Brazil - Year-over-year growth 2025-2030 (%)
Data Table on Brazil - Year-over-year growth 2025-2030 (%)

12.6.2 Argentina - Market size and forecast 2025-2030

Chart on Argentina - Market size and forecast 2025-2030 ($ million)
Data Table on Argentina - Market size and forecast 2025-2030 ($ million)
Chart on Argentina - Year-over-year growth 2025-2030 (%)
Data Table on Argentina - Year-over-year growth 2025-2030 (%)

12.6.3 Chile - Market size and forecast 2025-2030

Chart on Chile - Market size and forecast 2025-2030 ($ million)
Data Table on Chile - Market size and forecast 2025-2030 ($ million)
Chart on Chile - Year-over-year growth 2025-2030 (%)
Data Table on Chile - Year-over-year growth 2025-2030 (%)

12.7 Middle East and Africa - Market size and forecast 2025-2030

Chart on Middle East and Africa - Market size and forecast 2025-2030 ($ million)
Data Table on Middle East and Africa - Market size and forecast 2025-2030 ($ million)
Chart on Middle East and Africa - Year-over-year growth 2025-2030 (%)
Data Table on Middle East and Africa - Year-over-year growth 2025-2030 (%)
Chart on Regional Comparison - Middle East and Africa
Data Table on Regional Comparison - Middle East and Africa

12.7.1 Saudi Arabia - Market size and forecast 2025-2030

Chart on Saudi Arabia - Market size and forecast 2025-2030 ($ million)
Data Table on Saudi Arabia - Market size and forecast 2025-2030 ($ million)
Chart on Saudi Arabia - Year-over-year growth 2025-2030 (%)
Data Table on Saudi Arabia - Year-over-year growth 2025-2030 (%)

12.7.2 UAE - Market size and forecast 2025-2030

Chart on UAE - Market size and forecast 2025-2030 ($ million)
Data Table on UAE - Market size and forecast 2025-2030 ($ million)
Chart on UAE - Year-over-year growth 2025-2030 (%)
Data Table on UAE - Year-over-year growth 2025-2030 (%)

12.7.3 South Africa - Market size and forecast 2025-2030

Chart on South Africa - Market size and forecast 2025-2030 ($ million)
Data Table on South Africa - Market size and forecast 2025-2030 ($ million)
Chart on South Africa - Year-over-year growth 2025-2030 (%)
Data Table on South Africa - Year-over-year growth 2025-2030 (%)

12.7.4 Israel - Market size and forecast 2025-2030

Chart on Israel - Market size and forecast 2025-2030 ($ million)
Data Table on Israel - Market size and forecast 2025-2030 ($ million)
Chart on Israel - Year-over-year growth 2025-2030 (%)
Data Table on Israel - Year-over-year growth 2025-2030 (%)

12.7.5 Turkey - Market size and forecast 2025-2030

Chart on Turkey - Market size and forecast 2025-2030 ($ million)
Data Table on Turkey - Market size and forecast 2025-2030 ($ million)
Chart on Turkey - Year-over-year growth 2025-2030 (%)
Data Table on Turkey - Year-over-year growth 2025-2030 (%)

12.8 Market opportunity by geography

Market opportunity by geography ($ million)
Data Tables on Market opportunity by geography ($ million)

13. Drivers, Challenges, and Opportunity

13.1 Market drivers

Transition toward agentic AI and autonomous it service management orchestration
Rising demand for digital sovereignty and sovereign cloud managed services
Strategic reinvention through AI-enabled global capability centers and managed operations

13.2 Market challenges

Operational convergence of AI and talent scarcity
Rising security architecture complexity and sovereign compliance
Margin compression and shift toward value-based pricing models

13.3 Impact of drivers and challenges

Impact of drivers and challenges in 2025 and 2030

13.4 Market opportunities

Integration of AI for IT operations and autonomous management
Evolution of managed detection and response and zero trust security frameworks
Acceleration of cloud optimization and finops-driven managed services

14. Competitive Landscape

14.1 Overview

14.2

Overview on criticality of inputs and factors of differentiation

14.3 Landscape disruption

Overview on factors of disruption

14.4 Industry risks

Impact of key risks on business

15. Competitive Analysis

15.1 Companies profiled

Companies covered

15.2 Company ranking index

15.3 Market positioning of companies

Matrix on companies position and classification

15.4 Accenture Plc

Accenture Plc - Overview
Accenture Plc - Business segments
Accenture Plc - Key news
Accenture Plc - Key offerings
Accenture Plc - Segment focus
SWOT

15.5 Atos SE

Atos SE - Overview
Atos SE - Business segments
Atos SE - Key offerings
Atos SE - Segment focus
SWOT

15.6 Capgemini SE

Capgemini SE - Overview
Capgemini SE - Business segments
Capgemini SE - Key news
Capgemini SE - Key offerings
Capgemini SE - Segment focus
SWOT

15.7 CGI Inc.

CGI Inc. - Overview
CGI Inc. - Business segments
CGI Inc. - Key offerings
CGI Inc. - Segment focus
SWOT

15.8 Cognizant Technology Solution

Cognizant Technology Solution - Overview
Cognizant Technology Solution - Business segments
Cognizant Technology Solution - Key news
Cognizant Technology Solution - Key offerings
Cognizant Technology Solution - Segment focus
SWOT

15.9 DXC Technology Co.

DXC Technology Co. - Overview
DXC Technology Co. - Business segments
DXC Technology Co. - Key news
DXC Technology Co. - Key offerings
DXC Technology Co. - Segment focus
SWOT

15.10 Fujitsu Ltd.

Fujitsu Ltd. - Overview
Fujitsu Ltd. - Business segments
Fujitsu Ltd. - Key offerings
Fujitsu Ltd. - Segment focus
SWOT

15.11 HCL Technologies Ltd.

HCL Technologies Ltd. - Overview
HCL Technologies Ltd. - Business segments
HCL Technologies Ltd. - Key news
HCL Technologies Ltd. - Key offerings
HCL Technologies Ltd. - Segment focus
SWOT

15.12 IBM Corp.

IBM Corp. - Overview
IBM Corp. - Business segments
IBM Corp. - Key news
IBM Corp. - Key offerings
IBM Corp. - Segment focus
SWOT

15.13 Infosys Ltd.

Infosys Ltd. - Overview
Infosys Ltd. - Business segments
Infosys Ltd. - Key news
Infosys Ltd. - Key offerings
Infosys Ltd. - Segment focus
SWOT

15.14 Kyndryl Inc.

Kyndryl Inc. - Overview
Kyndryl Inc. - Business segments
Kyndryl Inc. - Key offerings
Kyndryl Inc. - Segment focus
SWOT

15.15 NTT DATA Corp.

NTT DATA Corp. - Overview
NTT DATA Corp. - Business segments
NTT DATA Corp. - Key offerings
NTT DATA Corp. - Segment focus
SWOT

15.16 Tata Consultancy Services

Tata Consultancy Services - Overview
Tata Consultancy Services - Business segments
Tata Consultancy Services - Key offerings
Tata Consultancy Services - Segment focus
SWOT

15.17 Tech Mahindra Ltd.

Tech Mahindra Ltd. - Overview
Tech Mahindra Ltd. - Business segments
Tech Mahindra Ltd. - Key offerings
Tech Mahindra Ltd. - Segment focus
SWOT

15.18 Wipro Ltd.

Wipro Ltd. - Overview
Wipro Ltd. - Business segments
Wipro Ltd. - Key news
Wipro Ltd. - Key offerings
Wipro Ltd. - Segment focus
SWOT

16. Appendix

16.1 Scope of the report

Market definition
Objectives
Notes and caveats

16.2 Inclusions and exclusions checklist

Inclusions checklist
Exclusions checklist

16.3 Currency conversion rates for US$

16.4 Research methodology

16.5 Data procurement

Information sources

16.6 Data validation

16.7 Validation techniques employed for market sizing

16.8 Data synthesis

16.9 360 degree market analysis

16.10 List of abbreviations

Research Methodology

Technavio presents a detailed picture of the market by way of study, synthesis, and summation of data from multiple sources. The analysts have presented the various facets of the market with a particular focus on identifying the key industry influencers. The data thus presented is comprehensive, reliable, and the result of extensive research, both primary and secondary.

INFORMATION SOURCES

Primary sources

  • Manufacturers and suppliers
  • Channel partners
  • Industry experts
  • Strategic decision makers

Secondary sources

  • Industry journals and periodicals
  • Government data
  • Financial reports of key industry players
  • Historical data
  • Press releases

DATA ANALYSIS

Data Synthesis

  • Collation of data
  • Estimation of key figures
  • Analysis of derived insights

Data Validation

  • Triangulation with data models
  • Reference against proprietary databases
  • Corroboration with industry experts

REPORT WRITING

Qualitative

  • Market drivers
  • Market challenges
  • Market trends
  • Five forces analysis

Quantitative

  • Market size and forecast
  • Market segmentation
  • Geographical insights
  • Competitive landscape

Interested in this report?

Get your sample now to see our research methodology and insights!

Download Now

Frequently Asked Questions

Managed Services market growth will increase by USD 250121.1 million during 2026-2030.

The Managed Services market is expected to grow at a CAGR of 11.7% during 2026-2030.

Managed Services market is segmented by Type (MDS, MNS, MSS, MMS, Others) Deployment (Cloud, On-premises) End-user (Large enterprises, SMEs)

Accenture Plc, AT and T Inc., Atos SE, Capgemini SE, CGI Inc., Cognizant Technology Solution, DXC Technology Co., Fujitsu Ltd., HCL Technologies Ltd., Hewlett Packard Enterprise Co., IBM Corp., Infosys Ltd., Kyndryl Inc., NTT DATA Corp., Rackspace Technology Inc., ScienceSoft USA Corp., Tata Consultancy Services, Tech Mahindra Ltd., Unisys Corp., Wipro Ltd. are a few of the key vendors in the Managed Services market.

North America will register the highest growth rate of 38.3% among the other regions. Therefore, the Managed Services market in North America is expected to garner significant business opportunities for the vendors during the forecast period.

US, Canada, Mexico, Germany, UK, France, Italy, Spain, The Netherlands, China, Japan, India, South Korea, Australia, Indonesia, Brazil, Argentina, Chile, Saudi Arabia, UAE, South Africa, Israel, Turkey

  • Transition toward agentic AI and autonomous it service management orchestration is the driving factor this market.

The Managed Services market vendors should focus on grabbing business opportunities from the Type segment as it accounted for the largest market share in the base year.
RIA - Research AI Assistant
Ask RIA