Manganese Mining Market Analysis, Size, and Forecast 2026-2030: APAC (Australia, India, and China), Europe (Czech Republic, Norway, and Hungary), Middle East and Africa (South Africa, Ghana, and Israel), North America (Mexico, Canada, and US), South America (Brazil, Chile, and Argentina), and Rest of World (ROW)

Manganese Mining Market Analysis, Size, and Forecast 2026-2030:
APAC (Australia, India, and China), Europe (Czech Republic, Norway, and Hungary), Middle East and Africa (South Africa, Ghana, and Israel), North America (Mexico, Canada, and US), South America (Brazil, Chile, and Argentina), and Rest of World (ROW)

Published: Oct 2026 310 Pages SKU: IRTNTR41126

Market Overview at a Glance

$12.17 B
Market Opportunity
6.7%
CAGR 2025 - 2030
69.1%
APAC Growth
$26.66 B
Alloys segment 2024

Manganese Mining Market Size 2026-2030

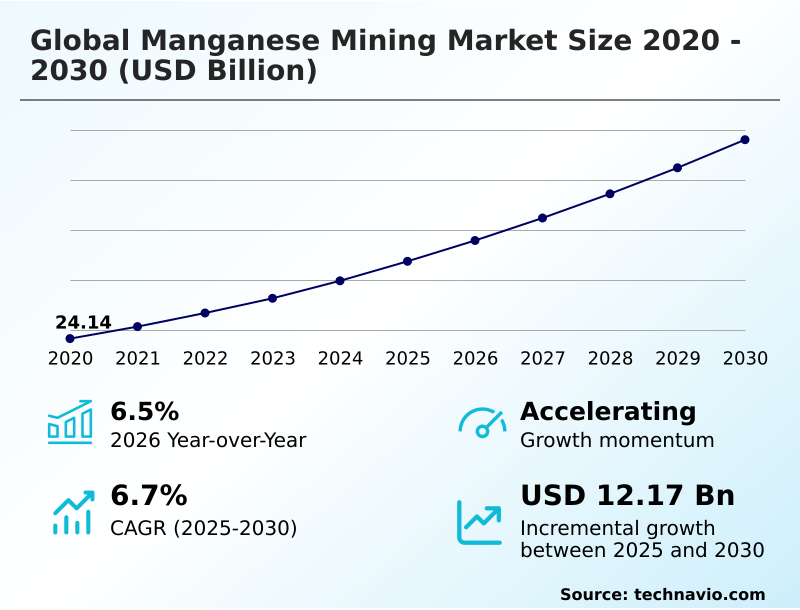
The manganese mining market size is valued to increase by USD 12.17 billion, at a CAGR of 6.7% from 2025 to 2030. Exponential growth of electric vehicle battery supply chain and cathode chemistry innovation will drive the manganese mining market.

Major Market Trends & Insights

  • APAC dominated the market and accounted for a 69.1% growth during the forecast period.
  • By Application - Alloys segment was valued at USD 26.66 billion in 2024
  • By Type - Braunite segment accounted for the largest market revenue share in 2024

Market Size & Forecast

  • Market Opportunities: USD 19.89 billion
  • Market Future Opportunities: USD 12.17 billion
  • CAGR from 2025 to 2030 : 6.7%

Market Summary

  • The Manganese Mining Market functions as an indispensable foundational pillar for both traditional metallurgy and advanced energy transition technologies. Industrial facilities increasingly rely on highly refined mineral outputs to fortify structural materials and synthesize complex chemical precursors.
  • In a practical supply chain scenario, automakers integrating localized mineral procurement strategies to secure battery cathode supplies have achieved a 20% reduction in logistical delays compared to relying on fragmented offshore merchant networks.
  • This Manganese Mining Market is primarily propelled by the exponential expansion of the electric mobility sector, where continuous innovations in cathode chemistry demand vast volumes of high-purity chemical feedstock to satisfy clean energy targets. Conversely, operational scalability remains constrained by severe logistical bottlenecks across remote extraction zones, which disrupt bulk ore transit and elevate freight expenditures.
  • To navigate these complexities, extraction enterprises are investing in automated beneficiation systems and adopting stringent sustainability frameworks to minimize environmental liabilities. These strategic adaptations ensure that resource developers can meet escalating downstream consumption while complying with increasingly rigorous regulatory mandates governing mineral supply chains.

What will be the Size of the Manganese Mining Market during the forecast period?
Get Key Insights on Market Forecast (PDF) Get Free Sample

How is the Manganese Mining Market Segmented?

The manganese mining industry research report provides comprehensive data (region-wise segment analysis), with forecasts and estimates in "USD million" for the period 2026-2030, as well as historical data from 2020-2024 for the following segments.

  • Application
    • Alloys
    • Steel and battery production
  • Type
    • Braunite
    • Pyrolusite
    • Psilomelane
    • Rhodochrosite
  • End-user
    • Construction
    • Automotive
    • Energy
    • Electronics
    • Others
  • Geography
    • APAC
      • Australia
      • India
      • China
      • Malaysia
      • Japan
      • Indonesia
    • Europe
      • Czech Republic
      • Norway
      • Hungary
      • Spain
      • Romania
    • Middle East and Africa
      • South Africa
      • Ghana
      • Israel
      • Morocco
    • North America
      • Mexico
      • Canada
      • US
    • South America
      • Brazil
      • Chile
      • Argentina

By Application Insights

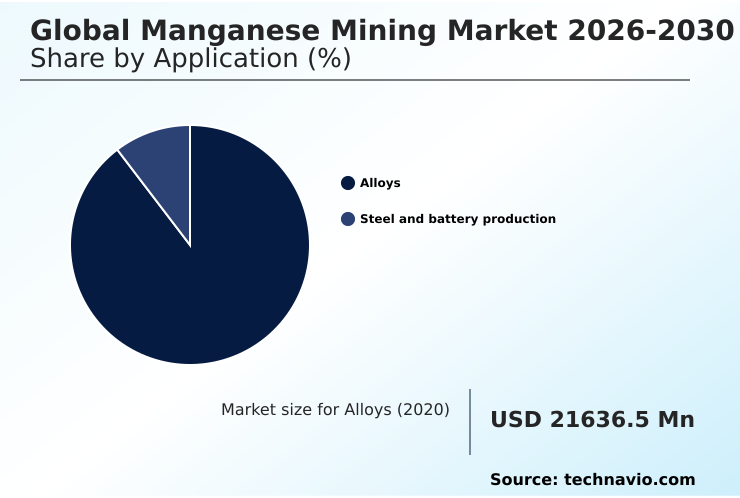
The alloys segment is estimated to witness significant growth during the forecast period.

The Alloys segment fundamentally dictates the metallurgical consumption patterns within the Manganese Mining sector, bridging raw extraction to finished industrial materials.

Smelters rely heavily on metallurgical grade lump to drive silicomanganese alloy production and formulate high carbon ferromanganese for heavy infrastructure.

Operating a submerged arc furnace with optimized feedstocks has proven to reduce energy consumption, where thermal efficiency improved by 15% through precision blending.

Beyond conventional steelmaking, processed derivatives serve as a critical battery grade precursor for electric vehicles and a soft magnetic ferrite core in telecommunications equipment.

By modernizing these alloying techniques, industrial facilities reduce slag generation by 10% and ensure robust supply lines for diverse fabrication networks. This structural adaptability allows the segment to continuously align with volatile manufacturing demands.
Get Free Sample

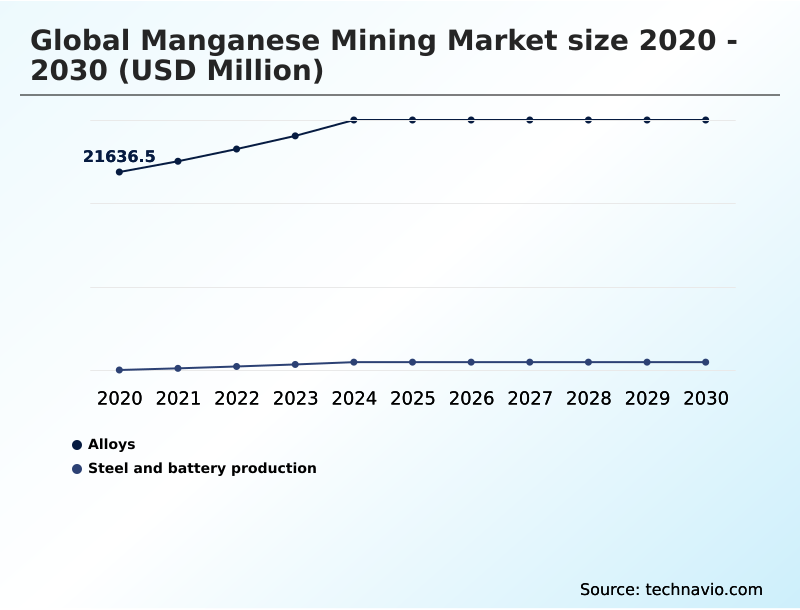
The Alloys segment was valued at USD 26.66 billion in 2024 and showed a gradual increase during the forecast period.
Get Free Sample

Regional Analysis

APAC is estimated to contribute 69.1% to the growth of the global market during the forecast period.Technavio’s analysts have elaborately explained the regional trends and drivers that shape the market during the forecast period.
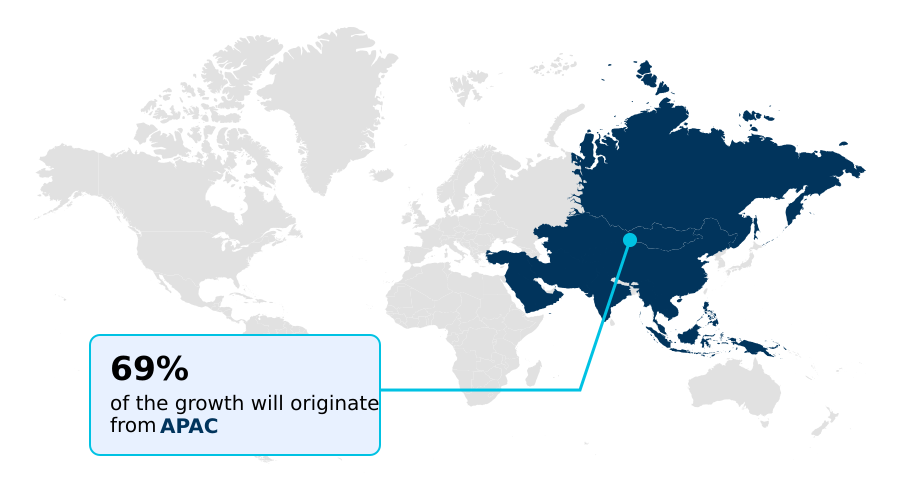
See How Manganese Mining Market Demand is Rising in APAC Get Free Sample

The geographic landscape of the Manganese Mining sector highlights distinct regional processing disparities driven by localized industrial demands and infrastructure maturity.

Operations in APAC maintain a commanding lead in processing volume, boasting a 40% higher throughput in electrolytic manganese metal production compared to emerging facilities in North America.

This divergence stems from APAC's advanced integration of continuous mining machinery and robust oxide ore beneficiation networks.

In contrast, North American developers are aggressively prioritizing local battery supply chains, achieving a 25% improvement in calcination thermal efficiency for high purity manganese sulfate generation.

To support this transition, facilities deploy rigorous mineralogical grade assessment protocols to validate ore quality before chemical conversion.

These localized processing innovations allow regional refiners to lower reagent consumption by 15%, securing a vital competitive edge in the evolving clean energy materials ecosystem.

Market Dynamics

Our researchers analyzed the data with 2025 as the base year, along with the key drivers, trends, and challenges. A holistic analysis of drivers will help companies refine their marketing strategies to gain a competitive advantage.

  • The strategic maturation of the Manganese Mining landscape reflects a deep integration of advanced mineralogy and precise chemical engineering to satisfy rigorous downstream performance criteria. Industrial operators are increasingly evaluating processing metrics to extend mine life and secure reliable baseload volumes.
  • For instance, facilities optimizing the dense media separation recovery rate have realized a 12% operational yield improvement over traditional gravity concentration methods, significantly bolstering supply chain predictability. In the realm of traditional metallurgy, enhancing submerged arc furnace thermal efficiency remains critical for minimizing energy outlays, ensuring that heavy infrastructure materials meet stringent tensile strength requirements without compromising cost margins.
  • Simultaneously, the energy transition necessitates rigorous adaptation in chemical processing. The deployment of a sophisticated high purity sulfate conversion process is indispensable for modern lithium ion cathode material synthesis. This is especially vital as automakers rely heavily on pristine chemical feedstocks to achieve optimal energy density in next-generation electric vehicles.
  • Operationally, the integration of sensor based automated ore sorting drastically reduces waste generation at the pithead. This systematic waste reduction ensures strict environmental compliance while maintaining product integrity that aligns with global distribution standards, thereby insulating mining enterprises from external supply shocks.
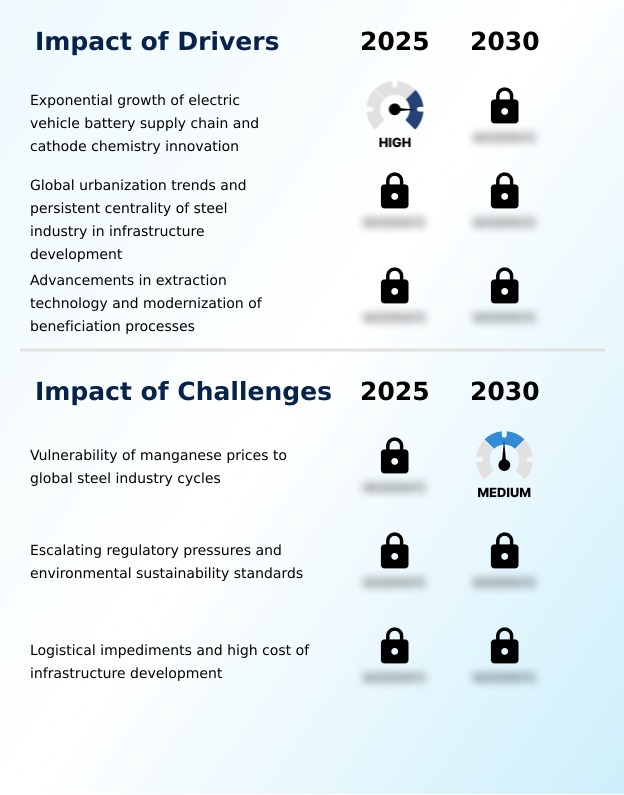
What are the key market drivers leading to the rise in the adoption of Manganese Mining Industry?

  • The exponential expansion of the electric vehicle battery supply chain, coupled with continuous cathode chemistry innovation, serves as a primary catalyst for accelerated resource extraction and processing demand.

  • The relentless expansion of infrastructure development and diversified chemical applications acts as a powerful catalyst for the Manganese Mining sector.
  • Because emerging economies require immense volumes of durable construction materials, the demand for raw ore processed via advanced dense media separation has accelerated. By upgrading extraction circuits, operators have improved ore recovery rates by 18%, significantly lowering per-ton processing costs.
  • Furthermore, the integration of specific gravity separation minimizes waste, boosting overall beneficiation efficiency by 15%. This high-yield output directly feeds the pyrometallurgical smelting technique to support heavy industry, while the hydrometallurgical extraction process isolates pure compounds for specialized uses.
  • Additionally, adopting circular waste reprocessing yields secondary fractions that supply the production of the agricultural micronutrient fertilizer. These diverse downstream applications ensure robust, uninterrupted revenue generation for integrated mining enterprises.

What are the market trends shaping the Manganese Mining Industry?

  • A strategic shift toward vertical integration and high-purity chemical refining characterizes the evolving operational landscape. This transition enables extraction entities to capture greater downstream value while satisfying stringent industrial specifications.

  • A transformative shift toward sustainable operations and advanced materials fundamentally redefines the Manganese Mining landscape. Because automotive manufacturers demand efficient energy density, the rapid adoption of lithium ion cathode chemistry has surged. This transition compels mining companies to implement renewable power integration to circumvent escalating fossil fuel tariffs and comply with stringent carbon border adjustment frameworks.
  • By adopting zero pollution discharge protocols, facilities have successfully reduced environmental penalty liabilities by 30%. Furthermore, preserving traditional metallurgical outputs remains vital; innovations in blast furnace desulfurization ensure that the primary steel deoxidizing agent is produced with 20% less energy waste.
  • These advancements expand revenue streams, ensuring that resource developers maintain robust profitability while actively insulating their operations against volatile commodity cycles.

What challenges does the Manganese Mining Industry face during its growth?

  • The vulnerability of raw material pricing to the cyclical fluctuations of the international steel industry poses a significant operational constraint on long-term capital investment and revenue stability.

  • Severe logistical constraints and escalating environmental compliance costs impose substantial operational limitations on the Manganese Mining sector. Because declining ore qualities require processing massive volumes of waste rock, facilities utilizing open-pit methods struggle with deteriorating margins. To counter these limitations, operators are forced into costly stripping ratio optimization, which has nonetheless increased overburden removal expenses by 20%.
  • Similarly, implementing underground haulage automation and sensor based ore sorting demands steep upfront capital, temporarily suppressing liquidity. Furthermore, the transition toward a closed loop water circuit and the mandatory adoption of dry stack tailings to manage ecological liabilities has elevated beneficiation costs by 15%.
  • Although these systems mitigate risk, the fragility of fine ore briquetting during lengthy transit continues to degrade product quality, hampering overall supply chain resilience and global distribution efficiency.

Exclusive Technavio Analysis on Customer Landscape

The manganese mining market forecasting report includes the adoption lifecycle of the market, covering from the innovator’s stage to the laggard’s stage. It focuses on adoption rates in different regions based on penetration. Furthermore, the manganese mining market report also includes key purchase criteria and drivers of price sensitivity to help companies evaluate and develop their market growth analysis strategies.
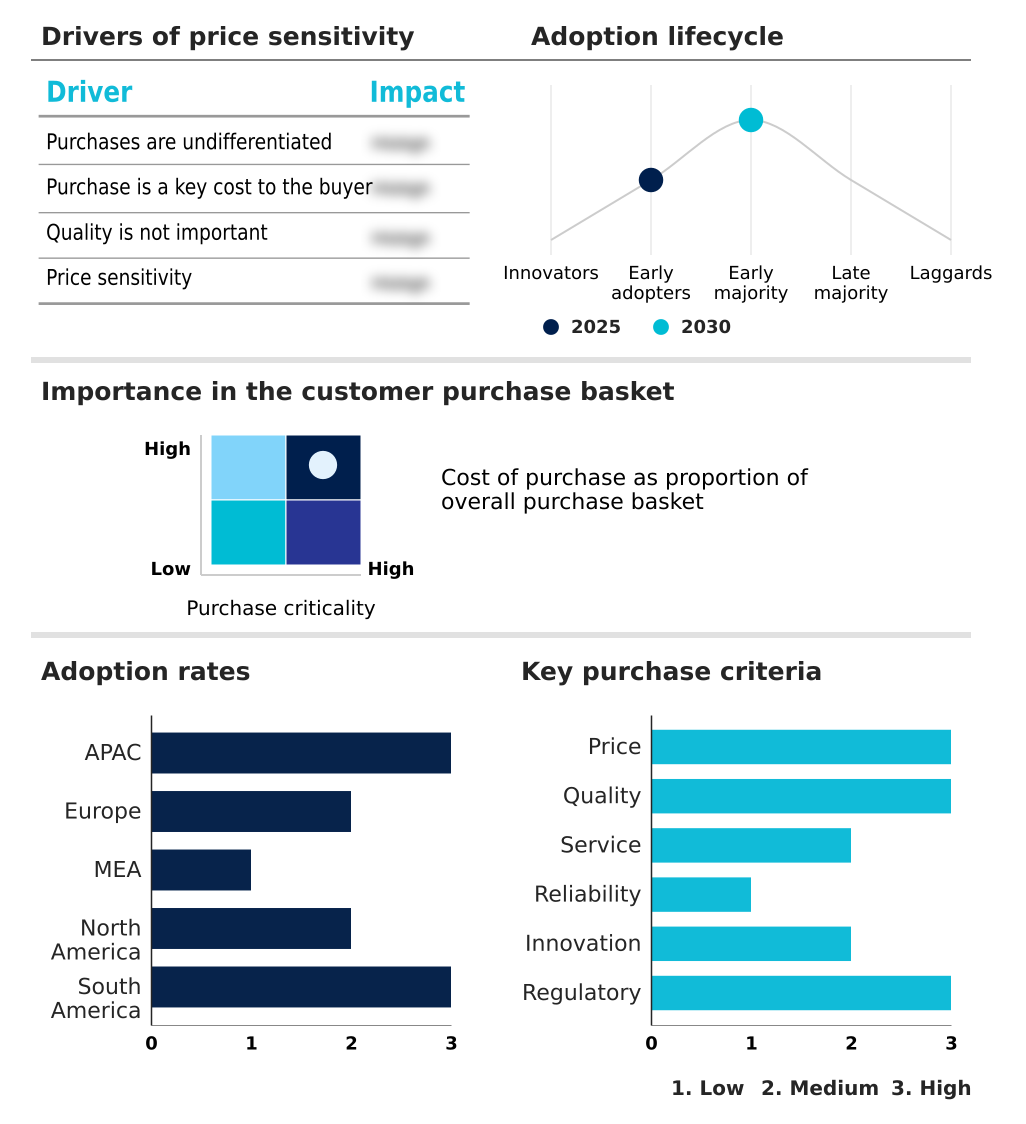
Customer Landscape of Manganese Mining Industry

Competitive Landscape

Companies are implementing various strategies, such as strategic alliances, manganese mining market forecast, partnerships, mergers and acquisitions, geographical expansion, and product/service launches, to enhance their presence in the industry.

Anglo American plc - The enterprise provides comprehensive mineral extraction solutions, focusing on open-pit excavation, advanced ore processing, and the delivery of high-grade metallurgical products essential for industrial steelmaking and structural fabrication applications.

The industry research and growth report includes detailed analyses of the competitive landscape of the market and information about key companies, including:

  • Anglo American plc
  • Baridi Group Ltd.
  • BnG Mining Group LLC
  • Compania Minera Autlan S.A.B.
  • Consolidated Minerals Ltd.
  • Eramet SA
  • Ghana Manganese Co Ltd
  • J and F Mineracao Ltda
  • Jupiter Mines Ltd
  • Kalagadi Manganese
  • Kudumane Manganese Resources
  • Maithan Alloys Ltd.
  • MOIL LTD
  • Ntsimbintle Holdings Proprietary
  • OM Holdings Ltd.
  • Sarda Energy and Minerals Ltd
  • South Manganese Investment Ltd
  • Tata Steel Ltd.
  • Tshipi e Ntle Manganese Mining
  • United Manganese of Kalahari

Qualitative and quantitative analysis of companies has been conducted to help clients understand the wider business environment as well as the strengths and weaknesses of key industry players. Data is qualitatively analyzed to categorize companies as pure play, category-focused, industry-focused, and diversified; it is quantitatively analyzed to categorize companies as dominant, leading, strong, tentative, and weak.

Recent Development and News in Manganese mining market

  • In the Diversified Metals and Mining industry, the implementation of the carbon border adjustment enforced strict emission thresholds on imported metallurgical goods, directly impacting Manganese Mining demand by accelerating the transition toward low-carbon beneficiation circuits and reducing smelting energy consumption by up to 18%.
  • The widespread adoption of circular waste reprocessing frameworks for end-of-life electric vehicle batteries diverted substantial critical mineral volumes back into the supply chain, directly impacting Manganese Mining demand by offsetting primary ore extraction requirements for cathode precursors by nearly 12%.
  • The rapid deployment of continuous mining machinery and remote-controlled haulage fleets across deep-shaft operations minimized hazardous exposure, directly impacting Manganese Mining supply by increasing underground ore recovery rates by 22% in structurally complex geological formations.
  • The enforcement of zero pollution discharge mandates on tailing storage facilities compelled operators to implement advanced filtration technologies, directly impacting Manganese Mining supply by mandating a 30% reduction in raw water consumption during heavy media separation processes.

Dive into Technavio’s robust research methodology, blending expert interviews, extensive data synthesis, and validated models for unparalleled Manganese Mining Market insights. See full methodology.

Market Scope
Page number 310
Base year 2025
Historic period 2020-2024
Forecast period 2026-2030
Growth momentum & CAGR Accelerate at a CAGR of 6.7%
Market growth 2026-2030 USD 12165.3 million
Market structure Fragmented
YoY growth 2025-2026(%) 6.5%
Key countries Australia, India, China, Malaysia, Japan, Indonesia, Ukraine, Czech Republic, Norway, Hungary, Spain, Romania, South Africa, Gabon, Ghana, Israel, Morocco, Mexico, Canada, US, Brazil, Chile and Argentina
Competitive landscape Leading Companies, Market Positioning of Companies, Competitive Strategies, and Industry Risks

Request Free Sample

Research Analyst Overview

  • The continuous evolution of the Manganese Mining sector illustrates a pivotal pivot toward high-efficiency resource extraction and rigorous environmental stewardship. Strategic decision-making across boardrooms is increasingly dictated by the necessity to comply with stringent sustainability mandates while preserving product yield.
  • For example, extraction facilities optimizing oxide ore beneficiation have documented a 35% reduction in total freshwater consumption, dramatically mitigating exposure to regional water scarcity risks. Concurrently, the modernization of the submerged arc furnace has allowed operators to streamline silicomanganese alloy production and scale high carbon ferromanganese output, thereby securing a steady supply for heavy industry.
  • To further combat declining ore grades, mining enterprises are actively scaling their chemical processing lines, generating premium electrolytic manganese metal and high purity manganese sulfate for advanced manufacturing sectors. These targeted operational upgrades ensure that producers maintain robust margins and uninterrupted supply chain continuity amid fluctuating macroeconomic conditions.

What are the Key Data Covered in this Manganese Mining Market Research and Growth Report?

  • What is the expected growth of the Manganese Mining Market between 2026 and 2030?

    • USD 12.17 billion, at a CAGR of 6.7%

  • What segmentation does the market report cover?

    • The report is segmented by Application (Alloys, and Steel and battery production), Type (Braunite, Pyrolusite, Psilomelane, and Rhodochrosite), End-user (Construction, Automotive, Energy, Electronics, and Others) and Geography (APAC, Europe, Middle East and Africa, North America, South America)

  • Which regions are analyzed in the report?

    • APAC, Europe, Middle East and Africa, North America and South America

  • What are the key growth drivers and market challenges?

    • Exponential growth of electric vehicle battery supply chain and cathode chemistry innovation, Vulnerability of manganese prices to global steel industry cycles

  • Who are the major players in the Manganese Mining Market?

    • Anglo American plc, Baridi Group Ltd., BnG Mining Group LLC, Compania Minera Autlan S.A.B., Consolidated Minerals Ltd., Eramet SA, Ghana Manganese Co Ltd, J and F Mineracao Ltda, Jupiter Mines Ltd, Kalagadi Manganese, Kudumane Manganese Resources, Maithan Alloys Ltd., MOIL LTD, Ntsimbintle Holdings Proprietary, OM Holdings Ltd., Sarda Energy and Minerals Ltd, South Manganese Investment Ltd, Tata Steel Ltd., Tshipi e Ntle Manganese Mining and United Manganese of Kalahari

Market Research Insights

  • The Manganese Mining Market demonstrates robust operational evolution as extraction enterprises pivot toward efficiency and precision. By deploying underground haulage automation, operators have increased material handling throughput by 24% while simultaneously enhancing workplace safety. Furthermore, the implementation of rigorous mineralogical grade assessment protocols has elevated downstream recovery yields by 15% compared to legacy sorting methods.
  • Extraction operations now utilize stripping ratio optimization to lower overburden removal costs by nearly 18%. Additionally, facilities incorporating fine ore briquetting have reduced material degradation during heavy transit by 20%, ensuring that smelters receive premium feedstocks. These technological adoptions directly translate into tangible cost reductions, reinforcing the strategic importance of modernized processing infrastructure.

We can help! Our analysts can customize this manganese mining market research report to meet your requirements.

Get in touch

1. Executive Summary

1.1 Market overview

Executive Summary - Chart on Market Overview
Executive Summary - Data Table on Market Overview
Executive Summary - Chart on Global Market Characteristics
Executive Summary - Chart on Market by Geography
Executive Summary - Chart on Market Segmentation by Application
Executive Summary - Chart on Market Segmentation by Type
Executive Summary - Chart on Market Segmentation by End-user
Executive Summary - Chart on Incremental Growth
Executive Summary - Data Table on Incremental Growth
Executive Summary - Chart on Company Market Positioning

2. Technavio Analysis

2.1 Analysis of price sensitivity, lifecycle, customer purchase basket, adoption rates, and purchase criteria

2.2 Criticality of inputs and Factors of differentiation

Chart on Overview on criticality of inputs and factors of differentiation

2.3 Factors of disruption

Chart on Overview on factors of disruption

2.4 Impact of drivers and challenges

Chart on Impact of drivers and challenges in 2025 and 2030

3. Market Landscape

3.1 Market ecosystem

Chart on Parent Market
Data Table on - Parent Market

3.2 Market characteristics

Chart on Market characteristics analysis

3.3 Value chain analysis

Chart on Value chain analysis

4. Market Sizing

4.1 Market definition

Data Table on Offerings of companies included in the market definition

4.2 Market segment analysis

Market segments

4.3 Market size 2025

4.4 Market outlook: Forecast for 2025-2030

Chart on Global - Market size and forecast 2025-2030 ($ million)
Data Table on Global - Market size and forecast 2025-2030 ($ million)
Chart on Global Market: Year-over-year growth 2025-2030 (%)
Data Table on Global Market: Year-over-year growth 2025-2030 (%)

5. Historic Market Size

5.1 Global Manganese Mining Market 2020 - 2024

Historic Market Size - Data Table on Global Manganese Mining Market 2020 - 2024 ($ million)

5.2 Application segment analysis 2020 - 2024

Historic Market Size - Application Segment 2020 - 2024 ($ million)

5.3 Type segment analysis 2020 - 2024

Historic Market Size - Type Segment 2020 - 2024 ($ million)

5.4 End-user segment analysis 2020 - 2024

Historic Market Size - End-user Segment 2020 - 2024 ($ million)

5.5 Geography segment analysis 2020 - 2024

Historic Market Size - Geography Segment 2020 - 2024 ($ million)

5.6 Country segment analysis 2020 - 2024

Historic Market Size - Country Segment 2020 - 2024 ($ million)

6. Qualitative Analysis

6.1 Impact of AI on Global Manganese Mining Market

6.2 Impact of Geopolitical Conflicts on Global Manganese Mining Market

7. Five Forces Analysis

7.1 Five forces summary

Five forces analysis - Comparison between 2025 and 2030

7.2 Bargaining power of buyers

Bargaining power of buyers - Impact of key factors 2025 and 2030

7.3 Bargaining power of suppliers

Bargaining power of suppliers - Impact of key factors in 2025 and 2030

7.4 Threat of new entrants

Threat of new entrants - Impact of key factors in 2025 and 2030

7.5 Threat of substitutes

Threat of substitutes - Impact of key factors in 2025 and 2030

7.6 Threat of rivalry

Threat of rivalry - Impact of key factors in 2025 and 2030

7.7 Market condition

Chart on Market condition - Five forces 2025 and 2030

8. Market Segmentation by Application

8.1 Market segments

Chart on Application - Market share 2025-2030 (%)
Data Table on Application - Market share 2025-2030 (%)

8.2 Comparison by Application

Chart on Comparison by Application
Data Table on Comparison by Application

8.3 Alloys - Market size and forecast 2025-2030

Chart on Alloys - Market size and forecast 2025-2030 ($ million)
Data Table on Alloys - Market size and forecast 2025-2030 ($ million)
Chart on Alloys - Year-over-year growth 2025-2030 (%)
Data Table on Alloys - Year-over-year growth 2025-2030 (%)

8.4 Steel and battery production - Market size and forecast 2025-2030

Chart on Steel and battery production - Market size and forecast 2025-2030 ($ million)
Data Table on Steel and battery production - Market size and forecast 2025-2030 ($ million)
Chart on Steel and battery production - Year-over-year growth 2025-2030 (%)
Data Table on Steel and battery production - Year-over-year growth 2025-2030 (%)

8.5 Market opportunity by Application

Market opportunity by Application ($ million)
Data Table on Market opportunity by Application ($ million)

9. Market Segmentation by Type

9.1 Market segments

Chart on Type - Market share 2025-2030 (%)
Data Table on Type - Market share 2025-2030 (%)

9.2 Comparison by Type

Chart on Comparison by Type
Data Table on Comparison by Type

9.3 Braunite - Market size and forecast 2025-2030

Chart on Braunite - Market size and forecast 2025-2030 ($ million)
Data Table on Braunite - Market size and forecast 2025-2030 ($ million)
Chart on Braunite - Year-over-year growth 2025-2030 (%)
Data Table on Braunite - Year-over-year growth 2025-2030 (%)

9.4 Pyrolusite - Market size and forecast 2025-2030

Chart on Pyrolusite - Market size and forecast 2025-2030 ($ million)
Data Table on Pyrolusite - Market size and forecast 2025-2030 ($ million)
Chart on Pyrolusite - Year-over-year growth 2025-2030 (%)
Data Table on Pyrolusite - Year-over-year growth 2025-2030 (%)

9.5 Psilomelane - Market size and forecast 2025-2030

Chart on Psilomelane - Market size and forecast 2025-2030 ($ million)
Data Table on Psilomelane - Market size and forecast 2025-2030 ($ million)
Chart on Psilomelane - Year-over-year growth 2025-2030 (%)
Data Table on Psilomelane - Year-over-year growth 2025-2030 (%)

9.6 Rhodochrosite - Market size and forecast 2025-2030

Chart on Rhodochrosite - Market size and forecast 2025-2030 ($ million)
Data Table on Rhodochrosite - Market size and forecast 2025-2030 ($ million)
Chart on Rhodochrosite - Year-over-year growth 2025-2030 (%)
Data Table on Rhodochrosite - Year-over-year growth 2025-2030 (%)

9.7 Market opportunity by Type

Market opportunity by Type ($ million)
Data Table on Market opportunity by Type ($ million)

10. Market Segmentation by End-user

10.1 Market segments

Chart on End-user - Market share 2025-2030 (%)
Data Table on End-user - Market share 2025-2030 (%)

10.2 Comparison by End-user

Chart on Comparison by End-user
Data Table on Comparison by End-user

10.3 Construction - Market size and forecast 2025-2030

Chart on Construction - Market size and forecast 2025-2030 ($ million)
Data Table on Construction - Market size and forecast 2025-2030 ($ million)
Chart on Construction - Year-over-year growth 2025-2030 (%)
Data Table on Construction - Year-over-year growth 2025-2030 (%)

10.4 Automotive - Market size and forecast 2025-2030

Chart on Automotive - Market size and forecast 2025-2030 ($ million)
Data Table on Automotive - Market size and forecast 2025-2030 ($ million)
Chart on Automotive - Year-over-year growth 2025-2030 (%)
Data Table on Automotive - Year-over-year growth 2025-2030 (%)

10.5 Energy - Market size and forecast 2025-2030

Chart on Energy - Market size and forecast 2025-2030 ($ million)
Data Table on Energy - Market size and forecast 2025-2030 ($ million)
Chart on Energy - Year-over-year growth 2025-2030 (%)
Data Table on Energy - Year-over-year growth 2025-2030 (%)

10.6 Electronics - Market size and forecast 2025-2030

Chart on Electronics - Market size and forecast 2025-2030 ($ million)
Data Table on Electronics - Market size and forecast 2025-2030 ($ million)
Chart on Electronics - Year-over-year growth 2025-2030 (%)
Data Table on Electronics - Year-over-year growth 2025-2030 (%)

10.7 Others - Market size and forecast 2025-2030

Chart on Others - Market size and forecast 2025-2030 ($ million)
Data Table on Others - Market size and forecast 2025-2030 ($ million)
Chart on Others - Year-over-year growth 2025-2030 (%)
Data Table on Others - Year-over-year growth 2025-2030 (%)

10.8 Market opportunity by End-user

Market opportunity by End-user ($ million)
Data Table on Market opportunity by End-user ($ million)

11. Customer Landscape

11.1 Customer landscape overview

Analysis of price sensitivity, lifecycle, customer purchase basket, adoption rates, and purchase criteria

12. Geographic Landscape

12.1 Geographic segmentation

Chart on Market share by geography 2025-2030 (%)
Data Table on Market share by geography 2025-2030 (%)

12.2 Geographic comparison

Chart on Geographic comparison
Data Table on Geographic comparison

12.3 APAC - Market size and forecast 2025-2030

Chart on APAC - Market size and forecast 2025-2030 ($ million)
Data Table on APAC - Market size and forecast 2025-2030 ($ million)
Chart on APAC - Year-over-year growth 2025-2030 (%)
Data Table on APAC - Year-over-year growth 2025-2030 (%)
Chart on Regional Comparison - APAC
Data Table on Regional Comparison - APAC

12.3.1 Australia - Market size and forecast 2025-2030

Chart on Australia - Market size and forecast 2025-2030 ($ million)
Data Table on Australia - Market size and forecast 2025-2030 ($ million)
Chart on Australia - Year-over-year growth 2025-2030 (%)
Data Table on Australia - Year-over-year growth 2025-2030 (%)

12.3.2 India - Market size and forecast 2025-2030

Chart on India - Market size and forecast 2025-2030 ($ million)
Data Table on India - Market size and forecast 2025-2030 ($ million)
Chart on India - Year-over-year growth 2025-2030 (%)
Data Table on India - Year-over-year growth 2025-2030 (%)

12.3.3 China - Market size and forecast 2025-2030

Chart on China - Market size and forecast 2025-2030 ($ million)
Data Table on China - Market size and forecast 2025-2030 ($ million)
Chart on China - Year-over-year growth 2025-2030 (%)
Data Table on China - Year-over-year growth 2025-2030 (%)

12.3.4 Malaysia - Market size and forecast 2025-2030

Chart on Malaysia - Market size and forecast 2025-2030 ($ million)
Data Table on Malaysia - Market size and forecast 2025-2030 ($ million)
Chart on Malaysia - Year-over-year growth 2025-2030 (%)
Data Table on Malaysia - Year-over-year growth 2025-2030 (%)

12.3.5 Japan - Market size and forecast 2025-2030

Chart on Japan - Market size and forecast 2025-2030 ($ million)
Data Table on Japan - Market size and forecast 2025-2030 ($ million)
Chart on Japan - Year-over-year growth 2025-2030 (%)
Data Table on Japan - Year-over-year growth 2025-2030 (%)

12.3.6 Indonesia - Market size and forecast 2025-2030

Chart on Indonesia - Market size and forecast 2025-2030 ($ million)
Data Table on Indonesia - Market size and forecast 2025-2030 ($ million)
Chart on Indonesia - Year-over-year growth 2025-2030 (%)
Data Table on Indonesia - Year-over-year growth 2025-2030 (%)

12.4 Europe - Market size and forecast 2025-2030

Chart on Europe - Market size and forecast 2025-2030 ($ million)
Data Table on Europe - Market size and forecast 2025-2030 ($ million)
Chart on Europe - Year-over-year growth 2025-2030 (%)
Data Table on Europe - Year-over-year growth 2025-2030 (%)
Chart on Regional Comparison - Europe
Data Table on Regional Comparison - Europe

12.4.1 Ukraine - Market size and forecast 2025-2030

Chart on Ukraine - Market size and forecast 2025-2030 ($ million)
Data Table on Ukraine - Market size and forecast 2025-2030 ($ million)
Chart on Ukraine - Year-over-year growth 2025-2030 (%)
Data Table on Ukraine - Year-over-year growth 2025-2030 (%)

12.4.2 Czech Republic - Market size and forecast 2025-2030

Chart on Czech Republic - Market size and forecast 2025-2030 ($ million)
Data Table on Czech Republic - Market size and forecast 2025-2030 ($ million)
Chart on Czech Republic - Year-over-year growth 2025-2030 (%)
Data Table on Czech Republic - Year-over-year growth 2025-2030 (%)

12.4.3 Norway - Market size and forecast 2025-2030

Chart on Norway - Market size and forecast 2025-2030 ($ million)
Data Table on Norway - Market size and forecast 2025-2030 ($ million)
Chart on Norway - Year-over-year growth 2025-2030 (%)
Data Table on Norway - Year-over-year growth 2025-2030 (%)

12.4.4 Hungary - Market size and forecast 2025-2030

Chart on Hungary - Market size and forecast 2025-2030 ($ million)
Data Table on Hungary - Market size and forecast 2025-2030 ($ million)
Chart on Hungary - Year-over-year growth 2025-2030 (%)
Data Table on Hungary - Year-over-year growth 2025-2030 (%)

12.4.5 Spain - Market size and forecast 2025-2030

Chart on Spain - Market size and forecast 2025-2030 ($ million)
Data Table on Spain - Market size and forecast 2025-2030 ($ million)
Chart on Spain - Year-over-year growth 2025-2030 (%)
Data Table on Spain - Year-over-year growth 2025-2030 (%)

12.4.6 Romania - Market size and forecast 2025-2030

Chart on Romania - Market size and forecast 2025-2030 ($ million)
Data Table on Romania - Market size and forecast 2025-2030 ($ million)
Chart on Romania - Year-over-year growth 2025-2030 (%)
Data Table on Romania - Year-over-year growth 2025-2030 (%)

12.5 Middle East and Africa - Market size and forecast 2025-2030

Chart on Middle East and Africa - Market size and forecast 2025-2030 ($ million)
Data Table on Middle East and Africa - Market size and forecast 2025-2030 ($ million)
Chart on Middle East and Africa - Year-over-year growth 2025-2030 (%)
Data Table on Middle East and Africa - Year-over-year growth 2025-2030 (%)
Chart on Regional Comparison - Middle East and Africa
Data Table on Regional Comparison - Middle East and Africa

12.5.1 South Africa - Market size and forecast 2025-2030

Chart on South Africa - Market size and forecast 2025-2030 ($ million)
Data Table on South Africa - Market size and forecast 2025-2030 ($ million)
Chart on South Africa - Year-over-year growth 2025-2030 (%)
Data Table on South Africa - Year-over-year growth 2025-2030 (%)

12.5.2 Gabon - Market size and forecast 2025-2030

Chart on Gabon - Market size and forecast 2025-2030 ($ million)
Data Table on Gabon - Market size and forecast 2025-2030 ($ million)
Chart on Gabon - Year-over-year growth 2025-2030 (%)
Data Table on Gabon - Year-over-year growth 2025-2030 (%)

12.5.3 Ghana - Market size and forecast 2025-2030

Chart on Ghana - Market size and forecast 2025-2030 ($ million)
Data Table on Ghana - Market size and forecast 2025-2030 ($ million)
Chart on Ghana - Year-over-year growth 2025-2030 (%)
Data Table on Ghana - Year-over-year growth 2025-2030 (%)

12.5.4 Israel - Market size and forecast 2025-2030

Chart on Israel - Market size and forecast 2025-2030 ($ million)
Data Table on Israel - Market size and forecast 2025-2030 ($ million)
Chart on Israel - Year-over-year growth 2025-2030 (%)
Data Table on Israel - Year-over-year growth 2025-2030 (%)

12.5.5 Morocco - Market size and forecast 2025-2030

Chart on Morocco - Market size and forecast 2025-2030 ($ million)
Data Table on Morocco - Market size and forecast 2025-2030 ($ million)
Chart on Morocco - Year-over-year growth 2025-2030 (%)
Data Table on Morocco - Year-over-year growth 2025-2030 (%)

12.6 North America - Market size and forecast 2025-2030

Chart on North America - Market size and forecast 2025-2030 ($ million)
Data Table on North America - Market size and forecast 2025-2030 ($ million)
Chart on North America - Year-over-year growth 2025-2030 (%)
Data Table on North America - Year-over-year growth 2025-2030 (%)
Chart on Regional Comparison - North America
Data Table on Regional Comparison - North America

12.6.1 Mexico - Market size and forecast 2025-2030

Chart on Mexico - Market size and forecast 2025-2030 ($ million)
Data Table on Mexico - Market size and forecast 2025-2030 ($ million)
Chart on Mexico - Year-over-year growth 2025-2030 (%)
Data Table on Mexico - Year-over-year growth 2025-2030 (%)

12.6.2 Canada - Market size and forecast 2025-2030

Chart on Canada - Market size and forecast 2025-2030 ($ million)
Data Table on Canada - Market size and forecast 2025-2030 ($ million)
Chart on Canada - Year-over-year growth 2025-2030 (%)
Data Table on Canada - Year-over-year growth 2025-2030 (%)

12.6.3 US - Market size and forecast 2025-2030

Chart on US - Market size and forecast 2025-2030 ($ million)
Data Table on US - Market size and forecast 2025-2030 ($ million)
Chart on US - Year-over-year growth 2025-2030 (%)
Data Table on US - Year-over-year growth 2025-2030 (%)

12.7 South America - Market size and forecast 2025-2030

Chart on South America - Market size and forecast 2025-2030 ($ million)
Data Table on South America - Market size and forecast 2025-2030 ($ million)
Chart on South America - Year-over-year growth 2025-2030 (%)
Data Table on South America - Year-over-year growth 2025-2030 (%)
Chart on Regional Comparison - South America
Data Table on Regional Comparison - South America

12.7.1 Brazil - Market size and forecast 2025-2030

Chart on Brazil - Market size and forecast 2025-2030 ($ million)
Data Table on Brazil - Market size and forecast 2025-2030 ($ million)
Chart on Brazil - Year-over-year growth 2025-2030 (%)
Data Table on Brazil - Year-over-year growth 2025-2030 (%)

12.7.2 Chile - Market size and forecast 2025-2030

Chart on Chile - Market size and forecast 2025-2030 ($ million)
Data Table on Chile - Market size and forecast 2025-2030 ($ million)
Chart on Chile - Year-over-year growth 2025-2030 (%)
Data Table on Chile - Year-over-year growth 2025-2030 (%)

12.7.3 Argentina - Market size and forecast 2025-2030

Chart on Argentina - Market size and forecast 2025-2030 ($ million)
Data Table on Argentina - Market size and forecast 2025-2030 ($ million)
Chart on Argentina - Year-over-year growth 2025-2030 (%)
Data Table on Argentina - Year-over-year growth 2025-2030 (%)

12.8 Market opportunity by geography

Market opportunity by geography ($ million)
Data Tables on Market opportunity by geography ($ million)

13. Drivers, Challenges, and Opportunity

13.1 Market drivers

Exponential growth of electric vehicle battery supply chain and cathode chemistry innovation
Global urbanization trends and persistent centrality of steel industry in infrastructure development
Advancements in extraction technology and modernization of beneficiation processes

13.2 Market challenges

Vulnerability of manganese prices to global steel industry cycles
Escalating regulatory pressures and environmental sustainability standards
Logistical impediments and high cost of infrastructure development

13.3 Impact of drivers and challenges

Impact of drivers and challenges in 2025 and 2030

13.4 Market opportunities

Strategic shift toward vertical integration and high-purity chemical refining
Integration of environmental, social, and governance frameworks and green mining practices
Diversification of global supply chains and rise of resource sovereignty

14. Competitive Landscape

14.1 Overview

14.2

Overview on criticality of inputs and factors of differentiation

14.3 Landscape disruption

Overview on factors of disruption

14.4 Industry risks

Impact of key risks on business

15. Competitive Analysis

15.1 Companies profiled

Companies covered

15.2 Company ranking index

15.3 Market positioning of companies

Matrix on companies position and classification

15.4 Anglo American plc

Anglo American plc - Overview
Anglo American plc - Business segments
Anglo American plc - Key offerings
Anglo American plc - Segment focus
SWOT

15.5 Compania Minera Autlan S.A.B.

Compania Minera Autlan S.A.B. - Overview
Compania Minera Autlan S.A.B. - Business segments
Compania Minera Autlan S.A.B. - Key offerings
Compania Minera Autlan S.A.B. - Segment focus
SWOT

15.6 Consolidated Minerals Ltd.

Consolidated Minerals Ltd. - Overview
Consolidated Minerals Ltd. - Product / Service
Consolidated Minerals Ltd. - Key offerings
SWOT

15.7 Eramet SA

Eramet SA - Overview
Eramet SA - Business segments
Eramet SA - Key offerings
Eramet SA - Segment focus
SWOT

15.8 J and F Mineracao Ltda

J and F Mineracao Ltda - Overview
J and F Mineracao Ltda - Product / Service
J and F Mineracao Ltda - Key offerings
SWOT

15.9 Kalagadi Manganese

Kalagadi Manganese - Overview
Kalagadi Manganese - Product / Service
Kalagadi Manganese - Key offerings
SWOT

15.10 Kudumane Manganese Resources

Kudumane Manganese Resources - Overview
Kudumane Manganese Resources - Product / Service
Kudumane Manganese Resources - Key offerings
SWOT

15.11 Maithan Alloys Ltd.

Maithan Alloys Ltd. - Overview
Maithan Alloys Ltd. - Product / Service
Maithan Alloys Ltd. - Key offerings
SWOT

15.12 MOIL LTD

MOIL LTD - Overview
MOIL LTD - Business segments
MOIL LTD - Key offerings
MOIL LTD - Segment focus
SWOT

15.13 OM Holdings Ltd.

OM Holdings Ltd. - Overview
OM Holdings Ltd. - Business segments
OM Holdings Ltd. - Key offerings
OM Holdings Ltd. - Segment focus
SWOT

15.14 Sarda Energy and Minerals Ltd

Sarda Energy and Minerals Ltd - Overview
Sarda Energy and Minerals Ltd - Business segments
Sarda Energy and Minerals Ltd - Key offerings
Sarda Energy and Minerals Ltd - Segment focus
SWOT

15.15 South Manganese Investment Ltd

South Manganese Investment Ltd - Overview
South Manganese Investment Ltd - Business segments
South Manganese Investment Ltd - Key offerings
South Manganese Investment Ltd - Segment focus
SWOT

15.16 Tata Steel Ltd.

Tata Steel Ltd. - Overview
Tata Steel Ltd. - Business segments
Tata Steel Ltd. - Key offerings
Tata Steel Ltd. - Segment focus
SWOT

15.17 Tshipi e Ntle Manganese Mining

Tshipi e Ntle Manganese Mining - Overview
Tshipi e Ntle Manganese Mining - Product / Service
Tshipi e Ntle Manganese Mining - Key offerings
SWOT

15.18 United Manganese of Kalahari

United Manganese of Kalahari - Overview
United Manganese of Kalahari - Product / Service
United Manganese of Kalahari - Key offerings
SWOT

16. Appendix

16.1 Scope of the report

Market definition
Objectives
Notes and caveats

16.2 Inclusions and exclusions checklist

Inclusions checklist
Exclusions checklist

16.3 Currency conversion rates for US$

16.4 Research methodology

16.5 Data procurement

Information sources

16.6 Data validation

16.7 Validation techniques employed for market sizing

16.8 Data synthesis

16.9 360 degree market analysis

16.10 List of abbreviations

Research Methodology

Technavio presents a detailed picture of the market by way of study, synthesis, and summation of data from multiple sources. The analysts have presented the various facets of the market with a particular focus on identifying the key industry influencers. The data thus presented is comprehensive, reliable, and the result of extensive research, both primary and secondary.

INFORMATION SOURCES

Primary sources

  • Manufacturers and suppliers
  • Channel partners
  • Industry experts
  • Strategic decision makers

Secondary sources

  • Industry journals and periodicals
  • Government data
  • Financial reports of key industry players
  • Historical data
  • Press releases

DATA ANALYSIS

Data Synthesis

  • Collation of data
  • Estimation of key figures
  • Analysis of derived insights

Data Validation

  • Triangulation with data models
  • Reference against proprietary databases
  • Corroboration with industry experts

REPORT WRITING

Qualitative

  • Market drivers
  • Market challenges
  • Market trends
  • Five forces analysis

Quantitative

  • Market size and forecast
  • Market segmentation
  • Geographical insights
  • Competitive landscape

Interested in this report?

Get your sample now to see our research methodology and insights!

Download Now

Frequently Asked Questions

Manganese Mining market growth will increase by USD 12165.3 million during 2026-2030.

The Manganese Mining market is expected to grow at a CAGR of 6.7% during 2026-2030.

Manganese Mining market is segmented by Application (Alloys, Steel and battery production) Type (Braunite, Pyrolusite, Psilomelane, Rhodochrosite) End-user (Construction, Automotive, Energy, Electronics, Others)

Anglo American plc, Baridi Group Ltd., BnG Mining Group LLC, Compania Minera Autlan S.A.B., Consolidated Minerals Ltd., Eramet SA, Ghana Manganese Co Ltd, J and F Mineracao Ltda, Jupiter Mines Ltd, Kalagadi Manganese, Kudumane Manganese Resources, Maithan Alloys Ltd., MOIL LTD, Ntsimbintle Holdings Proprietary, OM Holdings Ltd., Sarda Energy and Minerals Ltd, South Manganese Investment Ltd, Tata Steel Ltd., Tshipi e Ntle Manganese Mining, United Manganese of Kalahari are a few of the key vendors in the Manganese Mining market.

APAC will register the highest growth rate of 69.1% among the other regions. Therefore, the Manganese Mining market in APAC is expected to garner significant business opportunities for the vendors during the forecast period.

Australia, India, China, Malaysia, Japan, Indonesia, Ukraine, Czech Republic, Norway, Hungary, Spain, Romania, South Africa, Gabon, Ghana, Israel, Morocco, Mexico, Canada, US, Brazil, Chile, Argentina

  • Exponential growth of electric vehicle battery supply chain and cathode chemistry innovation is the driving factor this market.

The Manganese Mining market vendors should focus on grabbing business opportunities from the Application segment as it accounted for the largest market share in the base year.
RIA - Research AI Assistant
Ask RIA
