Manometry System Market Analysis North America, Europe, Asia, Rest of World (ROW) - US, Germany, UK, Japan, China - Size and Forecast 2024-2028

Manometry System Market Analysis North America, Europe, Asia, Rest of World (ROW) - US, Germany, UK, Japan, China - Size and Forecast 2024-2028

Published: Oct 2023 160 Pages SKU: IRTNTR76691

Market Overview at a Glance

$48.32 Mn
Market Opportunity
4.77%
CAGR
4.36
YoY growth 2023-2024(%)

Manometry System Market Size 2024-2028

The manometry system market size is forecast to increase by USD 48.32 million, at a CAGR of 4.77% between 2023 and 2028.

  • The market is witnessing significant growth, driven by the increasing incidence of gastrointestinal diseases. The diagnostic and therapeutic importance of manometry systems in assessing gastrointestinal motility disorders has led to a rising demand for these systems. Additionally, the focus on high-resolution manometry systems is gaining momentum due to their ability to provide more accurate diagnoses and improved patient outcomes. However, the market faces challenges, including frequent manometry system recalls, which can impact market confidence and hinder market growth. Manufacturers must address these challenges by ensuring product quality and reliability, while also investing in research and development to innovate and differentiate their offerings.
  • Companies seeking to capitalize on market opportunities should also consider expanding their product portfolios to cater to the diverse needs of healthcare providers and patients. Overall, the market presents a promising landscape for growth, with opportunities for companies to address unmet needs and improve patient care.

What will be the Size of the Manometry System Market during the forecast period?

Manometry System Market Size

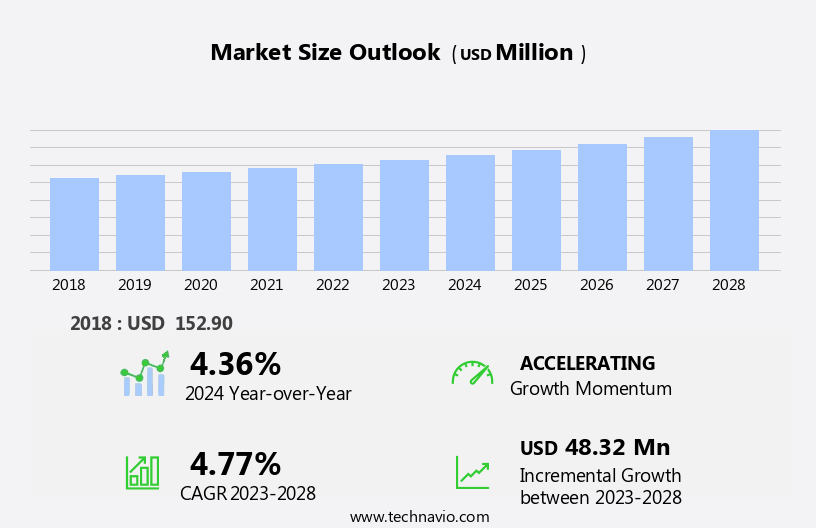
Explore in-depth regional segment analysis with market size data - historical 2018-2022 and forecasts 2024-2028 - in the full report.  
Request Free Sample

The market encompasses a range of technologies and applications, with ongoing advancements shaping its dynamic landscape. These systems are integral to assessing various gastrointestinal functions, including esophageal pressure studies, perfusion tests, antral pressure measurements, and high-resolution manometry. Esophageal manometry, employing manometric catheters, plays a crucial role in diagnosing motor disorders. Perfusion studies, utilizing water perfusion, provide valuable insights into mucosal wave propagation and mucosal relaxation. Antral pressure assessment aids in identifying gastroparesis and other motility disorders. High-resolution manometry, featuring pressure waveforms and small bowel motility analysis, offers enhanced diagnostic accuracy. Clinical applications span from diagnosing swallowing disorders to monitoring patient response to therapy.

Innovations continue to unfold, with data analysis software, calibration procedures, and multichannel recording systems streamlining data acquisition and interpretation. Solid bolus transit, gastric emptying, and pyloric function studies further expand the scope of manometry systems. Solid-state sensors, electrical impedance, and wireless manometry are among the emerging technologies, offering improved patient comfort and ease of use. Pressure mapping and pressure topography provide detailed insights into intraluminal pressure distributions, enhancing diagnostic precision. Manometry systems continue to evolve, with continuous advancements in technology and clinical applications, ensuring their indispensable role in gastrointestinal diagnosis and patient monitoring.

How is this Manometry System Industry segmented?

The manometry system industry research report provides comprehensive data (region-wise segment analysis), with forecasts and estimates in "USD million" for the period 2024-2028, as well as historical data from 2018-2022 for the following segments.

  • End-user
    • Hospitals
    • Diagnostic centers
    • Specialty clinics
    • Academic research institutes
  • Product
    • Manometry system
    • Manometry software
    • Manometry system sheath and catheters
  • Geography
    • North America
      • US
    • Europe
      • Germany
      • UK
    • APAC
      • China
      • Japan
    • Rest of World (ROW)

By End-user Insights

The hospitals segment is estimated to witness significant growth during the forecast period.

The market is experiencing significant advancements, particularly in hospitals, due to the availability of specialized equipment and favorable reimbursement policies. Hospitals, both public and private, with over 500 beds are major contributors to the market's growth. These institutions have state-of-the-art infrastructure to diagnose and monitor chronic conditions, such as gastrointestinal diseases. Manometric catheters and data analysis software are integral components of manometry systems used in hospitals for the assessment of various gastrointestinal functions, including colonic motility, solid bolus transit, gastric emptying, pyloric function, and impedance planimetry. High-resolution manometry, with its pressure waveforms and multichannel recording capabilities, plays a crucial role in diagnosing esophageal peristalsis and swallowing disorders.

Pressure mapping and calibration procedures ensure diagnostic accuracy. Hospitals also employ wireless manometry and intraluminal pressure sensors for patient monitoring. Perfusion studies using water perfusion and antral pressure measurement are other clinical applications of manometry systems. Small bowel motility assessment is another emerging application, which will further boost the market's growth.

Manometry System Market Size

Request Free Sample

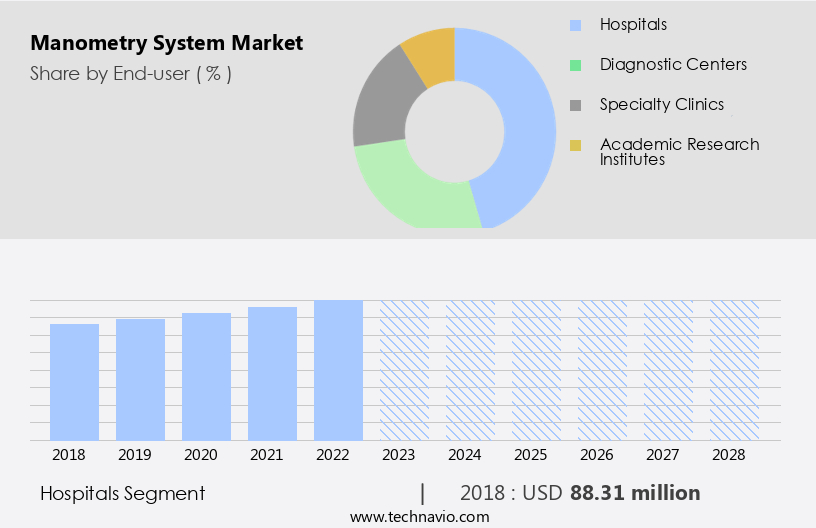
The Hospitals segment was valued at USD 88.31 million in 2018 and showed a gradual increase during the forecast period.

Regional Analysis

North America is estimated to contribute 37% to the growth of the global market during the forecast period. Technavio's analysts have elaborately explained the regional trends and drivers that shape the market during the forecast period.

Manometry System Market Share by Geography

 Request Free Sample

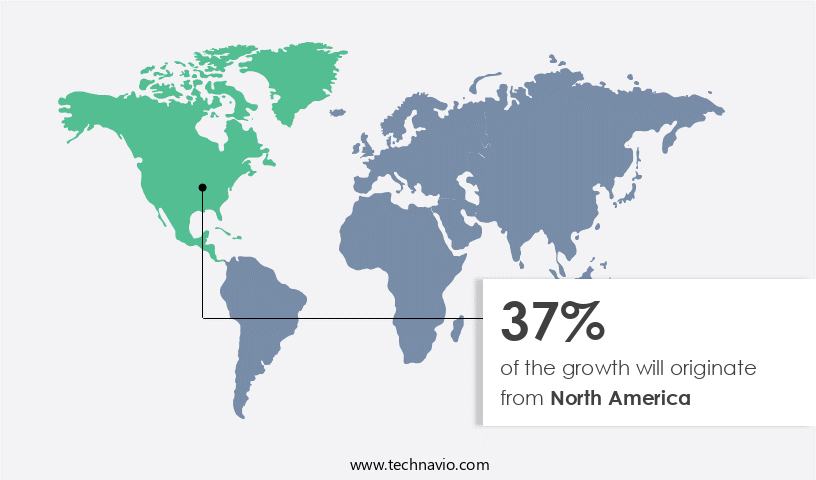
The market in North America is experiencing significant growth due to the increasing incidence and prevalence of chronic gastrointestinal diseases and rising healthcare expenditure. Advanced data analysis software and manometric catheters are essential tools in diagnosing and monitoring various gastrointestinal disorders, including colonic motility, gastric emptying, pyloric function, and swallowing disorders. Impedance planimetry and high-resolution impedance technologies are increasingly being used for gastric motility studies, providing valuable insights into antral pressure and bolus transit. Pharmaceutical and biotechnology companies are investing heavily in research and development to create sophisticated healthcare equipment, such as high-resolution manometry systems. These systems offer pressure waveforms, small bowel motility assessments, and pressure mapping, enabling accurate diagnosis and effective treatment of gastrointestinal disorders.

Clinical applications of manometry systems extend to diagnostic accuracy, patient monitoring, and catheter placement. The demand for wireless manometry systems and multichannel recording devices is increasing due to their ease of use and improved patient comfort. Esophageal peristalsis assessment and lower esophageal sphincter function studies are crucial in diagnosing conditions like gastroesophageal reflux disease. Perfusion studies using water perfusion and pressure sensors help evaluate the function of the pylorus and antrum. Swallowing disorders, such as achalasia and dysphagia, are common gastrointestinal conditions that require manometry testing. Calibration procedures ensure accurate measurement of intraluminal pressure, while solid-state sensors and electrical impedance technologies offer improved sensitivity and reliability.

In summary, the market in North America is driven by the increasing demand for advanced diagnostic tools and the growing prevalence of chronic gastrointestinal diseases.

Market Dynamics

Our researchers analyzed the data with 2023 as the base year, along with the key drivers, trends, and challenges. A holistic analysis of drivers will help companies refine their marketing strategies to gain a competitive advantage.

What are the key market drivers leading to the rise in the adoption of Manometry System Industry?

  • The rising prevalence of gastrointestinal diseases serves as the primary catalyst for market growth in this sector. 
  • The gastrointestinal disease landscape is witnessing a notable increase due to factors such as improper diet, inactive lifestyle, stress, food sensitivity, and bacterial or viral infections. Chronic conditions like ulcerative colitis, hemorrhoids, Inflammatory Bowel Disease (IBD), and GERD have become prevalent, leading to various medical complications and disabilities if left untreated. GERD, a chronic condition affecting individuals of all age groups, is associated with complications such as erosive esophagitis, esophageal stricture, Barrett esophagus, dental diseases, and asthma. To diagnose and assess GERD, medical professionals employ manometry tests, specifically esophageal manometry. Manometry systems utilize manometric catheters to measure the contractions and relaxations of the muscles in the gastrointestinal tract.
  • Data analysis software plays a crucial role in interpreting the data collected from these tests, allowing for a more accurate diagnosis and treatment plan. Technologies like impedance planimetry and high-resolution impedance are employed in manometry systems to evaluate gastric motility, gastric emptying, and pyloric function. These advanced techniques offer improved diagnostic accuracy and enable better understanding of gastrointestinal conditions. In conclusion, the growing prevalence of gastrointestinal diseases necessitates the use of advanced diagnostic tools, such as manometry systems, to ensure timely and accurate diagnoses. The integration of data analysis software and advanced technologies like impedance planimetry and high-resolution impedance further enhances the diagnostic capabilities of these systems.

What are the market trends shaping the Manometry System Industry?

  • High-resolution manometry systems are gaining significant attention in the medical industry due to their increasing use in diagnosing gastrointestinal motility disorders. The market trend is shifting towards these advanced systems as they offer higher accuracy and improved diagnostic capabilities compared to traditional manometry methods.
  • High-resolution manometry (HRM) has revolutionized the clinical assessment of esophageal motility disorders by providing more detailed and accurate information than traditional manometry. HRM uses a manometry catheter with up to 36 pressure sensors, allowing for intraluminal esophageal pressure signals to be transmitted and analyzed in greater detail. This advanced technology enables the evaluation of esophageal motility patterns, including pressure waveforms in the lower esophageal sphincter and antral pressure, which are crucial in diagnosing conditions such as gastroesophageal reflux disease and achalasia. HRM also plays a significant role in the diagnostic process of small bowel motility disorders, as it provides valuable data on perfusion studies using water perfusion techniques.
  • The clinical applications of HRM extend beyond the diagnosis of motility disorders, as it can also be used to assess the effectiveness of various treatments and therapies. Overall, HRM's diagnostic accuracy and ability to provide comprehensive information on esophageal motility make it an essential tool in gastrointestinal clinical practice.

What challenges does the Manometry System Industry face during its growth?

  • The recurring recalls of manometry systems pose a significant challenge to the industry's growth trajectory. Manometry systems, essential for diagnosing gastrointestinal disorders, face frequent recalls due to various reasons, including technical glitches and regulatory compliance issues. This persistent challenge hampers industry progress and increases operational costs for healthcare providers. 
  • Manometry systems are essential diagnostic tools used in the healthcare industry to measure intraluminal pressure in various parts of the gastrointestinal tract, such as the esophagus. These systems consist of a pressure mapping system and a data acquisition system. The pressure mapping system includes solid-state sensors that measure electrical impedance to detect bolus transit and intraluminal pressure. The data acquisition system records and analyzes the data obtained from the manometry sensors. Calibration procedures are crucial in manometry systems to ensure accurate pressure readings. Manufacturers follow stringent calibration processes to maintain the system's accuracy and reliability. Wireless manometry systems offer enhanced flexibility and mobility, making them increasingly popular in clinical settings.
  • Despite the benefits, manometry systems are subject to recalls due to safety or functionality issues. Product recalls can result from various reasons, including design errors, software glitches, or other technical problems. Manufacturers prioritize patient safety and issue recalls to address these issues and ensure the safe and effective use of their manometry systems. Manometry system manufacturers face the challenge of maintaining the highest standards of safety and accuracy while continuously innovating to improve the functionality and usability of their products. Regular calibration procedures and rigorous quality control measures help mitigate the risk of product recalls and ensure the delivery of reliable and effective manometry systems to healthcare providers and patients.

Exclusive Customer Landscape

The manometry system market forecasting report includes the adoption lifecycle of the market, covering from the innovator's stage to the laggard's stage. It focuses on adoption rates in different regions based on penetration. Furthermore, the manometry system market report also includes key purchase criteria and drivers of price sensitivity to help companies evaluate and develop their market growth analysis strategies.
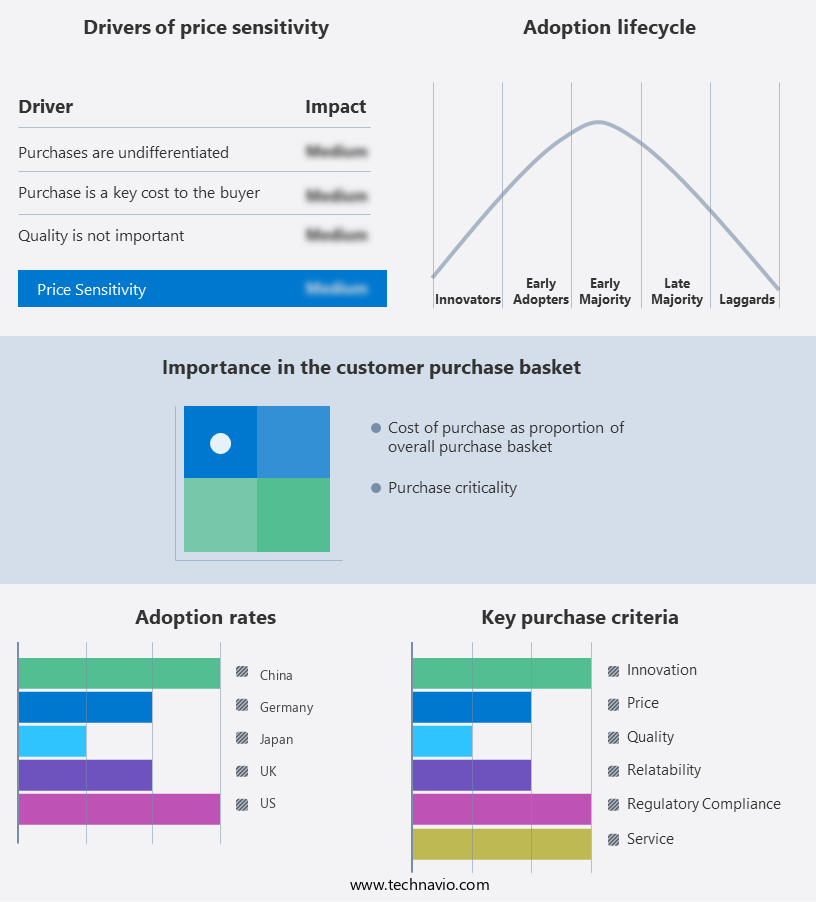
Manometry System Market Share by Geography

 Customer Landscape

Key Companies & Market Insights

Companies are implementing various strategies, such as strategic alliances, manometry system market forecast, partnerships, mergers and acquisitions, geographical expansion, and product/service launches, to enhance their presence in the industry.

Alacer Biomedica - The company specializes in advanced manometry systems, including high resolution esophageal manometry (MULTIPLEX) and high resolution anorectal manometry, providing valuable diagnostic insights for gastrointestinal and anorectal disorders.

The industry research and growth report includes detailed analyses of the competitive landscape of the market and information about key companies, including:

  • Alacer Biomedica
  • Creo Medical Ltd.
  • Daffodil Health Technology Service Co.
  • Diversatek Inc.
  • Innologic
  • LABORIE MEDICAL TECHNOLOGIES CORP.
  • Medica S.p.A.
  • Medspira LLC
  • Medtronic Plc
  • Mui Scientific
  • Standard Instruments GmbH
  • TECHNOMED SYSTEMS
  • THD S.p.A

Qualitative and quantitative analysis of companies has been conducted to help clients understand the wider business environment as well as the strengths and weaknesses of key industry players. Data is qualitatively analyzed to categorize companies as pure play, category-focused, industry-focused, and diversified; it is quantitatively analyzed to categorize companies as dominant, leading, strong, tentative, and weak.

Recent Development and News in Manometry System Market

  • In January 2024, Medtronic plc, a leading medical technology, services, and solutions company, announced the launch of its new Esophageal Manometry System, the MMS-7000 Series, designed to improve the diagnosis and treatment of gastrointestinal motility disorders (Medtronic Press Release, 2024).
  • In March 2024, Philips Healthcare, a global leader in health technology, entered into a strategic partnership with the University of California, San Francisco (UCSF) to develop advanced manometry technologies for the diagnosis and treatment of gastrointestinal disorders (Philips Healthcare Press Release, 2024).
  • In May 2024, Boston Scientific Corporation, a medical device manufacturer, completed the acquisition of EndoChoice, Inc., a leading provider of diagnostic and therapeutic solutions for gastrointestinal diseases, significantly expanding its presence in the manometry systems market (Boston Scientific Press Release, 2024).
  • In February 2025, the US Food and Drug Administration (FDA) granted clearance for Olympus Corporation's new manometry system, the Endo-MRI Manometry System, which combines manometry and magnetic resonance imaging (MRI) for more accurate diagnosis of gastrointestinal disorders (Olympus Press Release, 2025).

Research Analyst Overview

  • The esophageal manometry market encompasses innovative systems designed for diagnosing and monitoring various motility disorders, including esophageal spasms and deglutition disorders. System calibration plays a crucial role in ensuring accurate procedural techniques and clinical trials. Gastric emptying rate and bolus transport are essential diagnostic criteria for functional dyspepsia and gastroesophageal reflux. Signal processing and pressure waveform analysis are integral to interpreting manometry data, while clinical outcome measures and imaging integration provide valuable insights. Impedance manometry and high-resolution manometry offer enhanced diagnostic capabilities for motility disorders. Sensor placement, such as antral manometry, and wireless capsule endoscopy contribute to improved patient selection and diagnostic accuracy.
  • Colonic manometry and colonic transit time are essential for diagnosing colonic motility disorders. Pressure sensor technology and data visualization tools facilitate efficient device validation and enable better understanding of complex manometry data. Gastric manometry remains a critical diagnostic tool for various gastrointestinal conditions. Motility disorders, like esophageal spasms and gastroesophageal reflux, require precise diagnostic criteria and effective treatment strategies. Proper patient selection and sensor placement are essential for accurate diagnosis and clinical outcome measures. Advancements in manometry technology, including signal processing, imaging integration, and high-resolution manometry, offer significant improvements in diagnostic accuracy and patient care.
  • Continued research and development in this field will undoubtedly contribute to better understanding and management of various gastrointestinal disorders.

Dive into Technavio's robust research methodology, blending expert interviews, extensive data synthesis, and validated models for unparalleled Manometry System Market insights. See full methodology.

Market Scope

Report Coverage

Details

Page number

160

Base year

2023

Historic period

2018-2022

Forecast period

2024-2028

Growth momentum & CAGR

Accelerate at a CAGR of 4.77%

Market growth 2024-2028

USD 48.32 million

Market structure

Concentrated

YoY growth 2023-2024(%)

4.36

Key countries

US, Germany, UK, Japan, and China

Competitive landscape

Leading Companies, Market Positioning of Companies, Competitive Strategies, and Industry Risks

Request Free Sample

What are the Key Data Covered in this Manometry System Market Research and Growth Report?

  • CAGR of the Manometry System industry during the forecast period
  • Detailed information on factors that will drive the growth and forecasting between 2024 and 2028
  • Precise estimation of the size of the market and its contribution of the industry in focus to the parent market
  • Accurate predictions about upcoming growth and trends and changes in consumer behaviour
  • Growth of the market across North America, Europe, Asia, and Rest of World (ROW)
  • Thorough analysis of the market's competitive landscape and detailed information about companies
  • Comprehensive analysis of factors that will challenge the manometry system market growth of industry companies

We can help! Our analysts can customize this manometry system market research report to meet your requirements.

Get in touch

1 Executive Summary

  • 1.1 Market overview
    • Exhibit 01: Executive Summary – Chart on Market Overview
    • Exhibit 02: Executive Summary – Data Table on Market Overview
    • Exhibit 03: Executive Summary – Chart on Global Market Characteristics
    • Exhibit 04: Executive Summary – Chart on Market by Geography
    • Exhibit 05: Executive Summary – Chart on Market Segmentation by End-user
    • Exhibit 06: Executive Summary – Chart on Market Segmentation by Product
    • Exhibit 07: Executive Summary – Chart on Incremental Growth
    • Exhibit 08: Executive Summary – Data Table on Incremental Growth
    • Exhibit 09: Executive Summary – Chart on Vendor Market Positioning

2 Market Landscape

  • 2.1 Market ecosystem
    • Exhibit 10: Parent market
    • Exhibit 11: Market Characteristics

3 Market Sizing

  • 3.1 Market definition
    • Exhibit 12: Offerings of vendors included in the market definition
  • 3.2 Market segment analysis
    • Exhibit 13: Market segments
  • 3.3 Market size 2023
    • 3.4 Market outlook: Forecast for 2023-2028
      • Exhibit 14: Chart on Global - Market size and forecast 2023-2028 ($ million)
      • Exhibit 15: Data Table on Global - Market size and forecast 2023-2028 ($ million)
      • Exhibit 16: Chart on Global Market: Year-over-year growth 2023-2028 (%)
      • Exhibit 17: Data Table on Global Market: Year-over-year growth 2023-2028 (%)

    4 Historic Market Size

    • 4.1 Global manometry system market 2018 - 2022
      • Exhibit 18: Historic Market Size – Data Table on global manometry system market 2018 - 2022 ($ million)
    • 4.2 End-user Segment Analysis 2018 - 2022
      • Exhibit 19: Historic Market Size – End-user Segment 2018 - 2022 ($ million)
    • 4.3 Product Segment Analysis 2018 - 2022
      • Exhibit 20: Historic Market Size – Product Segment 2018 - 2022 ($ million)
    • 4.4 Geography Segment Analysis 2018 - 2022
      • Exhibit 21: Historic Market Size – Geography Segment 2018 - 2022 ($ million)
    • 4.5 Country Segment Analysis 2018 - 2022
      • Exhibit 22: Historic Market Size – Country Segment 2018 - 2022 ($ million)

    5 Five Forces Analysis

    • 5.1 Five forces summary
      • Exhibit 23: Five forces analysis - Comparison between 2023 and 2028
    • 5.2 Bargaining power of buyers
      • Exhibit 24: Chart on Bargaining power of buyers – Impact of key factors 2023 and 2028
    • 5.3 Bargaining power of suppliers
      • Exhibit 25: Bargaining power of suppliers – Impact of key factors in 2023 and 2028
    • 5.4 Threat of new entrants
      • Exhibit 26: Threat of new entrants – Impact of key factors in 2023 and 2028
    • 5.5 Threat of substitutes
      • Exhibit 27: Threat of substitutes – Impact of key factors in 2023 and 2028
    • 5.6 Threat of rivalry
      • Exhibit 28: Threat of rivalry – Impact of key factors in 2023 and 2028
    • 5.7 Market condition
      • Exhibit 29: Chart on Market condition - Five forces 2023 and 2028

    6 Market Segmentation by End-user

    • 6.1 Market segments
      • Exhibit 30: Chart on End-user - Market share 2023-2028 (%)
      • Exhibit 31: Data Table on End-user - Market share 2023-2028 (%)
    • 6.2 Comparison by End-user
      • Exhibit 32: Chart on Comparison by End-user
      • Exhibit 33: Data Table on Comparison by End-user
    • 6.3 Hospitals - Market size and forecast 2023-2028
      • Exhibit 34: Chart on Hospitals - Market size and forecast 2023-2028 ($ million)
      • Exhibit 35: Data Table on Hospitals - Market size and forecast 2023-2028 ($ million)
      • Exhibit 36: Chart on Hospitals - Year-over-year growth 2023-2028 (%)
      • Exhibit 37: Data Table on Hospitals - Year-over-year growth 2023-2028 (%)
    • 6.4 Diagnostic centers - Market size and forecast 2023-2028
      • Exhibit 38: Chart on Diagnostic centers - Market size and forecast 2023-2028 ($ million)
      • Exhibit 39: Data Table on Diagnostic centers - Market size and forecast 2023-2028 ($ million)
      • Exhibit 40: Chart on Diagnostic centers - Year-over-year growth 2023-2028 (%)
      • Exhibit 41: Data Table on Diagnostic centers - Year-over-year growth 2023-2028 (%)
    • 6.5 Specialty clinics - Market size and forecast 2023-2028
      • Exhibit 42: Chart on Specialty clinics - Market size and forecast 2023-2028 ($ million)
      • Exhibit 43: Data Table on Specialty clinics - Market size and forecast 2023-2028 ($ million)
      • Exhibit 44: Chart on Specialty clinics - Year-over-year growth 2023-2028 (%)
      • Exhibit 45: Data Table on Specialty clinics - Year-over-year growth 2023-2028 (%)
    • 6.6 Academic research institutes - Market size and forecast 2023-2028
      • Exhibit 46: Chart on Academic research institutes - Market size and forecast 2023-2028 ($ million)
      • Exhibit 47: Data Table on Academic research institutes - Market size and forecast 2023-2028 ($ million)
      • Exhibit 48: Chart on Academic research institutes - Year-over-year growth 2023-2028 (%)
      • Exhibit 49: Data Table on Academic research institutes - Year-over-year growth 2023-2028 (%)
    • 6.7 Market opportunity by End-user
      • Exhibit 50: Market opportunity by End-user ($ million)
      • Exhibit 51: Data Table on Market opportunity by End-user ($ million)

    7 Market Segmentation by Product

    • 7.1 Market segments
      • Exhibit 52: Chart on Product - Market share 2023-2028 (%)
      • Exhibit 53: Data Table on Product - Market share 2023-2028 (%)
    • 7.2 Comparison by Product
      • Exhibit 54: Chart on Comparison by Product
      • Exhibit 55: Data Table on Comparison by Product
    • 7.3 Manometry system - Market size and forecast 2023-2028
      • Exhibit 56: Chart on Manometry system - Market size and forecast 2023-2028 ($ million)
      • Exhibit 57: Data Table on Manometry system - Market size and forecast 2023-2028 ($ million)
      • Exhibit 58: Chart on Manometry system - Year-over-year growth 2023-2028 (%)
      • Exhibit 59: Data Table on Manometry system - Year-over-year growth 2023-2028 (%)
    • 7.4 Manometry software - Market size and forecast 2023-2028
      • Exhibit 60: Chart on Manometry software - Market size and forecast 2023-2028 ($ million)
      • Exhibit 61: Data Table on Manometry software - Market size and forecast 2023-2028 ($ million)
      • Exhibit 62: Chart on Manometry software - Year-over-year growth 2023-2028 (%)
      • Exhibit 63: Data Table on Manometry software - Year-over-year growth 2023-2028 (%)
    • 7.5 Manometry system sheath and catheters - Market size and forecast 2023-2028
      • Exhibit 64: Chart on Manometry system sheath and catheters - Market size and forecast 2023-2028 ($ million)
      • Exhibit 65: Data Table on Manometry system sheath and catheters - Market size and forecast 2023-2028 ($ million)
      • Exhibit 66: Chart on Manometry system sheath and catheters - Year-over-year growth 2023-2028 (%)
      • Exhibit 67: Data Table on Manometry system sheath and catheters - Year-over-year growth 2023-2028 (%)
    • 7.6 Market opportunity by Product
      • Exhibit 68: Market opportunity by Product ($ million)
      • Exhibit 69: Data Table on Market opportunity by Product ($ million)

    8 Customer Landscape

    • 8.1 Customer landscape overview
      • Exhibit 70: Analysis of price sensitivity, lifecycle, customer purchase basket, adoption rates, and purchase criteria

    9 Geographic Landscape

    • 9.1 Geographic segmentation
      • Exhibit 71: Chart on Market share by geography 2023-2028 (%)
      • Exhibit 72: Data Table on Market share by geography 2023-2028 (%)
    • 9.2 Geographic comparison
      • Exhibit 73: Chart on Geographic comparison
      • Exhibit 74: Data Table on Geographic comparison
    • 9.3 North America - Market size and forecast 2023-2028
      • Exhibit 75: Chart on North America - Market size and forecast 2023-2028 ($ million)
      • Exhibit 76: Data Table on North America - Market size and forecast 2023-2028 ($ million)
      • Exhibit 77: Chart on North America - Year-over-year growth 2023-2028 (%)
      • Exhibit 78: Data Table on North America - Year-over-year growth 2023-2028 (%)
    • 9.4 Europe - Market size and forecast 2023-2028
      • Exhibit 79: Chart on Europe - Market size and forecast 2023-2028 ($ million)
      • Exhibit 80: Data Table on Europe - Market size and forecast 2023-2028 ($ million)
      • Exhibit 81: Chart on Europe - Year-over-year growth 2023-2028 (%)
      • Exhibit 82: Data Table on Europe - Year-over-year growth 2023-2028 (%)
    • 9.5 Asia - Market size and forecast 2023-2028
      • Exhibit 83: Chart on Asia - Market size and forecast 2023-2028 ($ million)
      • Exhibit 84: Data Table on Asia - Market size and forecast 2023-2028 ($ million)
      • Exhibit 85: Chart on Asia - Year-over-year growth 2023-2028 (%)
      • Exhibit 86: Data Table on Asia - Year-over-year growth 2023-2028 (%)
    • 9.6 Rest of World (ROW) - Market size and forecast 2023-2028
      • Exhibit 87: Chart on Rest of World (ROW) - Market size and forecast 2023-2028 ($ million)
      • Exhibit 88: Data Table on Rest of World (ROW) - Market size and forecast 2023-2028 ($ million)
      • Exhibit 89: Chart on Rest of World (ROW) - Year-over-year growth 2023-2028 (%)
      • Exhibit 90: Data Table on Rest of World (ROW) - Year-over-year growth 2023-2028 (%)
    • 9.7 US - Market size and forecast 2023-2028
      • Exhibit 91: Chart on US - Market size and forecast 2023-2028 ($ million)
      • Exhibit 92: Data Table on US - Market size and forecast 2023-2028 ($ million)
      • Exhibit 93: Chart on US - Year-over-year growth 2023-2028 (%)
      • Exhibit 94: Data Table on US - Year-over-year growth 2023-2028 (%)
    • 9.8 Germany - Market size and forecast 2023-2028
      • Exhibit 95: Chart on Germany - Market size and forecast 2023-2028 ($ million)
      • Exhibit 96: Data Table on Germany - Market size and forecast 2023-2028 ($ million)
      • Exhibit 97: Chart on Germany - Year-over-year growth 2023-2028 (%)
      • Exhibit 98: Data Table on Germany - Year-over-year growth 2023-2028 (%)
    • 9.9 Japan - Market size and forecast 2023-2028
      • Exhibit 99: Chart on Japan - Market size and forecast 2023-2028 ($ million)
      • Exhibit 100: Data Table on Japan - Market size and forecast 2023-2028 ($ million)
      • Exhibit 101: Chart on Japan - Year-over-year growth 2023-2028 (%)
      • Exhibit 102: Data Table on Japan - Year-over-year growth 2023-2028 (%)
    • 9.10 China - Market size and forecast 2023-2028
      • Exhibit 103: Chart on China - Market size and forecast 2023-2028 ($ million)
      • Exhibit 104: Data Table on China - Market size and forecast 2023-2028 ($ million)
      • Exhibit 105: Chart on China - Year-over-year growth 2023-2028 (%)
      • Exhibit 106: Data Table on China - Year-over-year growth 2023-2028 (%)
    • 9.11 UK - Market size and forecast 2023-2028
      • Exhibit 107: Chart on UK - Market size and forecast 2023-2028 ($ million)
      • Exhibit 108: Data Table on UK - Market size and forecast 2023-2028 ($ million)
      • Exhibit 109: Chart on UK - Year-over-year growth 2023-2028 (%)
      • Exhibit 110: Data Table on UK - Year-over-year growth 2023-2028 (%)
    • 9.12 Market opportunity by geography
      • Exhibit 111: Market opportunity by geography ($ million)
      • Exhibit 112: Data Tables on Market opportunity by geography ($ million)

    10 Drivers, Challenges, and Trends

    • 10.1 Market drivers
      • 10.2 Market challenges
        • 10.3 Impact of drivers and challenges
          • Exhibit 113: Impact of drivers and challenges in 2023 and 2028
        • 10.4 Market trends

          11 Vendor Landscape

          • 11.1 Overview
            • 11.2 Vendor landscape
              • Exhibit 114: Overview on Criticality of inputs and Factors of differentiation
            • 11.3 Landscape disruption
              • Exhibit 115: Overview on factors of disruption
            • 11.4 Industry risks
              • Exhibit 116: Impact of key risks on business

            12 Vendor Analysis

            • 12.1 Vendors covered
              • Exhibit 117: Vendors covered
            • 12.2 Market positioning of vendors
              • Exhibit 118: Matrix on vendor position and classification
            • 12.3 Alacer Biomedica
              • Exhibit 119: Alacer Biomedica - Overview
              • Exhibit 120: Alacer Biomedica - Product / Service
              • Exhibit 121: Alacer Biomedica - Key offerings
            • 12.4 Creo Medical Ltd.
              • Exhibit 122: Creo Medical Ltd. - Overview
              • Exhibit 123: Creo Medical Ltd. - Product / Service
              • Exhibit 124: Creo Medical Ltd. - Key offerings
            • 12.5 Daffodil Health Technology Service Co.
              • Exhibit 125: Daffodil Health Technology Service Co. - Overview
              • Exhibit 126: Daffodil Health Technology Service Co. - Product / Service
              • Exhibit 127: Daffodil Health Technology Service Co. - Key offerings
            • 12.6 Diversatek Inc.
              • Exhibit 128: Diversatek Inc. - Overview
              • Exhibit 129: Diversatek Inc. - Product / Service
              • Exhibit 130: Diversatek Inc. - Key offerings
            • 12.7 Innologic
              • Exhibit 131: Innologic - Overview
              • Exhibit 132: Innologic - Product / Service
              • Exhibit 133: Innologic - Key offerings
            • 12.8 LABORIE MEDICAL TECHNOLOGIES CORP.
              • Exhibit 134: LABORIE MEDICAL TECHNOLOGIES CORP. - Overview
              • Exhibit 135: LABORIE MEDICAL TECHNOLOGIES CORP. - Product / Service
              • Exhibit 136: LABORIE MEDICAL TECHNOLOGIES CORP. - Key offerings
            • 12.9 Medica S.p.A.
              • Exhibit 137: Medica S.p.A. - Overview
              • Exhibit 138: Medica S.p.A. - Product / Service
              • Exhibit 139: Medica S.p.A. - Key offerings
            • 12.10 Medspira LLC
              • Exhibit 140: Medspira LLC - Overview
              • Exhibit 141: Medspira LLC - Product / Service
              • Exhibit 142: Medspira LLC - Key offerings
            • 12.11 Medtronic Plc
              • Exhibit 143: Medtronic Plc - Overview
              • Exhibit 144: Medtronic Plc - Business segments
              • Exhibit 145: Medtronic Plc - Key news
              • Exhibit 146: Medtronic Plc - Key offerings
              • Exhibit 147: Medtronic Plc - Segment focus
            • 12.12 Mui Scientific
              • Exhibit 148: Mui Scientific - Overview
              • Exhibit 149: Mui Scientific - Product / Service
              • Exhibit 150: Mui Scientific - Key offerings
            • 12.13 Standard Instruments GmbH
              • Exhibit 151: Standard Instruments GmbH - Overview
              • Exhibit 152: Standard Instruments GmbH - Product / Service
              • Exhibit 153: Standard Instruments GmbH - Key offerings
            • 12.14 TECHNOMED SYSTEMS
              • Exhibit 154: TECHNOMED SYSTEMS - Overview
              • Exhibit 155: TECHNOMED SYSTEMS - Product / Service
              • Exhibit 156: TECHNOMED SYSTEMS - Key offerings
            • 12.15 THD S.p.A
              • Exhibit 157: THD S.p.A - Overview
              • Exhibit 158: THD S.p.A - Product / Service
              • Exhibit 159: THD S.p.A - Key offerings

            13 Appendix

            • 13.1 Scope of the report
              • 13.2 Inclusions and exclusions checklist
                • Exhibit 160: Inclusions checklist
                • Exhibit 161: Exclusions checklist
              • 13.3 Currency conversion rates for US$
                • Exhibit 162: Currency conversion rates for US$
              • 13.4 Research methodology
                • Exhibit 163: Research methodology
                • Exhibit 164: Validation techniques employed for market sizing
                • Exhibit 165: Information sources
              • 13.5 List of abbreviations
                • Exhibit 166: List of abbreviations

              Research Methodology

              Technavio presents a detailed picture of the market by way of study, synthesis, and summation of data from multiple sources. The analysts have presented the various facets of the market with a particular focus on identifying the key industry influencers. The data thus presented is comprehensive, reliable, and the result of extensive research, both primary and secondary.

              INFORMATION SOURCES

              Primary sources

              • Manufacturers and suppliers
              • Channel partners
              • Industry experts
              • Strategic decision makers

              Secondary sources

              • Industry journals and periodicals
              • Government data
              • Financial reports of key industry players
              • Historical data
              • Press releases

              DATA ANALYSIS

              Data Synthesis

              • Collation of data
              • Estimation of key figures
              • Analysis of derived insights

              Data Validation

              • Triangulation with data models
              • Reference against proprietary databases
              • Corroboration with industry experts

              REPORT WRITING

              Qualitative

              • Market drivers
              • Market challenges
              • Market trends
              • Five forces analysis

              Quantitative

              • Market size and forecast
              • Market segmentation
              • Geographical insights
              • Competitive landscape

              Interested in this report?

              Get your sample now to see our research methodology and insights!

              Download Now

              Frequently Asked Questions

              Manometry System market growth will increase by $ 48.32 mn during 2024-2028.

              The Manometry System market is expected to grow at a CAGR of 4.77% during 2024-2028.

              Manometry System market is segmented by End-user( Hospitals, Diagnostic centers, Specialty clinics, Academic research institutes) Product( Manometry system, Manometry software, Manometry system sheath and catheters)

              Alacer Biomedica, Creo Medical Ltd., Daffodil Health Technology Service Co., Diversatek Inc., Innologic, LABORIE MEDICAL TECHNOLOGIES CORP., Medica S.p.A., Medspira LLC, Medtronic Plc, Mui Scientific, Standard Instruments GmbH, TECHNOMED SYSTEMS, THD S.p.A are a few of the key vendors in the Manometry System market.

              North America will register the highest growth rate of 37% among the other regions. Therefore, the Manometry System market in North America is expected to garner significant business opportunities for the vendors during the forecast period.

              US, Germany, UK, Japan, China

              • Increasing incidence of gastrointestinal diseasesThe prevalence of gastrointestinal diseases is the driving factor this market.
              • such as ulcerative colitis is the driving factor this market.
              • hemorrhoids is the driving factor this market.
              • IBD is the driving factor this market.
              • and GERD is the driving factor this market.
              • has increased significantly across the world. Improper diet is the driving factor this market.
              • inactive lifestyle is the driving factor this market.
              • stress is the driving factor this market.
              • food sensitivity is the driving factor this market.
              • and bacterial or viral infection are the major factors contributing to the increasing incidence of chronic and acute gastrointestinal diseases. Chronic gastrointestinal diseases may lead to various medical complications and disabilities if not diagnosed and treated on time. GERD is a chronic condition that affects people of all age groups. Erosive esophagitis is the driving factor this market.
              • esophageal stricture is the driving factor this market.
              • Barrett esophagus is the driving factor this market.
              • dental diseases is the driving factor this market.
              • and asthma are the major medical complications associated with GERD. Furthermore is the driving factor this market.
              • esophageal manometry is performed in the treatment of GRED. Improper and incorrect diets is the driving factor this market.
              • inactive lifestyles is the driving factor this market.
              • stress is the driving factor this market.
              • food sensitivity is the driving factor this market.
              • and bacterial or viral infections are the major factors contributing to the increasing incidence of chronic gastrointestinal diseases. Chronic gastrointestinal diseases may lead to various medical complications and disabilities if not diagnosed and treated in time. IBD is one of the most commonly prevalent gastrointestinal conditions is the driving factor this market.
              • and it causes inflammation of the gastrointestinal tract. Crohn disease and ulcerative colitis are the most common forms of IBD. For instance is the driving factor this market.
              • in 2021 is the driving factor this market.
              • the UK National Health Service (NHS) recorded that one in every 420 people living in the UK had ulcerative colitis. People with IBD are more susceptible to developing certain chronic health conditions is the driving factor this market.
              • such as cancer is the driving factor this market.
              • respiratory diseases is the driving factor this market.
              • liver diseases is the driving factor this market.
              • kidney diseases is the driving factor this market.
              • and cardiovascular diseases (CVDs). Prolonged treatment is required to prevent and cure IBD. Anorectal manometry is a useful tool for evaluating IBD patients.   Thus is the driving factor this market.
              • the increasing incidence and prevalence of various gastrointestinal diseases have increased the demand for manometry tests is the driving factor this market.
              • which in turn will drive the growth of the market in focus during the forecast period. is the driving factor this market.

              The Manometry System market vendors should focus on grabbing business opportunities from the Hospitals segment as it accounted for the largest market share in the base year.