Marine Lubricants Market Analysis, Size, and Forecast 2024-2028: North America (US and Canada), Europe (France, Germany, Italy, and UK), Middle East and Africa (Egypt, KSA, Oman, and UAE), APAC (China, India, and Japan), South America (Argentina and Brazil), and Rest of World (ROW)

Marine Lubricants Market Analysis, Size, and Forecast 2024-2028:
North America (US and Canada), Europe (France, Germany, Italy, and UK), Middle East and Africa (Egypt, KSA, Oman, and UAE), APAC (China, India, and Japan), South America (Argentina and Brazil), and Rest of World (ROW)

Published: Mar 2024 180 Pages SKU: IRTNTR72856

Market Overview at a Glance

$41.21 Mn
Market Opportunity
2.49%
CAGR
2.26
YoY growth 2023-2024(%)

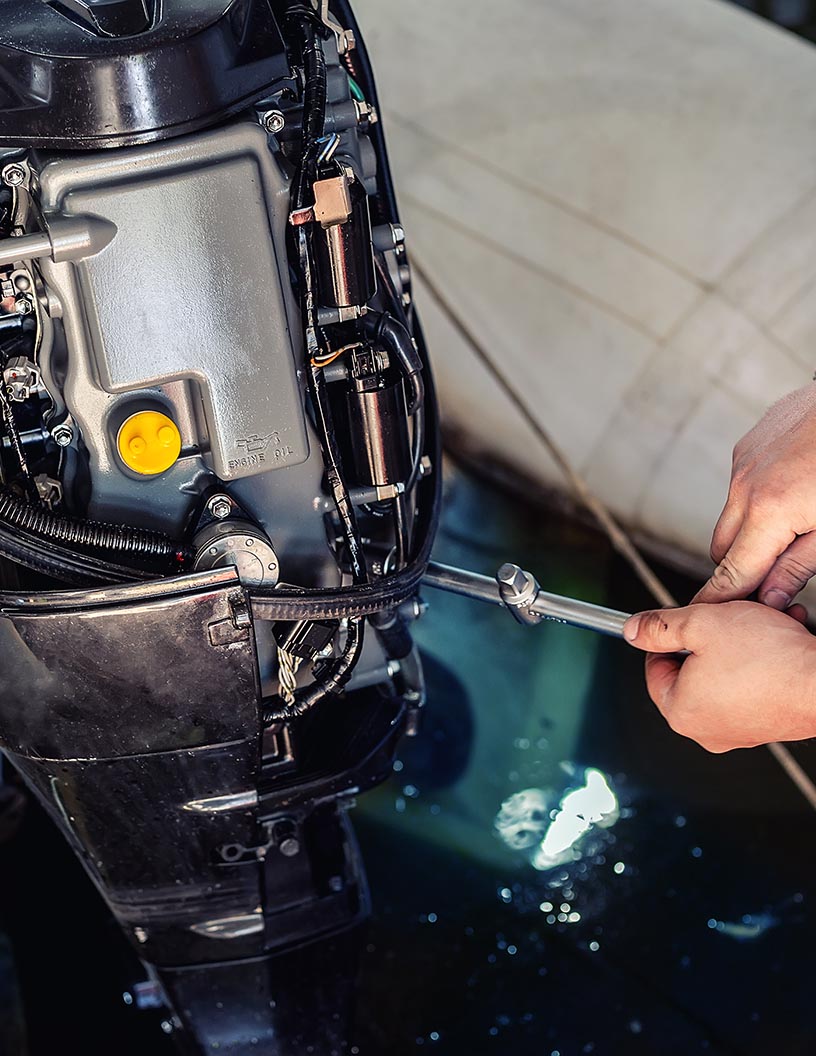
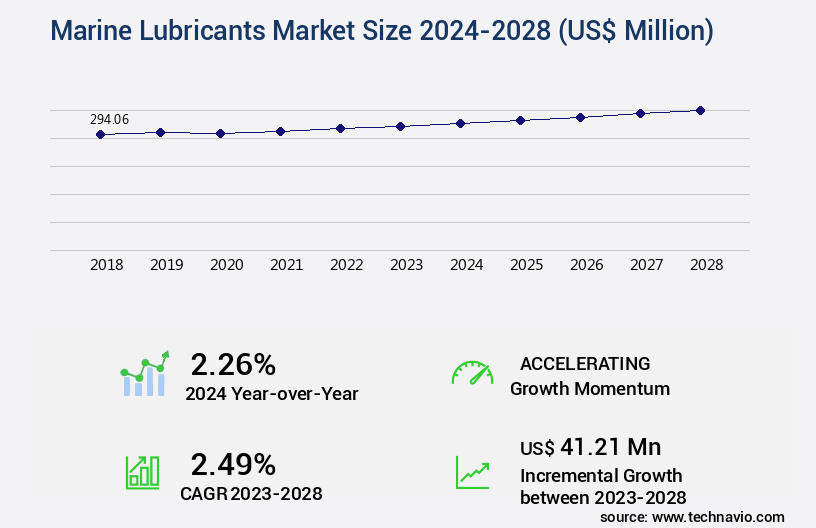
Marine Lubricants Market Size 2024-2028

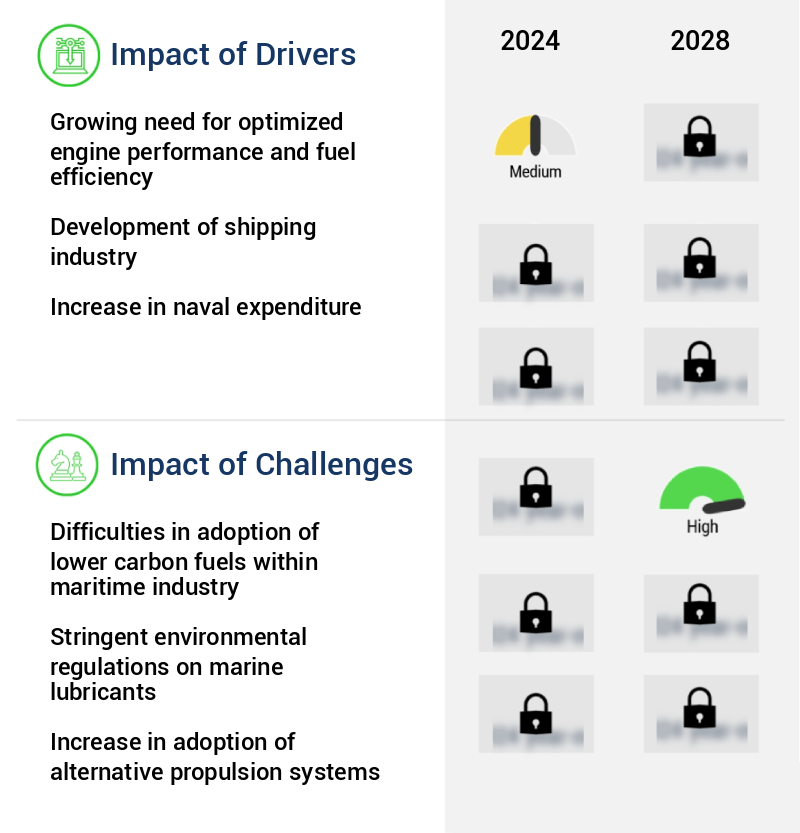
The marine lubricants market size is valued to increase USD 41.21 million, at a CAGR of 2.49% from 2023 to 2028. Growing need for optimized engine performance and fuel efficiency will drive the marine lubricants market.

Major Market Trends & Insights

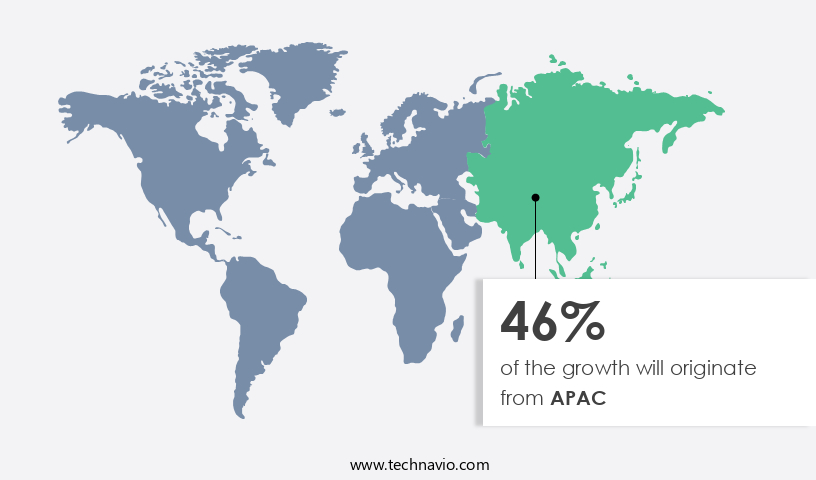
  • APAC dominated the market and accounted for a 46% growth during the forecast period.
  • By Application - Engine oil segment was valued at USD 135.72 million in 2022
  • By Type - Mineral oil-based marine lubricants segment accounted for the largest market revenue share in 2022

Market Size & Forecast

  • Market Opportunities: USD 21.05 million
  • Market Future Opportunities: USD 41.21 million
  • CAGR : 2.49%
  • APAC: Largest market in 2022

Market Summary

  • The market encompasses the production, sales, and distribution of various lubricants used in marine applications. This dynamic market is driven by the growing need for optimized engine performance and fuel efficiency in the maritime industry. One significant trend shaping the market is the increasing adoption of bio-based lubricants, which accounted for over 10% of the market share in 2020. However, the transition to lower carbon fuels within the maritime industry poses challenges, as traditional lubricants may not be compatible with these alternative energy sources.
  • Despite these hurdles, opportunities abound, particularly in the development of innovative, eco-friendly lubricant solutions. As the maritime sector continues to evolve, the market will remain a crucial player in ensuring the sustainability and efficiency of marine operations.

What will be the Size of the Marine Lubricants Market during the forecast period?

Marine Lubricants Market Size

Get Key Insights on Market Forecast (PDF) Request Free Sample

How is the Marine Lubricants Market Segmented and what are the key trends of market segmentation?

The marine lubricants industry research report provides comprehensive data (region-wise segment analysis), with forecasts and estimates in "USD million" for the period 2024-2028, as well as historical data from 2018-2022 for the following segments.

  • Application
    • Engine oil
    • Hydraulic oil
    • Grease
    • Others
  • Type
    • Mineral oil-based marine lubricants
    • Bio-based marine lubricants
    • Synthetic marine lubricants
  • End-User
    • Commercial Shipping
    • Offshore Vessels
    • Naval Vessels
    • Recreational Boating
  • Geography
    • North America
      • US
      • Canada
    • Europe
      • France
      • Germany
      • Italy
      • UK
    • Middle East and Africa
      • Egypt
      • KSA
      • Oman
      • UAE
    • APAC
      • China
      • India
      • Japan
    • South America
      • Argentina
      • Brazil
    • Rest of World (ROW)

By Application Insights

The engine oil segment is estimated to witness significant growth during the forecast period.

The market experiences significant growth, driven by the engine oil segment, which accounts for a substantial market share. This segment's dominance can be attributed to the large size and increased efficiency of marine engines, leading to shorter drain intervals and higher fuel consumption. Marine engine lubricants are categorized into trunk piston engine oils (TPEOs) and marine diesel cylinder lubricants (MDCLs). TPEOs are primarily used for lubricating four-stroke engines in cruise and coastal ships, while MDCLs are utilized in two-stroke engines of large container and cargo ships. The demand for marine lubricants is fueled by advancements in lubricant technology, such as bearing lubrication design, lubricant rheology, oxidation stability testing, and friction modifier impact.

Synthetic ester lubricants, pour point depressants, extreme pressure additives, and corrosion inhibitor efficacy are essential components of marine lubricants that contribute to their popularity. Shipboard oil management, oil condition monitoring, tribological performance, emission reduction benefits, turbine oil degradation, gear oil formulation, biodegradable lubricants, hydraulic fluid properties, oil filtration systems, engine oil viscosity, grease lubrication systems, cylinder oil additives, and environmental regulations are key considerations in the market. Moreover, the market is witnessing the development of viscosity index improvers for lubricant life extension, detergent dispersant function, wear particle analysis, anti-wear properties, sealing technology, and marine engine lubrication.

Fouling prevention methods, such as those related to cylinder liner and piston ring fouling, are also gaining importance in the market. The market is expected to grow further due to the increasing focus on fuel efficiency gains, improved engine performance, and the need for eco-friendly lubricants. In terms of specific numerical data, the engine oil segment currently holds a 60% market share, with an estimated 45% of marine engines using TPEOs and 55% using MDCLs. Additionally, industry experts predict that the market will expand by 18% in the next five years, with the engine oil segment accounting for 15% of this growth.

These figures reflect the market's ongoing evolution and the growing importance of marine lubricants in the maritime industry.

Marine Lubricants Market Size

Request Free Sample

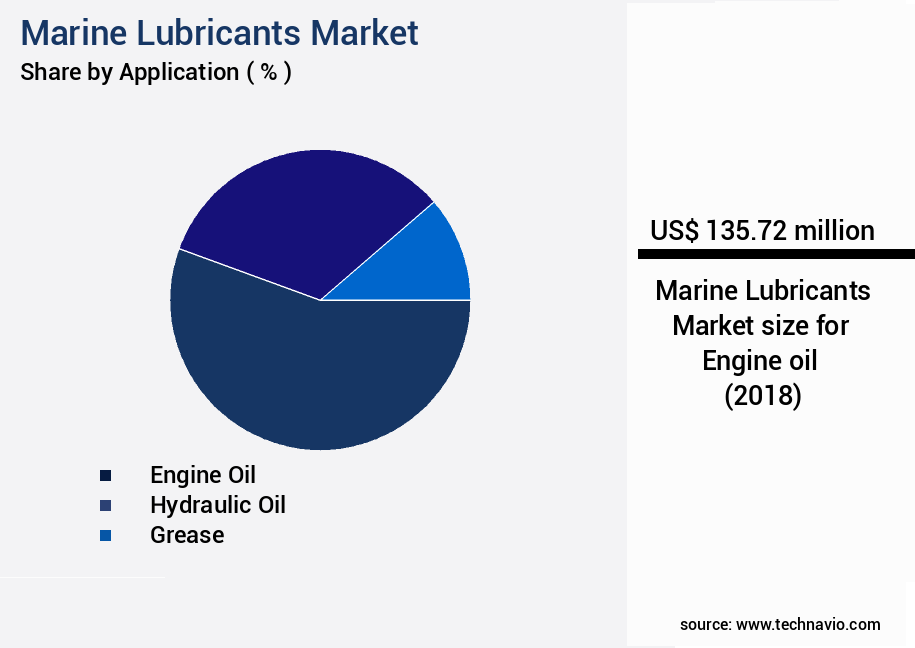
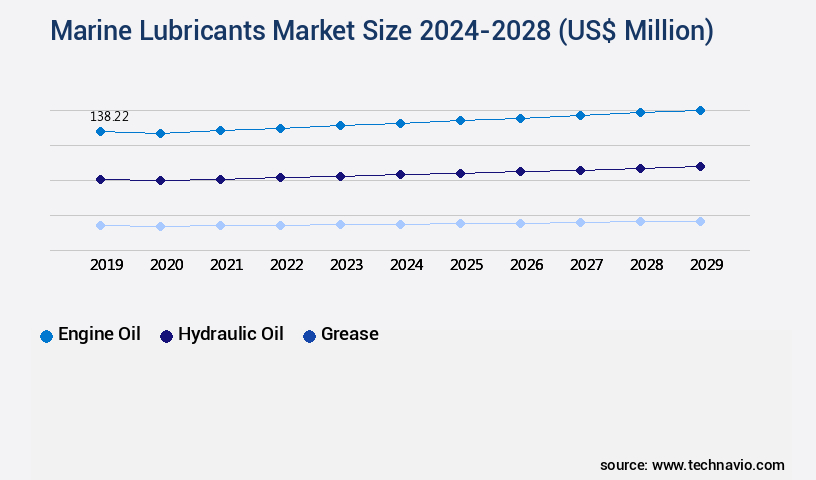
The Engine oil segment was valued at USD 135.72 million in 2018 and showed a gradual increase during the forecast period.

Marine Lubricants Market Size

Request Free Sample

Regional Analysis

APAC is estimated to contribute 46% to the growth of the global market during the forecast period.Technavio's analysts have elaborately explained the regional trends and drivers that shape the market during the forecast period.

Marine Lubricants Market Share by Geography

See How Marine Lubricants Market Demand is Rising in APAC Request Free Sample

The market is poised for growth due to escalating investments in shipbuilding, primarily in South Korea, Japan, and China. Government initiatives aimed at enhancing bilateral trading facilities positively influence the marine industry, leading to increased demand for marine lubricants. Furthermore, the expanding focus on the travel and tourism sector is anticipated to significantly impact the marine industry, thereby increasing shipbuilding capacity and fueling the demand for marine lubricants.

Infrastructure development, construction, and expansion in the Asia Pacific region are expected to drive the demand for marine lubricants, stimulating economic growth, boosting trade, and increasing the need for transport and logistics services.

Market Dynamics

Our researchers analyzed the data with 2023 as the base year, along with the key drivers, trends, and challenges. A holistic analysis of drivers will help companies refine their marketing strategies to gain a competitive advantage.

The market is a critical sector in the global maritime industry, encompassing a diverse range of products designed to ensure the optimal performance and longevity of marine engines and machinery. Key considerations in this market include engine oil viscosity grade selection, cylinder liner wear reduction strategies, and the effects of extreme pressure additives. One significant challenge in marine lubrication is maintaining oxidation stability, which is crucial for preventing corrosion and extending lubricant life. Pour point depressant performance testing plays a vital role in ensuring lubricants remain fluid in extreme temperatures. Comparatively, lubricant base stock properties comparison is essential for selecting the most suitable options based on factors such as cost, performance, and environmental impact.

Total base number and lubricant degradation are essential aspects of marine engine lubrication system design. Advanced oil filtration system technology, such as centrifugation and microfiltration, can significantly extend lubricant life and improve fuel efficiency. Moreover, emission reduction through lubricant optimization is a growing concern, with biodegradable lubricant performance evaluation gaining increasing attention. Synthetic ester lubricants have emerged as a popular choice due to their superior performance in extreme conditions and environmental benefits. Hydraulic fluid properties under high pressure are another critical factor, with corrosion inhibitor efficacy in marine environments being a significant concern. In terms of market dynamics, the detergent dispersant function and engine cleanliness are essential for maintaining engine performance and reducing wear particle analysis for condition monitoring.

Fuel efficiency improvements through lubrication are a significant driver, with more than 60% of marine operators reporting fuel savings of up to 5% after implementing advanced lubrication strategies. Fouling prevention methods in marine engines, such as the use of biocides and antifouling coatings, are also a crucial aspect of marine lubrication. The market for marine lubricants is highly competitive, with a minority of players, less than 20%, dominating the high-end instrument market through innovation and technical expertise.

Marine Lubricants Market Size

What are the key market drivers leading to the rise in the adoption of Marine Lubricants Industry?

  • The increasing demand for engines that deliver optimal performance and improved fuel efficiency serves as the primary market driver. 
  • The market experiences continuous growth due to the increasing emphasis on fuel efficiency and engine performance in the maritime industry. Marine lubricants play a crucial role in reducing friction, wear, and corrosion within ship engines, gears, and other critical components. Advanced marine lubricants enhance maritime operations by ensuring smooth engine operation, minimizing energy losses, and reducing fuel consumption. The use of efficient lubrication translates into cost savings and environmental benefits, making it a significant investment for maritime businesses. Moreover, marine lubricants cater to diverse applications across various sectors, including container shipping, tanker vessels, and cruise liners. The market reflects ongoing market activities and evolving patterns, with manufacturers focusing on developing high-performance lubricants to cater to the unique demands of the maritime sector.
  • By incorporating advanced technologies and formulations, marine lubricant manufacturers aim to provide solutions that meet the stringent requirements of modern maritime operations while contributing to sustainable and eco-friendly practices. In summary, the market represents a dynamic and evolving sector, driven by the need for fuel efficiency, engine performance, and environmental sustainability. Advanced marine lubricants play a pivotal role in enhancing maritime operations and reducing operational costs, making them an essential investment for businesses in the maritime industry.

What are the market trends shaping the Marine Lubricants Industry?

  • The use of bio-based lubricants is gaining increasing popularity in the market. This emerging trend is set to shape the industry in the upcoming period.
  • Bio-based lubricants, derived from renewable feedstocks like plant-oil and sugar, have gained traction as a sustainable alternative to petroleum-based lubricants. Production processes, such as fermentation, ultrafiltration, and crystallization, transform these feedstocks into eco-friendly lubricants. For instance, marine lubricants manufactured through fermentation utilize a sucrose solution as feedstock, which is hydrolyzed into fructose and glucose for fermentation. The adoption of these environment-friendly marine lubricants is on the rise, particularly in developed economies like Canada, the US, and Germany, due to their reduced environmental impact.
  • By decreasing the volume of volatile organic compounds (VOCs) in the air and minimizing the toxicity of emissions from related industries, these bio-based lubricants contribute significantly to ecological preservation. The preference for sustainable and eco-friendly solutions is a growing trend across various industries, making bio-based lubricants a promising market with continuous development and expanding applications.

What challenges does the Marine Lubricants Industry face during its growth?

  • The maritime industry's growth is hindered by the challenges posed by the adoption of lower carbon fuels, which is a significant issue requiring immediate attention. 
  • The market is undergoing significant transformations as the maritime industry embraces the shift towards lower carbon fuels. Regulatory pressure to decrease greenhouse gas emissions and combat climate change has propelled shipping companies towards cleaner alternatives, such as liquefied natural gas (LNG), biofuels, and hydrogen-fuels. This transition poses challenges for the market due to the distinct chemical compositions and combustion properties of these alternative fuels. For instance, marine lubricants must be reformulated to maintain compatibility and optimal performance with LNG, which has a lower viscosity and different cooling properties than traditional fuels like heavy fuel oil (HFO) and marine diesel oil (MDO).
  • Similarly, biofuels and hydrogen-fuels require lubricants specifically designed to handle their unique chemical properties. This ongoing evolution underscores the importance of continuous innovation and adaptation within the market to cater to the evolving needs of the maritime industry.

Exclusive Technavio Analysis on Customer Landscape

The marine lubricants market forecasting report includes the adoption lifecycle of the market, covering from the innovator's stage to the laggard's stage. It focuses on adoption rates in different regions based on penetration. Furthermore, the marine lubricants market report also includes key purchase criteria and drivers of price sensitivity to help companies evaluate and develop their market growth analysis strategies.

Marine Lubricants Market Share by Geography

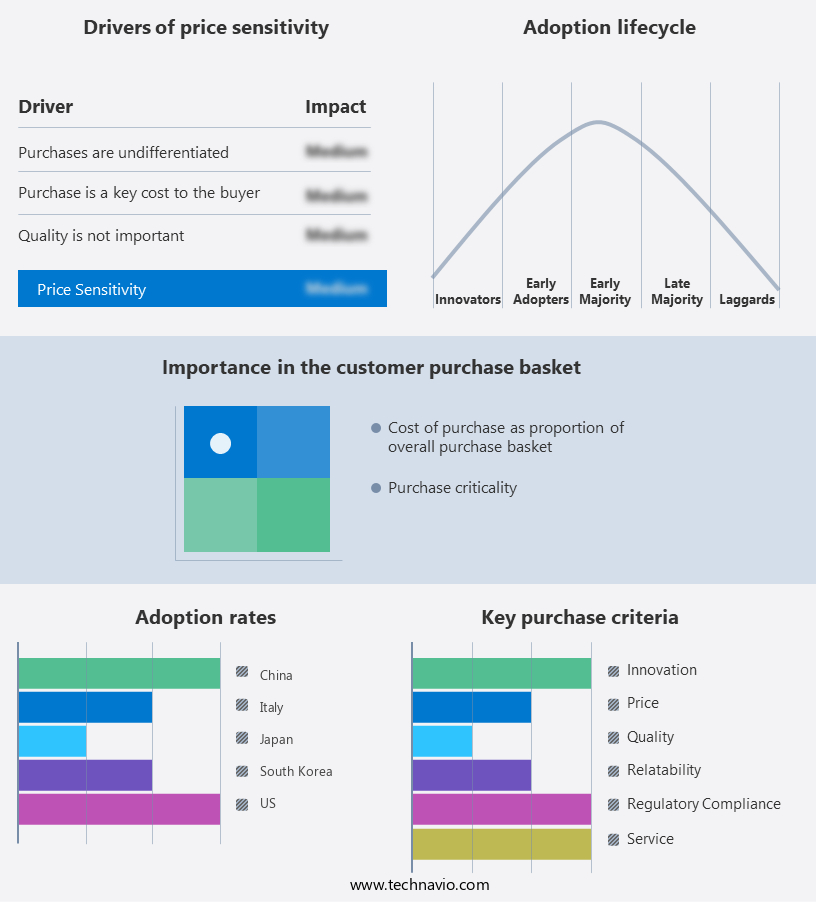
 Customer Landscape of Marine Lubricants Industry

Competitive Landscape

Companies are implementing various strategies, such as strategic alliances, marine lubricants market forecast, partnerships, mergers and acquisitions, geographical expansion, and product/service launches, to enhance their presence in the industry.

BP plc - The company, a global leader in marine lubricants, provides innovative solutions for various engine types. Their offerings include Castrol Cyltech, MHP, HLX, and TLX Xtra, catering to high, medium, and low-speed engines. These premium lubricants, marketed under the Castrol Ltd. Subsidiary, enhance engine performance and efficiency.

The industry research and growth report includes detailed analyses of the competitive landscape of the market and information about key companies, including:

  • BP plc
  • Castrol
  • Chevron Corporation
  • China Petroleum & Chemical
  • Croda International
  • ENI S.p.A.
  • ExxonMobil Corporation
  • Fuchs Petrolub SE
  • Gazprom Neft
  • Gulf Oil International
  • Idemitsu Kosan
  • Indian Oil Corporation
  • JXTG Nippon Oil & Energy
  • KLK Oleo
  • Lukoil
  • Petrobras
  • Petronas
  • Shell plc
  • TotalEnergies
  • Valvoline

Qualitative and quantitative analysis of companies has been conducted to help clients understand the wider business environment as well as the strengths and weaknesses of key industry players. Data is qualitatively analyzed to categorize companies as pure play, category-focused, industry-focused, and diversified; it is quantitatively analyzed to categorize companies as dominant, leading, strong, tentative, and weak.

Recent Development and News in Marine Lubricants Market

  • In January 2024, Shell PLC announced the launch of its new marine lubricant, Shell Alexia, designed to reduce greenhouse gas emissions by up to 10% compared to conventional marine lubricants. This innovative product was developed in response to growing demand for eco-friendly solutions in the maritime industry (Shell press release).
  • In March 2024, ExxonMobil Corporation and TotalEnergies SE entered into a strategic partnership to jointly develop and commercialize next-generation marine lubricants. The collaboration aims to leverage each company's expertise and resources to create advanced, low-emission lubricants, addressing the industry's increasing focus on sustainability (ExxonMobil press release).
  • In May 2024, Chevron Corporation completed the acquisition of Oronite LLC, a leading additives technology company, for approximately USD2.5 billion. The acquisition is expected to significantly expand Chevron's marine lubricants product portfolio and strengthen its position in the global market (Chevron press release).
  • In February 2025, the International Maritime Organization (IMO) approved new regulations on the use of low-viscosity marine lubricants to reduce frictional losses and improve fuel efficiency. The new rules, set to take effect in 2026, are expected to lead to substantial energy savings and reduced greenhouse gas emissions (IMO press release).

Dive into Technavio's robust research methodology, blending expert interviews, extensive data synthesis, and validated models for unparalleled Marine Lubricants Market insights. See full methodology.

Market Scope

Report Coverage

Details

Page number

180

Base year

2023

Historic period

2018-2022

Forecast period

2024-2028

Growth momentum & CAGR

Accelerate at a CAGR of 2.49%

Market growth 2024-2028

USD 41.21 million

Market structure

Fragmented

YoY growth 2023-2024(%)

2.26

Key countries

US, Canada, Germany, UK, Italy, France, China, India, Japan, Brazil, Egypt, UAE, Oman, Argentina, KSA, UAE, Brazil, and Rest of World (ROW)

Competitive landscape

Leading Companies, Market Positioning of Companies, Competitive Strategies, and Industry Risks

Request Free Sample

Research Analyst Overview

  • In the dynamic and evolving the market, bearing lubrication design plays a crucial role in ensuring the smooth operation of ships' engines and machinery. Lubricant rheology, a critical aspect of design, influences the fluid's flow properties, ensuring optimal lubrication under varying conditions. Oxidation stability testing is essential to assess lubricants' resistance to oxidation, which can impact their performance and lifespan. Synthetic ester lubricants, with their superior oxidation stability, have gained popularity in this regard. Fuel efficiency gains are a significant focus in the marine industry, with lubricants contributing to this objective. Pour point depressants and friction modifiers are among the additives used to enhance fuel efficiency by reducing engine wear and improving lubricant flow at low temperatures.
  • Extreme pressure additives are another essential component, enabling lubricants to perform under high loads and pressures, common in marine applications. Shipboard oil management systems facilitate efficient use and monitoring of lubricants, while lubricant base stocks undergo continuous research and development to improve tribological performance and emission reduction benefits. Environmental regulations drive innovation in the market. Biodegradable lubricants, for instance, offer a sustainable alternative, while hydraulic fluid properties and oil filtration systems contribute to reducing environmental impact. Turbine oil degradation and gear oil formulation are ongoing areas of research, with a focus on enhancing lubricant life extension and detergent dispersant function.
  • Wear particle analysis and anti-wear properties are also essential for maintaining machinery health and extending equipment life. Sealing technology and marine engine lubrication continue to evolve, with a focus on fouling prevention methods and viscosity index improvers. The market's continuous unfolding is marked by the development of new additives and technologies, ensuring that marine lubricants remain at the forefront of technological advancements.

What are the Key Data Covered in this Marine Lubricants Market Research and Growth Report?

  • What is the expected growth of the Marine Lubricants Market between 2024 and 2028?

    • USD 41.21 million, at a CAGR of 2.49%

  • What segmentation does the market report cover?

    • The report segmented by Application (Engine oil, Hydraulic oil, Grease, and Others), Type (Mineral oil-based marine lubricants, Bio-based marine lubricants, and Synthetic marine lubricants), Geography (APAC, Europe, North America, Middle East and Africa, and South America), and End-User (Commercial Shipping, Offshore Vessels, Naval Vessels, and Recreational Boating)

  • Which regions are analyzed in the report?

    • APAC, Europe, North America, Middle East and Africa, and South America

  • What are the key growth drivers and market challenges?

    • Growing need for optimized engine performance and fuel efficiency, Difficulties in adoption of lower carbon fuels within maritime industry

  • Who are the major players in the Marine Lubricants Market?

    • Key Companies BP plc, Castrol, Chevron Corporation, China Petroleum & Chemical, Croda International, ENI S.p.A., ExxonMobil Corporation, Fuchs Petrolub SE, Gazprom Neft, Gulf Oil International, Idemitsu Kosan, Indian Oil Corporation, JXTG Nippon Oil & Energy, KLK Oleo, Lukoil, Petrobras, Petronas, Shell plc, TotalEnergies, and Valvoline

Market Research Insights

  • The market encompasses a diverse range of products designed to ensure the optimal performance and longevity of marine engines and equipment. Two critical aspects of marine lubricants are hydrolytic stability and oil filter efficiency. Hydrolytic stability refers to a lubricant's ability to resist degradation when exposed to water, a common issue in marine applications. In contrast, oil filter efficiency measures the effectiveness of filters in removing contaminants from the lubricant stream. For instance, a high-performance marine engine may require a lubricant with exceptional hydrolytic stability, as prolonged exposure to water can lead to increased engine wear rate and reduced component lifespan.
  • On the other hand, a well-designed oil filtration system can significantly enhance oil filter efficiency, reducing particle counting and oil contamination, thereby contributing to improved system efficiency, reliability, and operational uptime. Moreover, the market continually evolves, with ongoing research focusing on performance benchmarks, lubricant storage and handling procedures, and regulatory compliance. For example, advancements in additive chemistry enable lubricants to provide better friction reduction, energy efficiency, and wear prevention. Additionally, life cycle assessments and cost-saving strategies are increasingly important considerations, as environmental impact becomes a more significant concern for marine operators. Ultimately, the selection of the appropriate base oil and adherence to thermal stability and lubricant compatibility guidelines are essential to ensuring the long-term reliability and efficiency of marine equipment.

We can help! Our analysts can customize this marine lubricants market research report to meet your requirements.

Get in touch

1 Executive Summary

  • 1.1 Market overview
    • Exhibit 01: Executive Summary – Chart on Market Overview
    • Exhibit 02: Executive Summary – Data Table on Market Overview
    • Exhibit 03: Executive Summary – Chart on Global Market Characteristics
    • Exhibit 04: Executive Summary – Chart on Market by Geography
    • Exhibit 05: Executive Summary – Chart on Market Segmentation by Application
    • Exhibit 06: Executive Summary – Chart on Market Segmentation by Type
    • Exhibit 07: Executive Summary – Chart on Incremental Growth
    • Exhibit 08: Executive Summary – Data Table on Incremental Growth
    • Exhibit 09: Executive Summary – Chart on Vendor Market Positioning

2 Market Landscape

  • 2.1 Market ecosystem
    • Exhibit 10: Parent market
    • Exhibit 11: Market Characteristics

3 Market Sizing

  • 3.1 Market definition
    • Exhibit 12: Offerings of vendors included in the market definition
  • 3.2 Market segment analysis
    • Exhibit 13: Market segments
  • 3.3 Market size 2023
    • 3.4 Market outlook: Forecast for 2023-2028
      • Exhibit 14: Chart on Global - Market size and forecast 2023-2028 ($ million)
      • Exhibit 15: Data Table on Global - Market size and forecast 2023-2028 ($ million)
      • Exhibit 16: Chart on Global Market: Year-over-year growth 2023-2028 (%)
      • Exhibit 17: Data Table on Global Market: Year-over-year growth 2023-2028 (%)

    4 Historic Market Size

    • 4.1 Global marine lubricants market 2018 - 2022
      • Exhibit 18: Historic Market Size – Data Table on global marine lubricants market 2018 - 2022 ($ million)
    • 4.2 Application Segment Analysis 2018 - 2022
      • Exhibit 19: Historic Market Size – Application Segment 2018 - 2022 ($ million)
    • 4.3 Type Segment Analysis 2018 - 2022
      • Exhibit 20: Historic Market Size – Type Segment 2018 - 2022 ($ million)
    • 4.4 Geography Segment Analysis 2018 - 2022
      • Exhibit 21: Historic Market Size – Geography Segment 2018 - 2022 ($ million)
    • 4.5 Country Segment Analysis 2018 - 2022
      • Exhibit 22: Historic Market Size – Country Segment 2018 - 2022 ($ million)

    5 Five Forces Analysis

    • 5.1 Five forces summary
      • Exhibit 23: Five forces analysis - Comparison between 2023 and 2028
    • 5.2 Bargaining power of buyers
      • Exhibit 24: Chart on Bargaining power of buyers – Impact of key factors 2023 and 2028
    • 5.3 Bargaining power of suppliers
      • Exhibit 25: Bargaining power of suppliers – Impact of key factors in 2023 and 2028
    • 5.4 Threat of new entrants
      • Exhibit 26: Threat of new entrants – Impact of key factors in 2023 and 2028
    • 5.5 Threat of substitutes
      • Exhibit 27: Threat of substitutes – Impact of key factors in 2023 and 2028
    • 5.6 Threat of rivalry
      • Exhibit 28: Threat of rivalry – Impact of key factors in 2023 and 2028
    • 5.7 Market condition
      • Exhibit 29: Chart on Market condition - Five forces 2023 and 2028

    6 Market Segmentation by Application

    • 6.1 Market segments
      • Chart on Application - Market share (2023-2028) (%)
      • Data Table on Application - Market share (2023-2028) (%)
    • 6.2 Comparison by Application
      • Chart on Comparison by Application
      • Data Table on Comparison by Application
    • 6.3 Engine oil - Market size and forecast (2023-2028)
      • Chart on Engine oil - Market size and forecast (2023-2028) ($ million)
      • Data Table on Engine oil - Market size and forecast (2023-2028) ($ million)
      • Chart on Engine oil - Year-over-year growth (2023-2028) (%)
      • Data Table on Engine oil - Year-over-year growth (2023-2028) (%)
    • 6.4 Hydraulic oil - Market size and forecast (2023-2028)
      • Chart on Hydraulic oil - Market size and forecast (2023-2028) ($ million)
      • Data Table on Hydraulic oil - Market size and forecast (2023-2028) ($ million)
      • Chart on Hydraulic oil - Year-over-year growth (2023-2028) (%)
      • Data Table on Hydraulic oil - Year-over-year growth (2023-2028) (%)
    • 6.5 Grease - Market size and forecast (2023-2028)
      • Chart on Grease - Market size and forecast (2023-2028) ($ million)
      • Data Table on Grease - Market size and forecast (2023-2028) ($ million)
      • Chart on Grease - Year-over-year growth (2023-2028) (%)
      • Data Table on Grease - Year-over-year growth (2023-2028) (%)
    • 6.6 Others - Market size and forecast (2023-2028)
      • Chart on Others - Market size and forecast (2023-2028) ($ million)
      • Data Table on Others - Market size and forecast (2023-2028) ($ million)
      • Chart on Others - Year-over-year growth (2023-2028) (%)
      • Data Table on Others - Year-over-year growth (2023-2028) (%)
    • 6.7 Market opportunity by Application
      • Market opportunity by Application ($ million)
      • Data Table on Market opportunity by Application ($ million)

    7 Market Segmentation by Type

    • 7.1 Market segments
      • Chart on Type - Market share (2023-2028) (%)
      • Data Table on Type - Market share (2023-2028) (%)
    • 7.2 Comparison by Type
      • Chart on Comparison by Type
      • Data Table on Comparison by Type
    • 7.3 Mineral oil-based marine lubricants - Market size and forecast (2023-2028)
      • Chart on Mineral oil-based marine lubricants - Market size and forecast (2023-2028) ($ million)
      • Data Table on Mineral oil-based marine lubricants - Market size and forecast (2023-2028) ($ million)
      • Chart on Mineral oil-based marine lubricants - Year-over-year growth (2023-2028) (%)
      • Data Table on Mineral oil-based marine lubricants - Year-over-year growth (2023-2028) (%)
    • 7.4 Bio-based marine lubricants - Market size and forecast (2023-2028)
      • Chart on Bio-based marine lubricants - Market size and forecast (2023-2028) ($ million)
      • Data Table on Bio-based marine lubricants - Market size and forecast (2023-2028) ($ million)
      • Chart on Bio-based marine lubricants - Year-over-year growth (2023-2028) (%)
      • Data Table on Bio-based marine lubricants - Year-over-year growth (2023-2028) (%)
    • 7.5 Synthetic marine lubricants - Market size and forecast (2023-2028)
      • Chart on Synthetic marine lubricants - Market size and forecast (2023-2028) ($ million)
      • Data Table on Synthetic marine lubricants - Market size and forecast (2023-2028) ($ million)
      • Chart on Synthetic marine lubricants - Year-over-year growth (2023-2028) (%)
      • Data Table on Synthetic marine lubricants - Year-over-year growth (2023-2028) (%)
    • 7.6 Market opportunity by Type
      • Market opportunity by Type ($ million)
      • Data Table on Market opportunity by Type ($ million)

    8 Market Segmentation by End-User

    • 8.1 Market segments
      • Chart on End-User - Market share (2023-2028) (%)
      • Data Table on End-User - Market share (2023-2028) (%)
    • 8.2 Comparison by End-User
      • Chart on Comparison by End-User
      • Data Table on Comparison by End-User
    • 8.3 Commercial Shipping - Market size and forecast (2023-2028)
      • Chart on Commercial Shipping - Market size and forecast (2023-2028) ($ million)
      • Data Table on Commercial Shipping - Market size and forecast (2023-2028) ($ million)
      • Chart on Commercial Shipping - Year-over-year growth (2023-2028) (%)
      • Data Table on Commercial Shipping - Year-over-year growth (2023-2028) (%)
    • 8.4 Offshore Vessels - Market size and forecast (2023-2028)
      • Chart on Offshore Vessels - Market size and forecast (2023-2028) ($ million)
      • Data Table on Offshore Vessels - Market size and forecast (2023-2028) ($ million)
      • Chart on Offshore Vessels - Year-over-year growth (2023-2028) (%)
      • Data Table on Offshore Vessels - Year-over-year growth (2023-2028) (%)
    • 8.5 Naval Vessels - Market size and forecast (2023-2028)
      • Chart on Naval Vessels - Market size and forecast (2023-2028) ($ million)
      • Data Table on Naval Vessels - Market size and forecast (2023-2028) ($ million)
      • Chart on Naval Vessels - Year-over-year growth (2023-2028) (%)
      • Data Table on Naval Vessels - Year-over-year growth (2023-2028) (%)
    • 8.6 Recreational Boating - Market size and forecast (2023-2028)
      • Chart on Recreational Boating - Market size and forecast (2023-2028) ($ million)
      • Data Table on Recreational Boating - Market size and forecast (2023-2028) ($ million)
      • Chart on Recreational Boating - Year-over-year growth (2023-2028) (%)
      • Data Table on Recreational Boating - Year-over-year growth (2023-2028) (%)
    • 8.7 Market opportunity by End-User
      • Market opportunity by End-User ($ million)
      • Data Table on Market opportunity by End-User ($ million)

    8 Customer Landscape

    • 8.1 Customer landscape overview
      • Exhibit 70: Analysis of price sensitivity, lifecycle, customer purchase basket, adoption rates, and purchase criteria

    9 Geographic Landscape

    • 9.1 Geographic segmentation
      • Exhibit 71: Chart on Market share by geography 2023-2028 (%)
      • Exhibit 72: Data Table on Market share by geography 2023-2028 (%)
    • 9.2 Geographic comparison
      • Exhibit 73: Chart on Geographic comparison
      • Exhibit 74: Data Table on Geographic comparison
    • 9.3 APAC - Market size and forecast 2023-2028
      • Exhibit 75: Chart on APAC - Market size and forecast 2023-2028 ($ million)
      • Exhibit 76: Data Table on APAC - Market size and forecast 2023-2028 ($ million)
      • Exhibit 77: Chart on APAC - Year-over-year growth 2023-2028 (%)
      • Exhibit 78: Data Table on APAC - Year-over-year growth 2023-2028 (%)
    • 9.4 Europe - Market size and forecast 2023-2028
      • Exhibit 79: Chart on Europe - Market size and forecast 2023-2028 ($ million)
      • Exhibit 80: Data Table on Europe - Market size and forecast 2023-2028 ($ million)
      • Exhibit 81: Chart on Europe - Year-over-year growth 2023-2028 (%)
      • Exhibit 82: Data Table on Europe - Year-over-year growth 2023-2028 (%)
    • 9.5 North America - Market size and forecast 2023-2028
      • Exhibit 83: Chart on North America - Market size and forecast 2023-2028 ($ million)
      • Exhibit 84: Data Table on North America - Market size and forecast 2023-2028 ($ million)
      • Exhibit 85: Chart on North America - Year-over-year growth 2023-2028 (%)
      • Exhibit 86: Data Table on North America - Year-over-year growth 2023-2028 (%)
    • 9.6 Middle East and Africa - Market size and forecast 2023-2028
      • Exhibit 87: Chart on Middle East and Africa - Market size and forecast 2023-2028 ($ million)
      • Exhibit 88: Data Table on Middle East and Africa - Market size and forecast 2023-2028 ($ million)
      • Exhibit 89: Chart on Middle East and Africa - Year-over-year growth 2023-2028 (%)
      • Exhibit 90: Data Table on Middle East and Africa - Year-over-year growth 2023-2028 (%)
    • 9.7 South America - Market size and forecast 2023-2028
      • Exhibit 91: Chart on South America - Market size and forecast 2023-2028 ($ million)
      • Exhibit 92: Data Table on South America - Market size and forecast 2023-2028 ($ million)
      • Exhibit 93: Chart on South America - Year-over-year growth 2023-2028 (%)
      • Exhibit 94: Data Table on South America - Year-over-year growth 2023-2028 (%)
    • 9.8 China - Market size and forecast 2023-2028
      • Exhibit 95: Chart on China - Market size and forecast 2023-2028 ($ million)
      • Exhibit 96: Data Table on China - Market size and forecast 2023-2028 ($ million)
      • Exhibit 97: Chart on China - Year-over-year growth 2023-2028 (%)
      • Exhibit 98: Data Table on China - Year-over-year growth 2023-2028 (%)
    • 9.9 US - Market size and forecast 2023-2028
      • Exhibit 99: Chart on US - Market size and forecast 2023-2028 ($ million)
      • Exhibit 100: Data Table on US - Market size and forecast 2023-2028 ($ million)
      • Exhibit 101: Chart on US - Year-over-year growth 2023-2028 (%)
      • Exhibit 102: Data Table on US - Year-over-year growth 2023-2028 (%)
    • 9.10 South Korea - Market size and forecast 2023-2028
      • Exhibit 103: Chart on South Korea - Market size and forecast 2023-2028 ($ million)
      • Exhibit 104: Data Table on South Korea - Market size and forecast 2023-2028 ($ million)
      • Exhibit 105: Chart on South Korea - Year-over-year growth 2023-2028 (%)
      • Exhibit 106: Data Table on South Korea - Year-over-year growth 2023-2028 (%)
    • 9.11 Italy - Market size and forecast 2023-2028
      • Exhibit 107: Chart on Italy - Market size and forecast 2023-2028 ($ million)
      • Exhibit 108: Data Table on Italy - Market size and forecast 2023-2028 ($ million)
      • Exhibit 109: Chart on Italy - Year-over-year growth 2023-2028 (%)
      • Exhibit 110: Data Table on Italy - Year-over-year growth 2023-2028 (%)
    • 9.12 Japan - Market size and forecast 2023-2028
      • Exhibit 111: Chart on Japan - Market size and forecast 2023-2028 ($ million)
      • Exhibit 112: Data Table on Japan - Market size and forecast 2023-2028 ($ million)
      • Exhibit 113: Chart on Japan - Year-over-year growth 2023-2028 (%)
      • Exhibit 114: Data Table on Japan - Year-over-year growth 2023-2028 (%)
    • 9.13 Market opportunity by geography
      • Exhibit 115: Market opportunity by geography ($ million)
      • Exhibit 116: Data Tables on Market opportunity by geography ($ million)
    • 10.14 Canada - Market size and forecast (2023-2028)
      • Chart on Canada - Market size and forecast (2023-2028) ($ million)
      • Data Table on Canada - Market size and forecast (2023-2028) ($ million)
      • Chart on Canada - Year-over-year growth (2023-2028) (%)
      • Data Table on Canada - Year-over-year growth (2023-2028) (%)
    • 10.15 Germany - Market size and forecast (2023-2028)
      • Chart on Germany - Market size and forecast (2023-2028) ($ million)
      • Data Table on Germany - Market size and forecast (2023-2028) ($ million)
      • Chart on Germany - Year-over-year growth (2023-2028) (%)
      • Data Table on Germany - Year-over-year growth (2023-2028) (%)
    • 10.16 UK - Market size and forecast (2023-2028)
      • Chart on UK - Market size and forecast (2023-2028) ($ million)
      • Data Table on UK - Market size and forecast (2023-2028) ($ million)
      • Chart on UK - Year-over-year growth (2023-2028) (%)
      • Data Table on UK - Year-over-year growth (2023-2028) (%)
    • 10.17 France - Market size and forecast (2023-2028)
      • Chart on France - Market size and forecast (2023-2028) ($ million)
      • Data Table on France - Market size and forecast (2023-2028) ($ million)
      • Chart on France - Year-over-year growth (2023-2028) (%)
      • Data Table on France - Year-over-year growth (2023-2028) (%)
    • 10.18 India - Market size and forecast (2023-2028)
      • Chart on India - Market size and forecast (2023-2028) ($ million)
      • Data Table on India - Market size and forecast (2023-2028) ($ million)
      • Chart on India - Year-over-year growth (2023-2028) (%)
      • Data Table on India - Year-over-year growth (2023-2028) (%)
    • 10.19 Brazil - Market size and forecast (2023-2028)
      • Chart on Brazil - Market size and forecast (2023-2028) ($ million)
      • Data Table on Brazil - Market size and forecast (2023-2028) ($ million)
      • Chart on Brazil - Year-over-year growth (2023-2028) (%)
      • Data Table on Brazil - Year-over-year growth (2023-2028) (%)
    • 10.20 Egypt - Market size and forecast (2023-2028)
      • Chart on Egypt - Market size and forecast (2023-2028) ($ million)
      • Data Table on Egypt - Market size and forecast (2023-2028) ($ million)
      • Chart on Egypt - Year-over-year growth (2023-2028) (%)
      • Data Table on Egypt - Year-over-year growth (2023-2028) (%)
    • 10.21 UAE - Market size and forecast (2023-2028)
      • Chart on UAE - Market size and forecast (2023-2028) ($ million)
      • Data Table on UAE - Market size and forecast (2023-2028) ($ million)
      • Chart on UAE - Year-over-year growth (2023-2028) (%)
      • Data Table on UAE - Year-over-year growth (2023-2028) (%)
    • 10.22 Oman - Market size and forecast (2023-2028)
      • Chart on Oman - Market size and forecast (2023-2028) ($ million)
      • Data Table on Oman - Market size and forecast (2023-2028) ($ million)
      • Chart on Oman - Year-over-year growth (2023-2028) (%)
      • Data Table on Oman - Year-over-year growth (2023-2028) (%)
    • 10.23 Argentina - Market size and forecast (2023-2028)
      • Chart on Argentina - Market size and forecast (2023-2028) ($ million)
      • Data Table on Argentina - Market size and forecast (2023-2028) ($ million)
      • Chart on Argentina - Year-over-year growth (2023-2028) (%)
      • Data Table on Argentina - Year-over-year growth (2023-2028) (%)
    • 10.24 KSA - Market size and forecast (2023-2028)
      • Chart on KSA - Market size and forecast (2023-2028) ($ million)
      • Data Table on KSA - Market size and forecast (2023-2028) ($ million)
      • Chart on KSA - Year-over-year growth (2023-2028) (%)
      • Data Table on KSA - Year-over-year growth (2023-2028) (%)
    • 10.25 UAE - Market size and forecast (2023-2028)
      • Chart on UAE - Market size and forecast (2023-2028) ($ million)
      • Data Table on UAE - Market size and forecast (2023-2028) ($ million)
      • Chart on UAE - Year-over-year growth (2023-2028) (%)
      • Data Table on UAE - Year-over-year growth (2023-2028) (%)
    • 10.26 Brazil - Market size and forecast (2023-2028)
      • Chart on Brazil - Market size and forecast (2023-2028) ($ million)
      • Data Table on Brazil - Market size and forecast (2023-2028) ($ million)
      • Chart on Brazil - Year-over-year growth (2023-2028) (%)
      • Data Table on Brazil - Year-over-year growth (2023-2028) (%)
    • 10.27 Rest of World (ROW) - Market size and forecast (2023-2028)
      • Chart on Rest of World (ROW) - Market size and forecast (2023-2028) ($ million)
      • Data Table on Rest of World (ROW) - Market size and forecast (2023-2028) ($ million)
      • Chart on Rest of World (ROW) - Year-over-year growth (2023-2028) (%)
      • Data Table on Rest of World (ROW) - Year-over-year growth (2023-2028) (%)

    10 Drivers, Challenges, and Trends

    • 10.1 Market drivers
      • 10.2 Market challenges
        • 10.3 Impact of drivers and challenges
          • Exhibit 117: Impact of drivers and challenges in 2023 and 2028
        • 10.4 Market trends

          11 Vendor Landscape

          • 11.1 Overview
            • 11.2 Vendor landscape
              • Exhibit 118: Overview on Criticality of inputs and Factors of differentiation
            • 11.3 Landscape disruption
              • Exhibit 119: Overview on factors of disruption
            • 11.4 Industry risks
              • Exhibit 120: Impact of key risks on business

            13 Competitive Analysis

            • 13.1 Companies profiled
              • Companies covered
            • 13.2 Market positioning of companies
              • Matrix on companies position and classification
            • 13.3 BP plc
              • BP plc - Overview
              • BP plc - Product / Service
              • BP plc - Key offerings
            • 13.4 Castrol
              • Castrol - Overview
              • Castrol - Product / Service
              • Castrol - Key offerings
            • 13.5 Chevron Corporation
              • Chevron Corporation - Overview
              • Chevron Corporation - Product / Service
              • Chevron Corporation - Key offerings
            • 13.6 China Petroleum & Chemical
              • China Petroleum & Chemical - Overview
              • China Petroleum & Chemical - Product / Service
              • China Petroleum & Chemical - Key offerings
            • 13.7 Croda International
              • Croda International - Overview
              • Croda International - Product / Service
              • Croda International - Key offerings
            • 13.8 ENI S.p.A.
              • ENI S.p.A. - Overview
              • ENI S.p.A. - Product / Service
              • ENI S.p.A. - Key offerings
            • 13.9 ExxonMobil Corporation
              • ExxonMobil Corporation - Overview
              • ExxonMobil Corporation - Product / Service
              • ExxonMobil Corporation - Key offerings
            • 13.10 Fuchs Petrolub SE
              • Fuchs Petrolub SE - Overview
              • Fuchs Petrolub SE - Product / Service
              • Fuchs Petrolub SE - Key offerings
            • 13.11 Gazprom Neft
              • Gazprom Neft - Overview
              • Gazprom Neft - Product / Service
              • Gazprom Neft - Key offerings
            • 13.12 Gulf Oil International
              • Gulf Oil International - Overview
              • Gulf Oil International - Product / Service
              • Gulf Oil International - Key offerings
            • 13.13 Idemitsu Kosan
              • Idemitsu Kosan - Overview
              • Idemitsu Kosan - Product / Service
              • Idemitsu Kosan - Key offerings
            • 13.14 Indian Oil Corporation
              • Indian Oil Corporation - Overview
              • Indian Oil Corporation - Product / Service
              • Indian Oil Corporation - Key offerings
            • 13.15 JXTG Nippon Oil & Energy
              • JXTG Nippon Oil & Energy - Overview
              • JXTG Nippon Oil & Energy - Product / Service
              • JXTG Nippon Oil & Energy - Key offerings
            • 13.16 KLK Oleo
              • KLK Oleo - Overview
              • KLK Oleo - Product / Service
              • KLK Oleo - Key offerings
            • 13.17 Lukoil
              • Lukoil - Overview
              • Lukoil - Product / Service
              • Lukoil - Key offerings
            • 13.18 Petrobras
              • Petrobras - Overview
              • Petrobras - Product / Service
              • Petrobras - Key offerings
            • 13.19 Petronas
              • Petronas - Overview
              • Petronas - Product / Service
              • Petronas - Key offerings
            • 13.20 Shell plc
              • Shell plc - Overview
              • Shell plc - Product / Service
              • Shell plc - Key offerings
            • 13.21 TotalEnergies
              • TotalEnergies - Overview
              • TotalEnergies - Product / Service
              • TotalEnergies - Key offerings
            • 13.22 Valvoline
              • Valvoline - Overview
              • Valvoline - Product / Service
              • Valvoline - Key offerings
            • 13.23 Benjn.R.Vickers and Sons Ltd.
              • Benjn.R.Vickers and Sons Ltd. - Overview
              • Benjn.R.Vickers and Sons Ltd. - Product / Service
              • Benjn.R.Vickers and Sons Ltd. - Key offerings
            • 13.24 BP Plc
              • BP Plc - Overview
              • BP Plc - Product / Service
              • BP Plc - Key offerings
            • 13.25 Chevron Corp.
              • Chevron Corp. - Overview
              • Chevron Corp. - Product / Service
              • Chevron Corp. - Key offerings
            • 13.26 Compania Espanola de Petroleos SA
              • Compania Espanola de Petroleos SA - Overview
              • Compania Espanola de Petroleos SA - Product / Service
              • Compania Espanola de Petroleos SA - Key offerings
            • 13.27 ENEOS Holdings Inc
              • ENEOS Holdings Inc - Overview
              • ENEOS Holdings Inc - Product / Service
              • ENEOS Holdings Inc - Key offerings
            • 13.28 Eni SpA
              • Eni SpA - Overview
              • Eni SpA - Product / Service
              • Eni SpA - Key offerings
            • 13.29 Exxon Mobil Corp.
              • Exxon Mobil Corp. - Overview
              • Exxon Mobil Corp. - Product / Service
              • Exxon Mobil Corp. - Key offerings
            • 13.30 Feoso Oil Ltd.
              • Feoso Oil Ltd. - Overview
              • Feoso Oil Ltd. - Product / Service
              • Feoso Oil Ltd. - Key offerings
            • 13.31 FUCHS PETROLUB SE
              • FUCHS PETROLUB SE - Overview
              • FUCHS PETROLUB SE - Product / Service
              • FUCHS PETROLUB SE - Key offerings
            • 13.32 Gulf Oil International Ltd
              • Gulf Oil International Ltd - Overview
              • Gulf Oil International Ltd - Product / Service
              • Gulf Oil International Ltd - Key offerings
            • 13.33 Idemitsu Kosan Co. Ltd.
              • Idemitsu Kosan Co. Ltd. - Overview
              • Idemitsu Kosan Co. Ltd. - Product / Service
              • Idemitsu Kosan Co. Ltd. - Key offerings
            • 13.34 Indian Oil Corp. Ltd.
              • Indian Oil Corp. Ltd. - Overview
              • Indian Oil Corp. Ltd. - Product / Service
              • Indian Oil Corp. Ltd. - Key offerings
            • 13.35 PJSC LUKOIL
              • PJSC LUKOIL - Overview
              • PJSC LUKOIL - Product / Service
              • PJSC LUKOIL - Key offerings
            • 13.36 Repsol SA
              • Repsol SA - Overview
              • Repsol SA - Product / Service
              • Repsol SA - Key offerings
            • 13.37 Shell plc
              • Shell plc - Overview
              • Shell plc - Product / Service
              • Shell plc - Key offerings
            • 13.38 Sinopec Shanghai Petrochemical Co. Ltd.
              • Sinopec Shanghai Petrochemical Co. Ltd. - Overview
              • Sinopec Shanghai Petrochemical Co. Ltd. - Product / Service
              • Sinopec Shanghai Petrochemical Co. Ltd. - Key offerings
            • 13.39 Valvoline Inc.
              • Valvoline Inc. - Overview
              • Valvoline Inc. - Product / Service
              • Valvoline Inc. - Key offerings
            • 13.40 TotalEnergies SE
              • TotalEnergies SE - Overview
              • TotalEnergies SE - Product / Service
              • TotalEnergies SE - Key offerings
            • 13.41 Emirates National Oil Co. Ltd. LLC
              • Emirates National Oil Co. Ltd. LLC - Overview
              • Emirates National Oil Co. Ltd. LLC - Product / Service
              • Emirates National Oil Co. Ltd. LLC - Key offerings
            • 13.42 Gazprom Nedra LLC
              • Gazprom Nedra LLC - Overview
              • Gazprom Nedra LLC - Product / Service
              • Gazprom Nedra LLC - Key offerings

            13 Appendix

            • 13.1 Scope of the report
              • 13.2 Inclusions and exclusions checklist
                • Exhibit 186: Inclusions checklist
                • Exhibit 187: Exclusions checklist
              • 13.3 Currency conversion rates for US$
                • Exhibit 188: Currency conversion rates for US$
              • 13.4 Research methodology
                • Exhibit 189: Research methodology
                • Exhibit 190: Validation techniques employed for market sizing
                • Exhibit 191: Information sources
              • 13.5 List of abbreviations
                • Exhibit 192: List of abbreviations

              Research Methodology

              Technavio presents a detailed picture of the market by way of study, synthesis, and summation of data from multiple sources. The analysts have presented the various facets of the market with a particular focus on identifying the key industry influencers. The data thus presented is comprehensive, reliable, and the result of extensive research, both primary and secondary.

              INFORMATION SOURCES

              Primary sources

              • Manufacturers and suppliers
              • Channel partners
              • Industry experts
              • Strategic decision makers

              Secondary sources

              • Industry journals and periodicals
              • Government data
              • Financial reports of key industry players
              • Historical data
              • Press releases

              DATA ANALYSIS

              Data Synthesis

              • Collation of data
              • Estimation of key figures
              • Analysis of derived insights

              Data Validation

              • Triangulation with data models
              • Reference against proprietary databases
              • Corroboration with industry experts

              REPORT WRITING

              Qualitative

              • Market drivers
              • Market challenges
              • Market trends
              • Five forces analysis

              Quantitative

              • Market size and forecast
              • Market segmentation
              • Geographical insights
              • Competitive landscape

              Interested in this report?

              Get your sample now to see our research methodology and insights!

              Download Now

              Frequently Asked Questions

              Marine Lubricants market growth will increase by $ 41.21 mn during 2024-2028.

              The Marine Lubricants market is expected to grow at a CAGR of 2.49% during 2024-2028.

              Marine Lubricants market is segmented by Application( Engine oil, Hydraulic oil, Grease, Others) Type( Mineral oil-based marine lubricants, Bio-based marine lubricants, Synthetic marine lubricants, Others)

              BP plc, Castrol, Chevron Corporation, China Petroleum & Chemical, Croda International, ENI S.p.A., ExxonMobil Corporation, Fuchs Petrolub SE, Gazprom Neft, Gulf Oil International, Idemitsu Kosan, Indian Oil Corporation, JXTG Nippon Oil & Energy, KLK Oleo, Lukoil, Petrobras, Petronas, Shell plc, TotalEnergies, Valvoline are a few of the key vendors in the Marine Lubricants market.

              APAC will register the highest growth rate of 46% among the other regions. Therefore, the Marine Lubricants market in APAC is expected to garner significant business opportunities for the vendors during the forecast period.

              US, Canada, Germany, UK, Italy, France, China, India, Japan, Brazil, Egypt, UAE, Oman, Argentina, KSA, UAE, Brazil, Rest of World (ROW)

              • Growing need for optimized engine performance and fuel efficiency The need for optimized engine performance and fuel efficiency stands as a significant driver for the global marine lubricants market is the driving factor this market.
              • fueling demand for high-performance lubricants engineered to enhance maritime operations. Marine lubricants play a pivotal role in reducing friction is the driving factor this market.
              • wear is the driving factor this market.
              • and corrosion within ship engines is the driving factor this market.
              • gears is the driving factor this market.
              • and other critical components is the driving factor this market.
              • thereby maximizing efficiency and extending equipment lifespan. Efficient lubrication ensures smooth operation of marine engines is the driving factor this market.
              • minimizing energy losses and reducing fuel consumption. By reducing frictional resistance and heat generation is the driving factor this market.
              • advanced marine lubricants help vessels operate at peak performance levels while consuming less fuel is the driving factor this market.
              • translating into cost savings and environmental benefits. Moreover is the driving factor this market.
              • with the maritime industry facing increasing pressure to comply with stringent environmental regulations is the driving factor this market.
              • optimizing fuel efficiency has become paramount. Marine lubricants formulated with eco-friendly additives help reduce harmful emissions is the driving factor this market.
              • including sulfur oxides (SOx) is the driving factor this market.
              • nitrogen oxides (NOx) is the driving factor this market.
              • and particulate matter is the driving factor this market.
              • contributing to cleaner marine operations and regulatory compliance. As shipping companies strive to enhance sustainability and reduce operational costs is the driving factor this market.
              • the demand for marine lubricants tailored to improve engine performance and fuel efficiency continues to rise is the driving factor this market.
              • further boosting the demand for marine lubricants. Hence is the driving factor this market.
              • the above-mentioned factors are expected to boost the growth of the global marine lubricants market during the forecast period. is the driving factor this market.

              The Marine Lubricants market vendors should focus on grabbing business opportunities from the Engine oil segment as it accounted for the largest market share in the base year.