Marine Outboard Engines Market Size 2025-2029
The marine outboard engines market size is forecast to increase by USD 3.64 billion, at a CAGR of 5.8% between 2024 and 2029.
- The market is experiencing significant growth, driven primarily by the rising sales of boats and the increasing demand for outboard engines. Economic factors, such as disposable income and consumer confidence, are positively influencing the boat market, leading to increased demand for outboard engines. The market's vitality hinges largely on the demand for powerboats such as recreational boats, pontoon boats, personal watercraft, ski boats, and wakeboarding equipment. However, challenges persist in the form of stringent emission regulations and the ongoing trade tensions between major manufacturing countries. These obstacles necessitate continuous innovation and adaptation by market players to meet evolving consumer expectations and regulatory requirements.
- Companies seeking to capitalize on market opportunities must focus on developing fuel-efficient and environmentally friendly engines, while also navigating the complexities of international trade policies. In summary, the market presents both challenges and opportunities, with the key drivers of boat sales and demand for outboard engines underpinned by economic factors. Companies must remain agile and responsive to regulatory changes and consumer preferences to succeed in this dynamic market.
What will be the Size of the Marine Outboard Engines Market during the forecast period?

Explore in-depth regional segment analysis with market size data - historical 2019-2023 and forecasts 2025-2029 - in the full report.
Request Free Sample
The market is characterized by continuous evolution and dynamic market activities. Two-stroke engines continue to dominate the landscape, but the shift towards four-stroke engines is gaining momentum due to their improved fuel efficiency and reduced emissions. Engine mounts are a crucial component, ensuring optimal performance and stability. Fuel efficiency remains a key focus, with advancements in fuel lines, power steering systems, and cooling and lubrication systems. Corrosion resistance is a significant concern for marine applications, leading to the development of innovative materials and coatings. Cooling systems and lubrication systems are undergoing significant advancements to enhance engine longevity and reliability.
Outboard engine maintenance is a critical aspect of the market, with a growing demand for oil filters, repair manuals, and diagnostic tools. Outboard engines find applications across various sectors, including recreational boating, commercial fishing, marine surveying, and law enforcement. The market is witnessing an increasing trend towards performance upgrades, electronic throttle control, and EFI systems. Aftermarket parts, such as shift cables, air filters, spark plugs, and starter motors, are in high demand to keep these engines running smoothly. Market regulations, including EPA and CE certifications, continue to shape the market landscape. The ongoing unfolding of market activities and evolving patterns underscores the importance of staying informed about the latest trends and developments.
From fuel gauges and hour meters to prop shafts and exhaust systems, every component plays a vital role in the market.
How is this Marine Outboard Engines Industry segmented?
The marine outboard engines industry research report provides comprehensive data (region-wise segment analysis), with forecasts and estimates in "USD million" for the period 2025-2029, as well as historical data from 2019-2023 for the following segments.
- Power Rating
- Low-power
- Mid-power
- High-power
- Type
- 2-stroke
- 4-stroke
- Product Type
- Recreational vessels
- Fishing vessels
- Special purpose boats
- Variant
- Electric
- Manual
- Geography
- North America
- US
- Canada
- Europe
- France
- Germany
- Italy
- The Netherlands
- UK
- APAC
- China
- India
- Japan
- Rest of World (ROW)
- North America
By Power Rating Insights
The low-power segment is estimated to witness significant growth during the forecast period.
Marine outboard engines have seen advancements in technology, leading to smaller engines with comparable power and performance to previous generations. These improvements include the use of forced induction and direct injection technology. However, the marine industry's carbon emissions continue to rise, with approximately 2.5% of Europe's total greenhouse gas emissions coming from the sector. Regulatory bodies and governments have responded by implementing stringent rules and regulations to reduce emissions. Outboard motors and trolling motors are essential components of recreational boating and commercial fishing. Four-stroke engines, which are more fuel-efficient and emit fewer pollutants than two-stroke engines, are gaining popularity.

EPA regulations and CE certification ensure safety and environmental standards are met. Maintenance schedules, engine rebuilds, and repair manuals are crucial for outboard engine owners. Performance upgrades, such as electronic throttle control, ignition systems, and fuel injection systems, enhance engine capabilities. Exhaust systems, cooling systems, and lubrication systems ensure engine longevity. Accessories like digital displays, shift cables, air filters, spark plugs, starter motors, and fuel tanks are essential for optimal engine performance. Custom fabrication, wiring harnesses, control cables, and ignition systems cater to specific boating needs. Outboard engine sales are driven by recreational boating and commercial fishing industries.
Fuel efficiency, corrosion resistance, and fuel lines are critical factors in engine selection. Emissions standards, hour meters, and trim tabs are essential for commercial fishing and law enforcement applications. Outboard engine distribution networks ensure availability and accessibility of parts and services. Aftermarket parts, including service parts, efi systems, diagnostics tools, and fuel injection systems, cater to the growing demand for engine upgrades and repairs. Marine surveying and search and rescue operations rely on outboard engines for mobility and efficiency. Remote controls, prop shafts, and exhaust systems are essential components for these applications. The marine industry's evolving needs continue to drive innovation in outboard engine technology.
The Low-power segment was valued at USD 4.4 billion in 2019 and showed a gradual increase during the forecast period.
Regional Analysis
North America is estimated to contribute 41% to the growth of the global market during the forecast period. Technavio's analysts have elaborately explained the regional trends and drivers that shape the market during the forecast period.
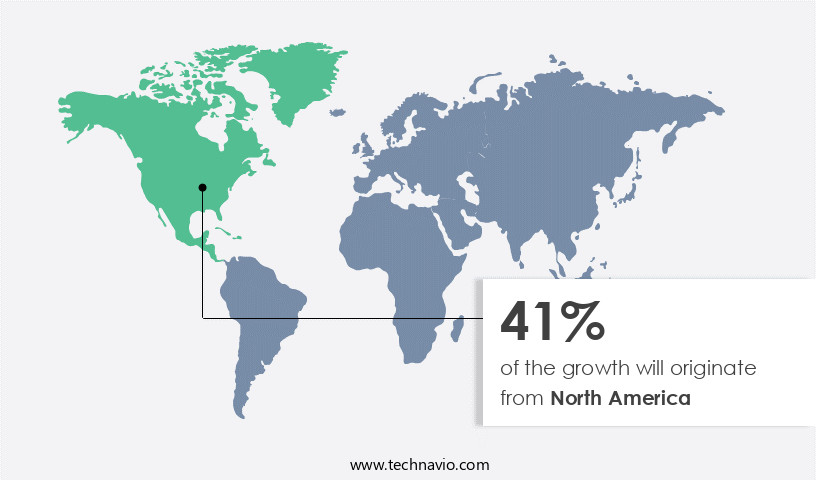
In North America, the US and Canada represent significant markets for marine outboard engines. The US, in particular, experiences robust sales driven by various watercraft types, including pontoon boats, new ski boats, personal watercraft, powerboats, and aluminum fishing boats. Wakeboards, ski boats, and personal watercraft also experienced an uptick in sales during Q4 2020. Florida, Michigan, California, and Wisconsin are leading states for marine outboard engine demand in the US. Recreational activities, such as water sports and fishing, are primary drivers of market growth. Certifications, like NMMA and CE, ensure safety and compliance with regulations. Digital displays, instrument panels, and electronic throttle control enhance user experience.
Four-stroke engines offer improved fuel efficiency and lower emissions, aligning with EPA regulations. Performance upgrades, including ignition systems, exhaust systems, and fuel injection systems, cater to diverse user needs. Maintenance schedules, engine rebuilds, and repair manuals support the aftermarket parts sector. Custom fabrication, wiring harnesses, and control cables enable customization. Commercial fishing and marine surveying industries rely on marine outboard engines for productivity. Law enforcement and search and rescue operations utilize them for quick response. Outboard engine distribution networks ensure accessibility, while fuel gauges and hour meters facilitate engine monitoring. Trim tabs and prop shafts optimize performance, while cooling and lubrication systems maintain engine health.
Exhaust systems and corrosion resistance address durability concerns. Marine surveying, performance upgrades, and electronic throttle control are emerging trends. EFI systems, diagnostics tools, and fuel injection systems offer advanced technology. Direct injection and two-stroke engines cater to diverse power requirements. Engine mounts and power steering enhance user convenience. In conclusion, the North American the market is characterized by diverse applications, regulatory compliance, and technological advancements.
Market Dynamics
Our researchers analyzed the data with 2024 as the base year, along with the key drivers, trends, and challenges. A holistic analysis of drivers will help companies refine their marketing strategies to gain a competitive advantage.
The market is a dynamic and competitive industry, driven by innovation and consumer demand for efficient, reliable, and eco-friendly power solutions. Manufacturers continually invest in research and development to produce high-performance engines that cater to various applications, from small recreational boats to commercial fishing vessels. Key players in this market focus on fuel efficiency, low emissions, and ease of use. Advanced technologies like electronic fuel injection, four-stroke engines, and digital controls are shaping the future of marine outboard engines. Consumers seek out features like quiet operation, versatility, and durability, making the market a vibrant and evolving landscape. Innovations in materials, design, and manufacturing processes further enhance the appeal and performance of marine outboard engines. This market is poised for growth, with trends towards electric and hybrid powertrains adding to the diverse range of options available to boaters and commercial operators alike.

What are the key market drivers leading to the rise in the adoption of Marine Outboard Engines Industry?
- The significant increase in boat sales serves as the primary catalyst for market growth.
- The market experiences significant growth due to the increasing demand for powerboats, such as pontoon boats, personal watercraft, ski boats, and wakeboards. Factors driving this demand include a robust economy, high consumer confidence, employment growth, and rising disposable income. In 2023 and 2024, the sales of these boats saw a notable increase, marking the strongest sales since 2006. The US boating industry, in particular, has been positively impacted by the economic recovery, a strong job market, and decreasing fuel prices.
- Additionally, the market is witnessing advancements in technology, with the integration of features like fuel gauges, hour meters, emissions standards, lower unit cooling systems, trim tabs, electronic throttle control, service parts, EFI systems, diagnostics tools, and fuel injection systems. These enhancements cater to the evolving needs of boaters and contribute to the market's growth.
What are the market trends shaping the Marine Outboard Engines Industry?
- The increasing demand for outboard engines represents a significant market trend in the maritime industry. Outboard engines are becoming increasingly popular due to their versatility, efficiency, and ease of use.
- Marine outboard engines have gained significant popularity in the global market due to the rising trend in recreational boating. The advancements in engine technology have led to increased power and portability, making outboard engines the preferred choice over inboard engines for many boat owners. Two-stroke engines, a type of outboard engine, are widely used in small fishing boats and pontoon boats due to their lightweight and fuel efficiency. The demand for marine outboard engines is further driven by the increasing sales of recreational boats. Outboard engines are the primary power source for most recreational boats, including small fishing boats, pontoon boats, and speedboats.
- The growing popularity of boat shows and water-related activities has also contributed to the increasing demand for these engines. Moreover, the features of marine outboard engines, such as engine mounts, fuel efficiency, corrosion resistance, cooling systems, lubrication systems, outboard engine maintenance, oil filters, outboard engine repair, remote controls, and power steering, make them an attractive option for boat owners. These engines are also widely used in law enforcement and commercial applications due to their reliability and performance. In conclusion, the marine outboard engine market is witnessing robust growth due to the increasing participation in recreational boating, advancements in engine technology, and the unique features of outboard engines.
- The demand for these engines is expected to remain strong due to their versatility and performance.
What challenges does the Marine Outboard Engines Industry face during its growth?
- The growth of the boat industry is significantly influenced by various economic factors that impact boat sales.
- Outboard engines are a crucial component of the boating industry, with demand closely tied to boat sales. The economic climate significantly influences the boating sector, with factors such as the global economy's performance, job market prospects, sales opportunities, and disposable consumer income all playing a role. The geographical location also matters, as the majority of boat sales occur in countries with significant coastal areas. The demand for marine outboard engines experiences cyclical fluctuations, with periods of decreased demand typically followed by increased sales momentum in subsequent years. Compliance with certifications, such as NMMA and CE, is essential for manufacturers and aftermarket suppliers.
- Key components of outboard engines include digital displays, shift cables, air filters, spark plugs, fuel tanks, and trolling motors. EPA regulations impact the manufacturing process, particularly for four-stroke engines. Aftermarket parts are a significant market, with demand driven by the need for maintenance and repairs. Fuel efficiency and reliability are critical considerations for consumers.
Exclusive Customer Landscape
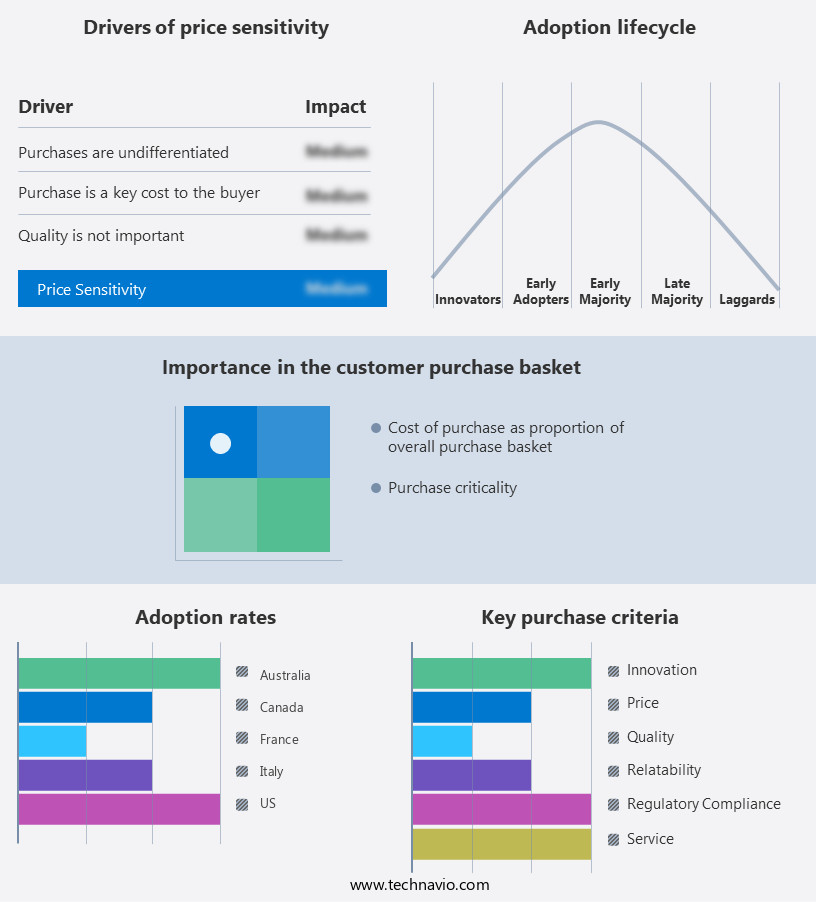
The marine outboard engines market forecasting report includes the adoption lifecycle of the market, covering from the innovator's stage to the laggard's stage. It focuses on adoption rates in different regions based on penetration. Furthermore, the marine outboard engines market report also includes key purchase criteria and drivers of price sensitivity to help companies evaluate and develop their market growth analysis strategies.
Customer Landscape
Key Companies & Market Insights
Companies are implementing various strategies, such as strategic alliances, marine outboard engines market forecast, partnerships, mergers and acquisitions, geographical expansion, and product/service launches, to enhance their presence in the industry.
AB Volvo - Marine outboard engines feature advanced technology, including a 115A alternator with charging sensor, electronic vessel control instrumentation, and NMEA interface, enhancing performance and convenience.
The industry research and growth report includes detailed analyses of the competitive landscape of the market and information about key companies, including:
- AB Volvo
- Bombardier Recreational Products Inc.
- Brunswick Corp.
- Cox Powertrain Ltd.
- DEUTZ AG
- Elco Motor Yachts
- Greaves Cotton Ltd.
- Hangzhou Hidea Power Machinery Co. Ltd.
- Honda Motor Co. Ltd.
- Kraeutler Elektromaschinen GmbH
- LEHR Holdings LLC
- Mahindra and Mahindra Ltd.
- Oxe Marine AB
- Parsun
- Suzuki Motor Corp.
- TAIZHOU GONGDA MOTORS PARTS CO. LTD.
- Tohatsu Corp.
- West Marine
- Yamaha Motor Co. Ltd.
- Yongkang Longxiao Industry and Trade Co. Ltd.
Qualitative and quantitative analysis of companies has been conducted to help clients understand the wider business environment as well as the strengths and weaknesses of key industry players. Data is qualitatively analyzed to categorize companies as pure play, category-focused, industry-focused, and diversified; it is quantitatively analyzed to categorize companies as dominant, leading, strong, tentative, and weak.
Recent Development and News in Marine Outboard Engines Market
- In January 2024, Mercury Marine, a leading manufacturer of recreational and commercial marine engines, announced the launch of their new Verado 4.6L V8 FourStroke outboard engine. This innovative engine offers improved fuel efficiency and reduced emissions, making it a popular choice among marine enthusiasts (Mercury Marine Press Release).
- In March 2024, Suzuki Motor Corporation and Yamaha Motor Co. Ltd. announced a strategic partnership to collaborate on the development of electric outboard motors. This collaboration aims to accelerate the transition towards sustainable marine propulsion systems (Suzuki Motor Corporation Press Release).
- In April 2025, BRP, the parent company of Evinrude, completed the acquisition of Bombardier Recreational Products' marine business. This acquisition significantly expanded BRP's market share in the market (BRP Press Release).
- In May 2025, Volvo Penta, a leading marine engine manufacturer, received approval from the U.S. Environmental Protection Agency for their new D13-700 diesel outboard engine. This engine is the most powerful diesel outboard engine on the market, offering increased efficiency and reduced emissions (Volvo Penta Press Release).
Research Analyst Overview
- The market exhibits dynamic activity, with various segments experiencing growth. Marine accessories, such as online marketplaces for used outboard engines, fuel additives, and engine oils, continue to gain traction among boat owners. Two-stroke and four-stroke oil remain essential, with the latter's increasing popularity due to its environmental friendliness. Hybrid outboards, rental fleets, and financing options expand the market's reach. Winterization kits, biodegradable oil, and safety gear are essential for seasonal maintenance. AIS transponders, navigation systems, and emergency equipment ensure safe boating experiences. Dealer networks, anti-fouling paints, and boat repair kits cater to the maintenance needs of boat owners. Electric outboards, engine covers, hull cleaning, bilge pumps, life jackets, engine swaps, storage solutions, and boat cleaning supplies enhance the boating experience.
- Synthetic oil, boat repair kits, and training programs contribute to engine longevity. Propeller guards, marine insurance, high-thrust outboards, and service contracts offer peace of mind to boaters. GPS chartplotters and boat detailing complete the essential marine outboard engine market offerings.
Dive into Technavio's robust research methodology, blending expert interviews, extensive data synthesis, and validated models for unparalleled Marine Outboard Engines Market insights. See full methodology.
|
Market Scope |
|
|
Report Coverage |
Details |
|
Page number |
234 |
|
Base year |
2024 |
|
Historic period |
2019-2023 |
|
Forecast period |
2025-2029 |
|
Growth momentum & CAGR |
Accelerate at a CAGR of 5.8% |
|
Market growth 2025-2029 |
USD 3638.1 million |
|
Market structure |
Fragmented |
|
YoY growth 2024-2025(%) |
5.3 |
|
Key countries |
US, Canada, UK, Germany, Italy, France, The Netherlands, China, Japan, and India |
|
Competitive landscape |
Leading Companies, Market Positioning of Companies, Competitive Strategies, and Industry Risks |
What are the Key Data Covered in this Marine Outboard Engines Market Research and Growth Report?
- CAGR of the Marine Outboard Engines industry during the forecast period
- Detailed information on factors that will drive the growth and forecasting between 2025 and 2029
- Precise estimation of the size of the market and its contribution of the industry in focus to the parent market
- Accurate predictions about upcoming growth and trends and changes in consumer behaviour
- Growth of the market across North America, Europe, APAC, South America, and Middle East and Africa
- Thorough analysis of the market's competitive landscape and detailed information about companies
- Comprehensive analysis of factors that will challenge the marine outboard engines market growth of industry companies
We can help! Our analysts can customize this marine outboard engines market research report to meet your requirements.